CERI Commodity Report Natural Gas
|
|
|
- Pierce McBride
- 5 years ago
- Views:
Transcription

1 March 15 CERI Commodity Report Natural Gas Analyzing Rig In-Activity Paul Kralovic Despite the West Texas Intermediate (WTI) oil price rebounding from a low of US$3.39 per barrel on March 17, 15 to US$55. per barrel on April 1, 15, the lower prices are creating uncertainty for producers. And with capital spending budgets being reduced among oil and gas producers, nowhere is the impact being felt more than drilling activity. It is hard to imagine that between August 9, 1 and December 5, 1 total US rig activity 15 consecutive weeks exceeded the 1,9-level. In the past months, however, along with the decrease in the price of crude oil, rig activity has plummeted to below 1, rigs. The same story rings true in Canada. When natural gas prices fell several years ago, producers tended to focus their attention to oil-directed drilling. With both commodities in a lower price environment, the reduction of capital spending will likely affect both industries. This article delves deeper into North American drilling activity both in the US and Canada and what it may mean for the industry. US Drilling Activity The total rotary rig count in the US is 95, as of the week of April 17, 15, down 3 rigs from the previous week and down 77 rigs from the same time last year a decrease of 7.9 percent. The total includes 3 classifications: offshore, land and inland. As of April 17, 15, there are 33 rigs offshore, 91 land-based and rigs that are located in inland waters. Land rigs are down CERI Commodity Report Natural Gas Editor-in-Chief: Dinara Millington (dmillington@ceri.ca) Contents Featured Article... 1 Natural Gas Prices... Weather... Consumption and Production... 1 Transportation... 1 Storage... 1 Liquefied Natural Gas Drilling Activity rigs from the previous week and down 55 rigs from the previous year. Offshore rigs remain unchanged from the previous week and are down 19 rigs over the previous year, while inland waters rigs are unchanged from the previous week, but are down 1 rigs from the previous year. Table 1.1 shows the rig count in the United States, as well as oil- and gas-directed drilling activity. Table 1.1: Rig Count in the United States US Rig Count Change Percent Change /17/15 /1/15 /1/1 Weekly Annual Weekly Annual Total U.S ,31 (3) (77) -3.% -7.9% Offshore (19).% -3.5% Land ,779 (3) (5) -3.% -.% Inland Waters 1 (1).% -71.% Oil ,51 () (77) -3.% -51.% Percent 7.9% 7.9%.5%.% -5.5% Gas () (99) -3.% -31.3% Percent.7%.% 17.3% -.% 5.5% U.S. & Canada 1,3 1,7,3 (53) (99) -.9% -9.1% Source: WTRG Economics 1 Figure 1.1 illustrates the total US rotary rig count between January 1 and present. The monthly averages decreased dramatically from 1,93 rigs in September 1 to 1,19 rigs in March 15. In terms of weekly averages, total US rotary rig count decreased from 1,99 rigs as of week ending November 1, 1 to 95 rigs as of April 17, 15. This is the lowest rig count since July 31, 9. Figure 1.1: US Rotary Rig Count Total Active Rigs Source: Energy Economist

2 Page Analyzing the oil markets, it s not a surprise that total oildirected rigs in the US have been reduced by half, from 1,9 rigs on October 1, 1 to 73 rigs on April 17, 15. This is down from 1,51 at the same time last year, or down 51. percent. As of April 17, 15, natural gas rigs decreased to 17, spending 9 consecutive weeks in the -level. Natural gas-directed rigs are down 31.3 percent over the last year, when rigs numbered 31. The percentage of gas-directed drilling decreased to less than percent, only rebounding to percent this week due to the dramatic fall in oil rig activity in the past several months. Figure 1. illustrates the total US rotary rig count used to drill for natural gas from January 1 and present. As of April 17, natural gas rigs number a mere 17 rigs and gasdirected drilling accounts for approximately percent. Figure 1.: US Rotary Rig Count Drilling for Natural Gas Source: Energy Economist 3 Table 1. shows rig activity by trajectory and well depth. Of the total rotary rig count in the US, horizontal drilling is the largest category by trajectory. As of the week of April 17, 15, there are 71 rigs that utilize horizontal drilling, down 9 rigs from the previous week and down 3 rigs from the same time last year a decrease of 39.5 percent. As of April 17, 15, there are 1 vertical rigs and 91 directional rigs. Vertical drilling is down rigs from last week and down 9 rigs from the previous year a decrease of. percent. Directional drilling is up 1 rig from the previous week but down 15 rigs from the previous year; this a decrease of 57.9 percent from the previous year. Table 1.: Rig Count in the United States by Trajectory and Depth US Rig Count Change Percent Change /17/15 /1/15 /1/1 Weekly Annual Weekly Annual Total U.S ,31 (3) (77) -3.% -7.9% Directional % -57.9% <5k >15k k-15k k-1k Horizontal , % -39.5% <5k >15k k-15k k-1k 3 Vertical % -.% <5k 3 >15k 1k-15k k-1k Source: Baker Hughes As illustrated in Table 1., US data regarding drilling depth is categorized into groups: under 5, ft, 5, ft to 1, ft, 1, ft to 15, ft, and over 15, ft. It is important to note that regardless of trajectory and well depth, rig activity is down considerably from the previous week and at the same time last year. For example, as of April 17, 15, rigs under 5, ft, 5, ft to 1, ft, 1, ft to 15, ft, and over 15, ft. are all down from the previous week and down from the same time last year. This trend is mirrored in vertical and directional drilling as well, lending to the fact that the decrease in rig activity is price-based rather than the result of longer drilling lengths resulting in less need for multiple vertical or short horizontal leg wells. Canadian Drilling Activity Canadian drilling activity is not faring much better than its southern neighbor. According to Baker Hughes, the total rotary rig count in Canada is as of the week of April 17, 15, down 19 rigs from the previous week. This is, however, 119 rigs lower than the same time last year, or a decrease of 59. percent. Drilling in both Canada and the United States totaled 1,3 rigs at April 17, 15, down 99 rigs from the same time last year a decrease of 9.1 percent.
.% -7.5% Percent 5.%.%.7%.% -17.7% Gas 79 11 (19) (5) -.1% -7.% Percent 75.% 79.% 57.3% -.% 17.7% U.S. & Canada 1,3 1,7,3 (53) (99) -.9% -9.1% Source: WTRG Economics 5 Figure 1.")

3 Page 3 Table 1.3 shows the rig count in Canada. Table 1.3: Rig Count in Canada Canadian Rig Count Change Percent Change /17/15 /1/15 /1/1 Weekly Annual Weekly Annual Canada (19) (119) -19.% -59.% Oil 5 (5).% -7.5% Percent 5.%.%.7%.% -17.7% Gas (19) (5) -.1% -7.% Percent 75.% 79.% 57.3% -.% 17.7% U.S. & Canada 1,3 1,7,3 (53) (99) -.9% -9.1% Source: WTRG Economics 5 Figure 1.3 illustrates the total Canadian rotary rig count between January 1 and present. The figure shows the cyclical nature of Canadian drilling rig activity. Spring thaw impacts drilling with annual plunges due to drilling crews needing to move their equipment to avoid environmental damage. That being said, it is clear that the peak of winter drilling activity this past year is considerably lower than in past years, as is the trough of the cycle. Figure 1.3: Canadian Rotary Rig Count Total Active Rigs drilling are gas-directed, up from a monthly average of.7 percent in March 15 and up from 1.3 percent in March 1. It is also important to note that rig utilization is only 1 percent in March 15, down from 9 percent in March 1. Figure 1. illustrates Western Canadian Sedimentary Basin (WCSB) rigs by province since January 1. There are 9 active rigs in Alberta as of April, 15, the lowest amount since May, 1. This is mirrored by only active rigs in Saskatchewan and 3 rigs in British Columbia, as of April, 15. According to the CAODC, the total average number of active rigs in Alberta is 99 in March, down from 11 in February and down from 7 in January; this is down from rigs in March of last year. And with a week left in April, drilling does not appear to be turning around; the total average number of active rigs in Alberta is 5. The total average number of active rigs in the WCSB is 15 in March, down from 317 in February and down from 3 in January, according to data from the CAODC. Figure 1.: WCSB Active Rigs by Province Weekly Average Source: CAODC and CERI Source: Energy Economist Of the active rigs in Canada, as of week ending April 17, 15, rigs are oil-directed while rigs are gasdirected. Oil-directed rigs are down from 5 rigs at the same time a year ago and gas-directed drilling rigs are down from 11 rigs at the same time last year. That s down 7.5 percent and 7. percent, respectively. Interestingly, due to the rapid decline in oil-directed drilling thus far, as of April 15, 7.3 percent of the total Figure 1.5 illustrates the number of horizontal wells drilled across Canada thus far in the first quarter. Of the total rotary rig count in Canada, horizontal drilling is the largest category by trajectory. In 1Q15, 79.1 percent of wells drilled are horizontal, this is up from 7. percent of wells in the first quarter of 1 and. percent of wells drilled in the first quarter of 13. Drilling activity in the first quarter of 15 is 1,9 total wells drilled, of which 1,5 wells are horizontal. This is down significantly from 3,5 total wells drilled in the first quarter of 1, of which,53 were horizontal.


4 Page Figure 1.5: Horizontal Wells Drilled across Canada in the First Quarter Source: Daily Oil Bulletin, April, 15 Figure 1. illustrates the total metres rig released in the first quarter in western and northern Canada. In the first quarter of 15, the total number of development and exploratory metres drilled was.7 million metres, down from 7.7 million metres in the first quarter of 1 a 39 percent decrease. Figure 1.: Total Meters Rig Released in First Quarter in Western and Northern Canada What Does it All Mean? While technological advancements in horizontal drilling have been profound, affecting the rig count, the significant decreases in rig activity of the past several months is price-based rather than the result of longer drilling lengths, which would require fewer multiple vertical, or short horizontal leg wells. Schlumberger is the latest in a long line of energy companies announcing layoffs. On April 17, 15, the world s largest oilfield services provider announced that it plans to cut 11, jobs this is in addition to the 9, jobs that it announced they would cut in January of this year. 7 The Houston- and Paris-based company is blaming lower prices and lower drilling activity. Other large players facing reductions in their workforce s include ConocoPhillips, Talisman, Nexen, Baker Hughes, Halliburton and Shell. CAODC s updated forecast for 15 estimates a total,1 wells will be drilled in Western Canada with drilling contractors recording 7,9 operating days. This is downgraded from its original forecast, released at end- November 1 that estimated 1,35 wells drilled and 119,57 operating days. 9 To put this into perspective, 11, rigs were released and 11,53 rigs were completed during 1, up from 13 when 11,1 rigs were released and 1,7 rigs were completed. 1 Drilling contractors recorded a total of 131,1 operating days in 1, 11 an increase from 1,175 operating days in The CAODC estimates that up to 3, jobs are threatened if their forecast is realized, including 3, direct jobs and up to 19,5 indirect jobs. 13 The industry association suggests that a single active drilling rig equals 135 jobs, directly at the rig, indirectly in the service sector and labour-intensive jobs in rural communities near the oil and gas exploration and production. 1 Source: Daily Oil Bulletin, April, 15 The Petroleum Services Association of Canada (PSAC) shares the sentiment. The Calgary-based organization estimates only 7,5 new wells in 15 in Canada, nearly,5 wells, or percent, lower than their original forecast, released in October of last year. Their original 15 forecast estimated 1,1 wells, but was downgraded due to lower oil and natural gas prices. 15
5 Page 5 Endnotes 1 WTRG Economics, North American Rotary Rig Counts, website, Weekly Rotary Rig Count, exploration/rotaryrigweekly.html 3 ibid Baker Hughes, US Rig Count Total Report, gis.bakerhughesdirect.com/reports/stdrpttotals.aspx 5 WTRG Economics, North American Rotary Rig Counts, website, Weekly Rotary Rig Count, exploration/rotaryrigweekly.html 7 Powersource website, Schlumberger to cut more jobs, expects delay in U.S. land drilling recovery, powersource.post-gazette.com/powersource/companies -powersource/15//17/schlumberger-to-cut-morejobs-expects-delay-in-u-s-land-drilling-recovery/ stories/15179 CAODC website, CAODC Forecast 15, ibid 1 ibid 11 CAODC website, CAODC Drilling Activity 1, CAODC website, CAODC Drilling Activity 13, CAODC website, Oil Drillers Buckling Prices Decline, 1 CAODC website, Rig Counts, 15 Calgary Herald website, business/energy/psac-drilling-forecast-adjusted-lower-to -75-wells-in-15
6 Page Henry Hub/AECO-C Henry Hub/Chicago Beginning of Next Month Spot Price (US$/MMBtu) Beginning of Next Month Spot Price (US$/MMBtu) 1 Differential Henry Hub AECO-C Jan-5 Jul- Jan- Jul-9 Jan-11 Jul-1 Jan-1 15 Differential Henry Hub Chicago Jan-5 Jul- Jan- Jul-9 Jan-11 Jul-1 Jan-1 SOURCE: CERI, Platts Gas Daily Price Guide. SOURCE: CERI, Platts Gas Daily Price Guide. Henry Hub/Rockies Beginning of Next Month Spot Price (US$/MMBtu) 15 Differential Henry Hub Rockies Jan-5 Jul- Jan- Jul-9 Jan-11 Jul-1 Jan-1 Henry Hub/Southern California Beginning of Next Month Spot Price (US$/MMBtu) 15 Differential Henry Hub Southern California Jan-5 Jul- Jan- Jul-9 Jan-11 Jul-1 Jan-1 SOURCE: CERI, Platts Gas Daily Price Guide. SOURCE: CERI, Platts Gas Daily Price Guide. CERI Commodity Report - Natural Gas


7 SOURCE: Canadian Gas Association. SOURCE: CERI, Canadian Gas Association, Statistics Canada. Page , Canadian Heating Degree Days 5-Year Avg US Heating Degree Days 5-Year Avg SOURCE: NOAA. SOURCE: CERI, NOAA, EIA. Canadian Heating Degree Days vs Residential and Commercial Consumption Degree Days BCFPD 1, 7 Degree Days Consumption 1, Jan-9 Jan-1 Jan-11 Jan-1 Jan-13 Jan-1 Jan-15 US Heating Degree Days vs Residential and Commercial Consumption Degree Days 1, BCFPD Degree Days Consumption 1, Jan-9 Jan-1 Jan-11 Jan-1 Jan-13 Jan-1 Jan-15


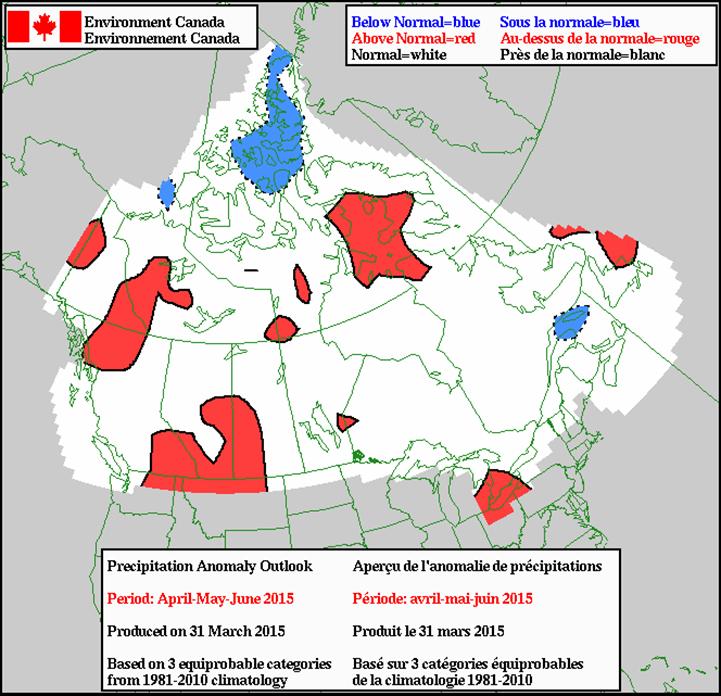
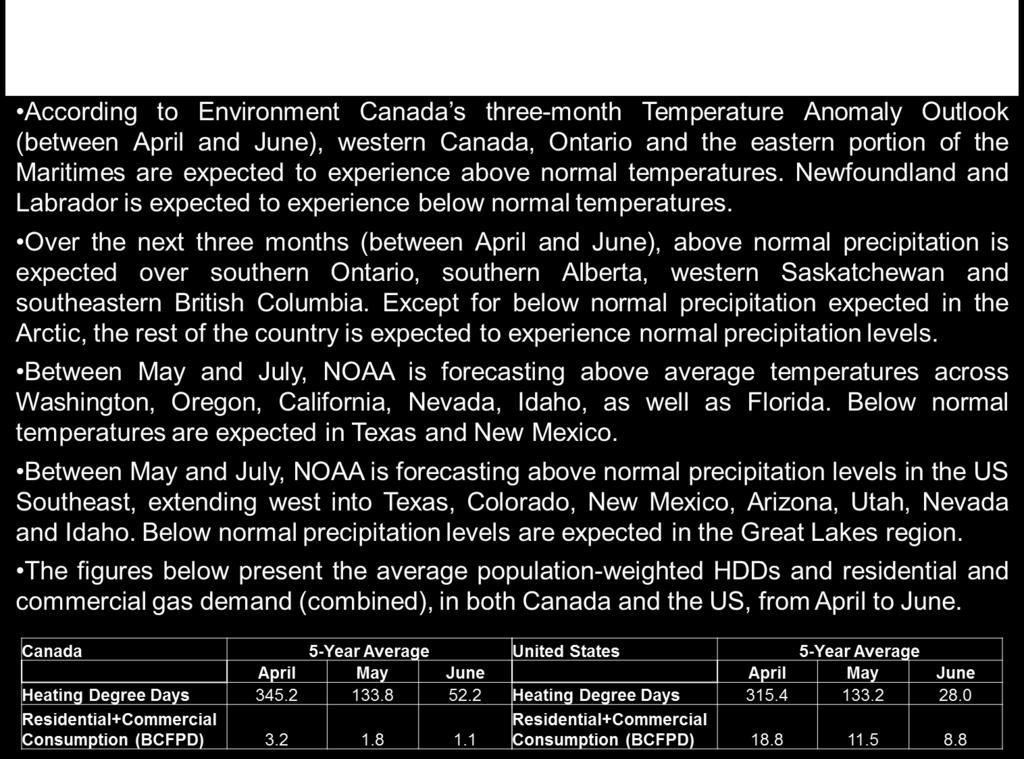
8 CERI Commodity Report - Natural Gas SOURCE: Environment Canada. SOURCE: NOAA. SOURCE: Environment Canada. SOURCE: NOAA. Page

9 SOURCE: NOAA. SOURCE: Environment Canada. SOURCE: NOAA. Page 9

 1 Industrial Electric Power Commercial")
 BC, Yukon, NWT AB SK E.")
10 SOURCE: Statistics Canada. SOURCE: Statistics Canada, NEB. SOURCE: EIA. SOURCE: EIA. Page 1 Canadian Consumption By Sector (Bcfpd) 1 Industrial & Power Commercial Residential Jan-9 Jan-1 Jan-11 Jan-1 Jan-13 Jan-1 Jan-15 US Consumption By Sector (Bcfpd) 1 Industrial Electric Power Commercial Residential 1 1 Jan-9 Jan-1 Jan-11 Jan-1 Jan-13 Jan-1 Jan-15 1 Canadian Marketable Production By Province/Region (Bcfpd) BC, Yukon, NWT AB SK E. Coast Jan-9 Jan-1 Jan-11 Jan-1 Jan-13 Jan-1 Jan-15 US Marketable Production (Bcfpd) 9 US Total Louisiana GOM Federal Waters Texas Jan-9 Jan-1 Jan-11 Jan-1 Jan-13 Jan-1 Jan-15 CERI Commodity Report - Natural Gas
 5. 13")
 1. 13 1 15.")
 13 1 15 East Coast Marketable")

11 Page 11 BC, Yukon, NWT Marketable Production (Bcfpd) Saskatchewan Marketable Production (Bcfpd) Alberta Marketable Production (Bcfpd) East Coast Marketable Production (Bcfpd) SOURCE: Statistics Canada, NEB. SOURCE: Statistics Canada, NEB. SOURCE: Statistics Canada, NEB. SOURCE: Statistics Canada, NEB.

 13 1 15 Canadian Gas Exports to the US By Export")
 Empress")
 Emerson")
12 SOURCE: CERI. SOURCE: CERI. SOURCE: NEB. SOURCE: NEB. Page System Field Receipts TransCanada + Westcoast; Monthly Average (Bcfpd) Canadian Gas Exports to the US By Export Point - West (Bcfpd) Kingsgate Monchy Elmore Huntingdon Feb-1 Apr-1 Jun-1 Aug-1 Oct-1 Dec-1 Feb Alberta System Deliveries (Bcfpd) Empress McNeill AB-BC Alliance Mar-1 May-1 Jul-1 Sep-1 Nov-1 Jan-15 Mar-15 Canadian Gas Exports to the US By Export Point - East (Bcfpd) Emerson Iroquois Others Niagara Feb-1 Apr-1 Jun-1 Aug-1 Oct-1 Dec-1 Feb-15 CERI Commodity Report - Natural Gas

 1 1 Canada")
 West MidWest East Feb-1 Apr-1 Jun-1 Aug-1 Oct-1 Dec-1")
13 SOURCE: NEB. SOURCE: NEB. SOURCE: NEB, EIA. SOURCE: NEB. Page 13 US Imports of Canadian Gas By US Region (Bcfpd) 1 West MidWest East 1 Feb-1 Apr-1 Jun-1 Aug-1 Oct-1 Dec-1 Feb-15 Total US Pipeline Gas Imports (Bcfpd) 1 1 Canada Mexico 1 Jan-1 Mar-1 May-1 Jul-1 Sep-1 Nov-1 Jan Average Canadian Export Price By US Region (C$/GJ) West MidWest East Feb-1 Apr-1 Jun-1 Aug-1 Oct-1 Dec-1 Feb-15 Canadian Gas Imports By Import Point (Bcfpd) Courtright Sarnia St. Clair Other Feb-1 Apr-1 Jun-1 Aug-1 Oct-1 Dec-1 Feb-15

 US Storage by Region (Bcf, Month-end),5,,5 East West Producing Region 5-Year Avg.")
14 Page 1 Canadian Working Gas Storage (Bcf, Month-end) Canadian Storage by Region (Bcf, Month-end) 1, Year Avg West East Mar-1 May-1 Jul-1 Sep-1 Nov-1 Jan-15 Mar-15 SOURCE: CERI, Platts Gas Daily. SOURCE: CERI, Platts Gas Daily. US Lower- Working Gas Storage (Bcf, Month-end) US Storage by Region (Bcf, Month-end),5,,5 East West Producing Region 5-Year Avg. 1 15, 3,5 3,5 3,,5, 1,5 1, 5 3,,5, 1,5 1, 5 Mar-1 May-1 Jul-1 Sep-1 Nov-1 Jan-15 Mar-15 SOURCE: CERI, Platts Gas Daily. SOURCE: CERI, Platts Gas Daily. CERI Commodity Report - Natural Gas
 Eastern Canadian Storage Injections/Withdrawals")

 15")
15 Page 15 WC_IJ_WD Western Canada Storage Injections/Withdrawals (Bcf, Month-end) Eastern Canadian Storage Injections/Withdrawals (Bcf, Month-end) 5-Year Avg Year Avg SOURCE: CERI, Platts Gas Daily. SOURCE: CERI, Platts Gas Daily. Canadian Storage Injections/Withdrawals (Bcf, Month-end) 15 5-Year Avg SOURCE: CERI, Platts Gas Daily.


16 SOURCE: CERI, Platts Gas Daily. SOURCE: CERI, Platts Gas Daily. SOURCE: CERI, Platts Gas Daily. SOURCE: CERI, Platts Gas Daily. Page 1 US Western Consuming Region Storage Injections/Withdrawals (Bcf, Month-end) 1 5-Year Avg US Producing Region Storage Injections/Withdrawals (Bcf, Month-end) 5-Year Avg US Eastern Storage Injections/Withdrawals (Bcf, Month-end) 5-Year Avg US Storage Injections/Withdrawals (Bcf, Month-end) 5-Year Avg CERI Commodity Report - Natural Gas
 Other Nigeria Trinidad Norway Qatar Yemen Feb-13 May-13 Aug-13 Nov-13 Feb-1 May-1 Aug-1")
 1 13 1 15 1 1 1 1 SOURCE: US DOE.")
17 Page Eastern US LNG Imports By Facility (Bcf) Cove Point Elba Island Everett NE Gateway Neptune Feb-13 May-13 Aug-13 Nov-13 Feb-1 May-1 Aug-1 Nov-1 Feb-15 US LNG Imports By Origin (Bcf) Other Nigeria Trinidad Norway Qatar Yemen Feb-13 May-13 Aug-13 Nov-13 Feb-1 May-1 Aug-1 Nov-1 Feb-15 US GoM LNG Imports By Facility (Bcf) Freeport Lake Charles Sabine Pass Cameron Golden Pass Gulf LNG Feb-13 May-13 Aug-13 Nov-13 Feb-1 May-1 Aug-1 Nov-1 Feb-15 Volume-Weighted Average LNG Price (US$/MMBtu) SOURCE: US DOE. SOURCE: US DOE. SOURCE: US DOE. SOURCE: US DOE.
 5 3 1 Feb-13")

 7 Mexico")


18 Page 1 Japan US LNG Exports to Japan (Bcf) Feb-13 May-13 Aug-13 Nov-13 Feb-1 May-1 Aug-1 Nov-1 Feb-15 US LNG Re-Exports By Destination (Bcf) 7 Mexico Brazil Japan Feb-13 May-13 Aug-13 Nov-13 Feb-1 May-1 Aug-1 Nov-1 Feb-15 SOURCE: US DOE, NEB. SOURCE: US DOE. SOURCE: EIA, US DOE. SOURCE: US DOE. CERI Commodity Report - Natural Gas
19 SOURCE: CERI, CAODC, Baker Hughes. SOURCE: CERI, CAODC. SOURCE: CERI, CAODC. SOURCE: CERI, CAODC. Page 19 North American Active Rigs 3, US WCSB,5, 1,5 1, 5 Jan- Jan-7 Jan- Jan-9 Jan-1 Jan-11 Jan-1 Jan-13 Jan-1 Jan-15 WCSB Active Rigs by Province Weekly Average 7 SK AB BC Jan-9 Jan-1 Jan-11 Jan-1 Jan-13 Jan-1 Jan-15 Canadian Rig Fleet Utilization Weekly Average Active Rigs 1, Active Rigs Total Rig Drilling Fleet Jan- Jan-7 Jan- Jan-9 Jan-1 Jan-11 Jan-1 Jan-13 Jan-1 Jan-15 Western Canada Active Rigs Weekly Average 7 5-Year Avg Week Number

20 SOURCE: CERI, Baker Hughes. SOURCE: CERI, Baker Hughes. SOURCE: CERI, Baker Hughes. Page US Total Active Rigs,, Oil-directed Gas-directed Gas-directed %, 1, 1, 1, 1, 1, Jan- Jan-7 Jan- Jan-9 Jan-1 Jan-11 Jan-1 Jan-13 Jan-1 Jan-15 1% 9% % 7% % 5% % 3% % 1% % US Gulf of Mexico Active Rigs 1 1 Oil-directed Gas-directed Jan- Jan-7 Jan- Jan-9 Jan-1 Jan-11 Jan-1 Jan-13 Jan-1 Jan-15 US Total Active Rigs,5 Total Oil-directed GoM Gas-directed Onshore Gas-directed, 1,5 1, 5 Jan- Jan-7 Jan- Jan-9 Jan-1 Jan-11 Jan-1 Jan-13 Jan-1 Jan-15 CERI Commodity Report - Natural Gas