EVALUATING LOW IMPACT DEVELOPMENT BEST MANAGEMENT PRACTICES AS AN ALTERNATIVE TO TRADITIONAL URBAN STORMWATER MANAGEMENT
|
|
|
- Nathan Ryan
- 5 years ago
- Views:
Transcription


1 EVALUATING LOW IMPACT DEVELOPMENT BEST MANAGEMENT PRACTICES AS AN ALTERNATIVE TO TRADITIONAL URBAN STORMWATER MANAGEMENT Brandon Holzbauer-Schweitzer Region 6 Stormwater Conference 10/05/2016

2 Introduction Hypothesis and Objectives Study Site Methodology Results, Discussions and Conclusions 2
3 INTRODUCTION 3
4 INTRODUCTION Why is this study important? Urban land use is increasing in the Lake Thunderbird watershed Lake Thunderbird is listed as 303 (d) impaired waterbody 4
5 INTRODUCTION Implementation of Low Impact Development (LID) Best Management Practices (BMPs) is an alterative stormwater management approach 5
6 INTRODUCTION Trailwoods sampling has been completed in two phases 6
7 URBANIZATION IMPACTS STORMWATER QUALITY Increased imperviousness leads to: Flooding Habitat loss Resulting Impacts Channel Erosion widening Streambed alteration Increased volume X X X X X Increased peak flow X X X X X Increased peak flow duration Increased stream temperature Decreased base flow X X X X X X X Changes in sediment loadings X X X X X Environmental Protection Agency., Urbanization and Streams: Studies of Hydrologic Impacts, EPA 841-R Kloss, C., and Calarusse, C., Rooftops to Rivers: Green Strategies for Controlling Stormwater and Combined Sewer Overflows, Natural Resources Defense Council, Low Impact Development Center, and University of Maryland School of Public Policy. 7
8 URBANIZATION IMPACTS STORMWATER QUALITY Watershed Impervious Level Effect 10% Degraded water quality Environmental Protection Agency., Urbanization and Streams: Studies of Hydrologic Impacts, EPA 841-R % Inadequate fish and insect habitat along with shoreline and stream channel erosion 35-50% Runoff equals 30% of rainfall volume >75% Runoff equals 55% of rainfall volume Kloss, C., and Calarusse, C., Rooftops to Rivers: Green Strategies for Controlling Stormwater and Combined Sewer Overflows, Natural Resources Defense Council, Low Impact Development Center, and University of Maryland School of Public Policy. 8
9 EVALUATING TRADITIONAL STORMWATER MANAGEMENT Typically consists of: Curb and gutter collection systems Drains and storm sewer conveyances Detention and retention ponds 9
10 EVALUATING TRADITIONAL STORMWATER MANAGEMENT Divert stormwater runoff from urban areas as quickly as possible 10

11 EVALUATING TRADITIONAL STORMWATER MANAGEMENT Addresses only water quantity and pays no attention to water quality 11
12 STORMWATER RUNOFF DEGRADES SURFACE WATER BODIES Rivers and Streams Lakes, Ponds, and Reservoirs 3271 miles good water acres good water miles impaired water acres impaired water 2014 Oklahoma Lotic Assessment 2014 Oklahoma Lentic Assessment 24% 17% 76% 83% Oklahoma Lotic Waters Assessed Oklahoma Lentic Waters Assessed 18% 42% 82% 58% 12
13 STORMWATER RUNOFF DEGRADES SURFACE WATER BODIES CONTINUED Possible Causes of Impairment Lotic (miles) Lentic (acres) Algal Growth Ammonia 46 Nutrients Dissolved Oxygen Depletion Pathogens Turbidity Environmental Protection Agency. 2016b, Oklahoma water quality assessment report, Retrieved July 2, 2016, from ( tate.control?p_state=ok#total_assessed_ waters). 13
14 STORMWATER RUNOFF DEGRADES SURFACE WATER BODIES CONTINUED Environmental Protection Agency. 2016b, Oklahoma water quality assessment report, Retrieved July 2, 2016, from ( tate.control?p_state=ok#total_assessed_ waters). Possible Sources of Impairment Lotic (miles) Lentic (acres) Agricultural Urban Stormwater Unknown
15 LID BMP BACKGROUND LID BMPs are relatively new concepts developed in the early 1990 s 15
16 LID BMP BACKGROUND Goal: Treat the water as close to where it falls as possible 16

17 LID BMP BACKGROUND LID BMPs attempt to model natural processes and simulate pre-development hydrology 17

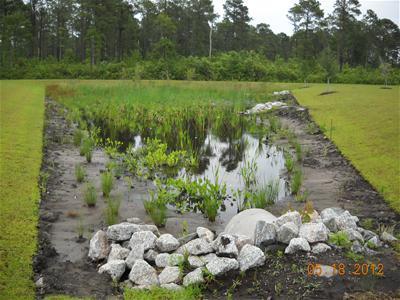


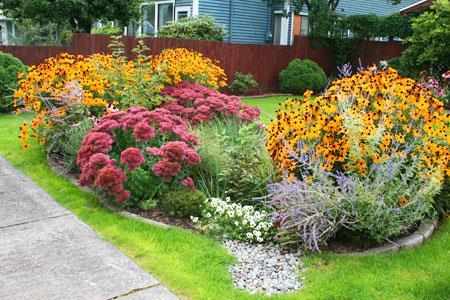
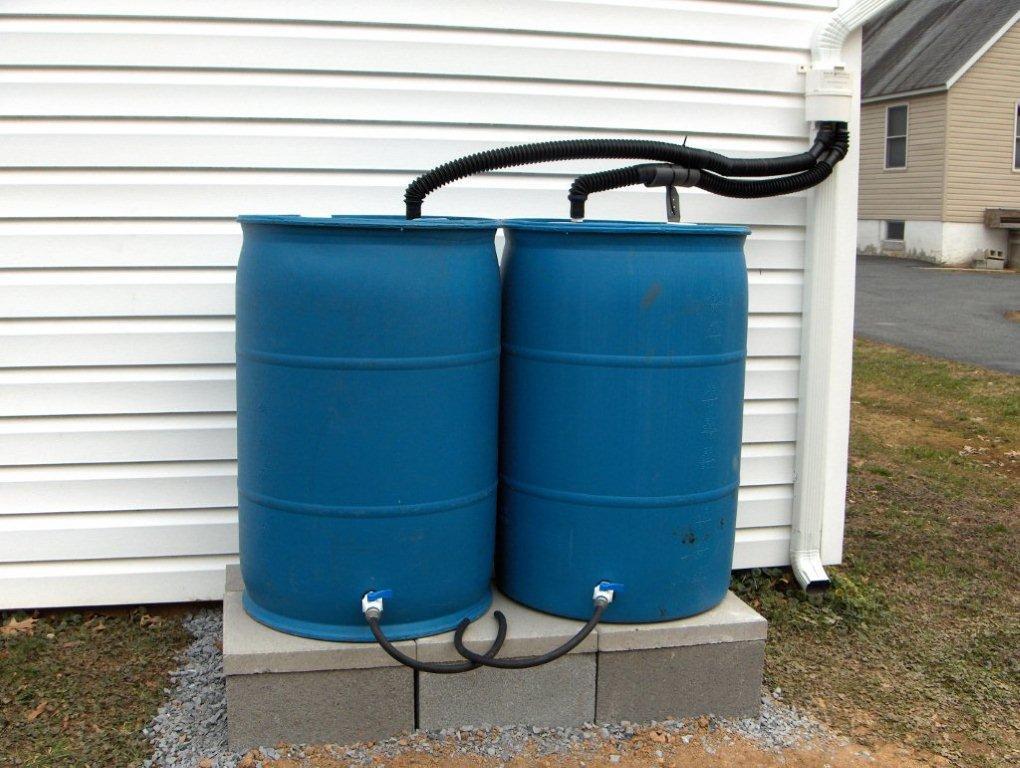

18 Constructed wetland Infiltration basin Rain garden Rain barrel Green roof Permeable pavement
19 LID BMPS PURPOSE Short, High Volume Peak Lag Time Increased Total Runoff Volume Prolonged, Low Volume Peak Gradual Regression 19
20 ECOSYSTEM SERVICES Ecosystems are defined by a complex set of interactions between plants, animals, microorganisms, humans, and the non-living environment 20

21 ECOSYSTEM SERVICES Evaluation is necessary to document: How changes in ecosystem services impact human well-being How changes to ecosystems may affect future generations What modifications can be made at various scales to improve ecosystem management and drive sustainability 21
22 ECOSYSTEM SERVICES Functions Processes and Components Goods and Services Regulating Maintenance of essential ecological processes Water regulation Role of land cover in regulating runoff and river discharge Drainage and natural irrigation Nutrient regulation Role of biota in storage and recycling nutrients Maintenance of productive ecosystems Supporting Providing habitat for plant and animal species Nursery Suitable reproductive habitat Hunting; Gathering; Aquaculture Provisioning Food and Water Cultural Provisioning of natural resources Conversion of solar energy into edible plants and animals; purification and storage of water Providing opportunities for cognitive development Fuel and Energy Science and education Variety in nature with scientific and educational values Use of nature of education and research 22
23 ECOSYSTEM SERVICES Functions Processes and Components Goods and Services Regulating Maintenance of essential ecological processes Water regulation Role of land cover in regulating runoff and river discharge Drainage and natural irrigation Nutrient regulation Role of biota in storage and recycling nutrients Maintenance of productive ecosystems 23
24 HYPOTHESES AND OBJECTIVES 24
25 HYPOTHESES Utilization of LID BMPs will demonstrate a difference in the total volume of stormwater runoff generated and the peak volumetric discharge rate for any given storm event 25
26 HYPOTHESES Implementation of LID BMPs will demonstrate a difference in urban stormwater runoff pollutant concentrations and loads for ammonia-nitrogen, nitrate-nitrogen, total nitrogen, total dissolved phosphorus, total phosphorus, trace metals, and total suspended sediment 26
27 HYPOTHESES Employment of LID BMPs for urban stormwater management will provide ecosystem services (compared to traditional stormwater management) that can result in long term economic benefits 27
28 OBJECTIVES Collect storm-event derived stormwater runoff quantity data from treatment (incorporating LID BMP stormwater management practices) and control (incorporating traditional stormwater management practices) watersheds of similar size and residential land use 28
29 OBJECTIVES Collect storm-event derived stormwater runoff quality data from treatment (incorporating LID BMP stormwater management practices) and control (incorporating traditional stormwater management practices) watersheds of similar size and residential land use 29
30 OBJECTIVES Investigate the differences in economic benefits derived from ecosystem services between treatment (incorporating LID BMP stormwater management practices) and control (incorporating traditional stormwater management practices) watersheds of similar size and residential land use 30
31 STUDY SITE 31

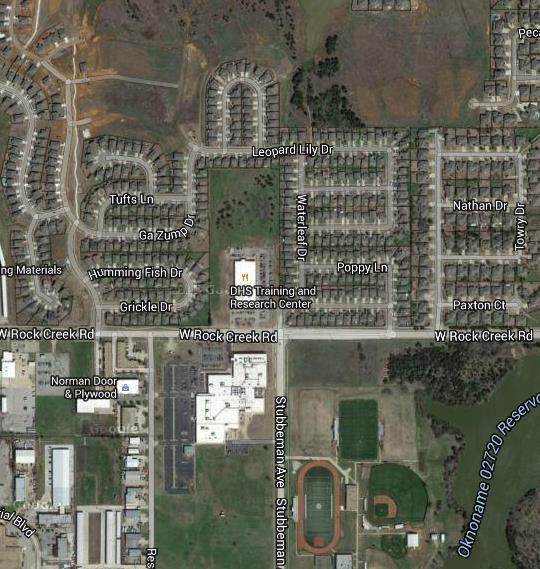
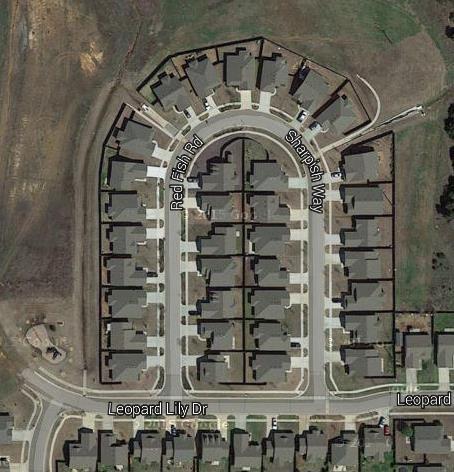
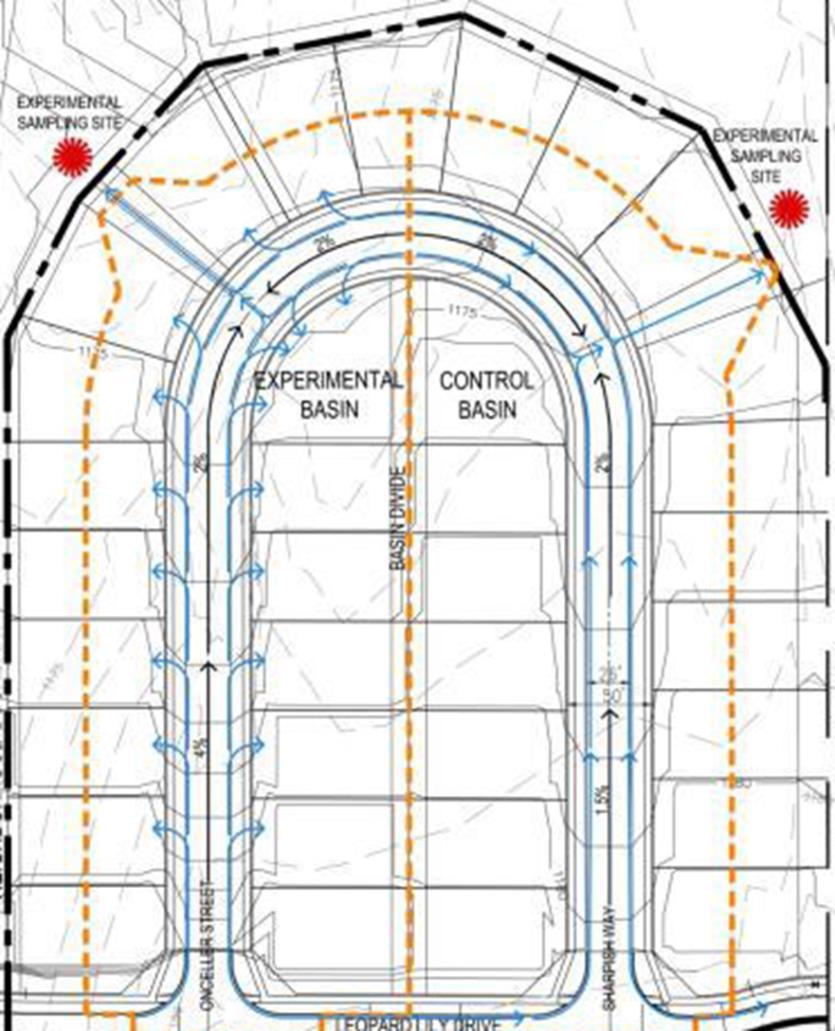
32 STUDY SITE 32

33 STUDY SITE DESIGN 51 Diversion downspouts 17 Rain barrels 18 Rain gardens 1 Strip of permeable pavement 33
34 METHODOLOGY 34
35 METHODOLOGY Paired watershed study
36 METHODOLOGY Each watershed was implemented with a trapezoidal flume Q cfs = (level ) 2.497
37 METHODOLOGY Flow weighted composite samples were collected with an ISCO 6712 Portable Sampler paired with an ISCO 730 Bubbler Module to measure flow
38 METHODOLOGY Analyzed for laboratory parameters Parameter Units Methods Total suspended solids mg/l EPA (1999) Total nitrogen mg/l HACH TNT Ammonia-nitrogen mg/l HACH TNT Nitrate-nitrogen mg/l EPA (1971) Total phosphorus mg/l EPA (1978) Total dissolved phosphorus mg/l EPA (1978) Total metals mg/l EPA 3015 (1994) and EPA 6010C (2000)
39 COMPOSITE SAMPLING REGIME 39
40 ECOSYSTEM SERVICES: PROVISIONING Assumptions Runoff percentage Roof percent drainage Precipitation events > 0.24 inches completely filled the rain barrels Precipitation events < 0.24 inches partially filled the rain barrels Residents used the captured water 40

41 ECOSYSTEM SERVICES: PROVISIONING Steps Determine quantity and size present Determine percent of roof draining into rain barrels Calculate event magnitude and frequency Determine value/gallon of potable water Calculate values of rain barrels (USD Household -1 Year -1 ) 41
42 ECOSYSTEM SERVICES: FLOOD ATTENUATION Assumptions Stormwater pond optimally sized and designed All stormwater was converted into runoff Operation and maintenance cost was 4 percent of the capital cost Design parameters: HRT and Depth 42

43 ECOSYSTEM SERVICES: FLOOD ATTENUATION Step Task 1 Total discharge rate difference 2 Design storm and subsequent design for event 3 HRT assumption 4 Depth assumption 5 Calculate pond volume 6 Input into cost equations 7 Calculate surface area required 8 Determine land costs 9 Calculate construction costs 10 Calculate operation and maintenance costs 43
44 ECOSYSTEM SERVICES: NUTRIENT RETENTION Assumptions No costs incurred besides LID BMP costs Cost data provided by Coffman (2014) Two laborers and one supervisor 37 days for installation Revenue generated was constant for study duration Only two sources of revenue exist 44

45 ECOSYSTEM SERVICES: NUTRIENT RETENTION Steps Determine discount rates Calculate the net present value Calculate the annuity rate Calculate the equivalent annual cost Calculate cost effectiveness (USD Year -1 one percent change -1 and X percent change Year -1 USD -1 ) 45
46 RESULTS AND DISCUSSION: WATER QUANTITY AND QUALITY 46
47 SUMMARIZED RESULTS Precipitation Data # of events 10 Study period 05/22-09/ Precipitation magnitude Ranges inches (mean = 1.39) Precipitation intensity ranges inches hour -1 (mean = 1.31) 2014 total precipitation inches 05/2015 total precipitation inches 2015 total precipitation inches Norman Mesonet station average inches Total Runoff Volume (CF) Peak Discharge Rate (CFS) TE (Control) TW(Treatment) TE (Control) TW (Treatment) Mean Median Maximum Minimum
48 Event Total Runoff Volume (CF) Event Peak Q (CFS) RELATIONSHIP BETWEEN PRECIPITATION AND DISCHARGE 4.50E E E E E E E E E+03 TE TE Peak Total Q vs Q vs Total Total Precip Precip TW TW Peak Total Q vs Q vs Total Total Precip Precip p = 0.01 p = <0.005 y = 11101x R² = y x R² = y = x R² = y 1.233x R² = E Total Event Precipitation (in) 48
49 TOTAL RUNOFF VOLUMES AND PEAK DISCHARGE RATES WERE DIFFERENT Total precip. = 0.66 inches Max intensity = 0.48 inches hr -1 Control Treatment % Difference Total Q (CF) Peak Q (CFS) Low intensity event 49
50 TOTAL RUNOFF VOLUMES AND PEAK DISCHARGE RATES WERE DIFFERENT Total precip. = 3.47 inches Max intensity = 2.64 inches hr -1 Control Treatment % Difference Total Q (CF) Peak Q (CFS) High intensity event 50
51 Difference Between TE and TW Total Runoff Volume (CF) TOTAL RUNOFF VOLUME DIFFERENCES TW had less total volume Storm Event TW had more total volume 51
52 Difference Between TE and TW Peak Discharge (CFS) PEAK DISCHARGE DIFFERENCES Total precip. = 3.47 inches Max intensity = 2.64 inches hr Storm Event 52
53 NUTRIENT CONCENTRATIONS WERE DIFFERENT n=10 53
54 NUTRIENT CONCENTRATIONS WERE DIFFERENT n=10 54
55 PHOSPHORUS CONCENTRATIONS WERE HIGHER n=10 55
56 Total Nitrate-Nitrogen Total Ammonia-Nitrogen TDP TSS Phosphorus Mass Mass Mass Loading Loading Mass Mass Loading Rate Loading Loading Rate Rate Rate (g Rate (g (g ha ha (g ha -1 (g -1 day ha -1 ha day day -1-1 day ) -1 day -1 ) -1-1 ) ) MASS LOADING RATES TRACKED CONCENTRATIONS TE TE TW n=10 n=7 56

57 RESULTS AND DISCUSSION: ECOSYSTEM SERVICES 57
58 VALUE WAS PROVIDED BY RAIN BARRELS $30.00 USD Household -1 Year -1 $25.00 $20.00 $15.00 $10.00 $5.00 $ up to up to up to Water Consumption (gallons) Over
59 Cost of Stormwater Pond LID BMPS PROVIDED VALUE THROUGH FLOOD ATTENUATION $60,000 $50,000 $40,000 $30,000 $20,000 $10,000 $ Percent Volume Decrease by LID BMPs 59
60 NUTRIENT RETENTION AS A MONETARY METRIC (USD YEAR -1 ONE PERCENT CHANGE -1 ) USD One Percent Change TSS TN NO3-N NH3-N TP TDP Time (Years) 60
61 NUTRIENT RETENTION AS A MONETARY METRIC (X PERCENT CHANGE YEAR -1 USD -1 ) X Percent Change USD TSS NO3-N TP TN NH3-N TDP Time (Years) 61

62 CONCLUSIONS 62
63 CONCLUSIONS LID BMPs significantly decreased peak discharge rates (p = 0.040), when comparing TE (Control) to TW (Treatment) 63
64 CONCLUSIONS Total runoff volumes showed no significant differences between the two sub-basins even though 25 percent less water passed through TW (Treatment) compared to TE (Control) 64
65 CONCLUSIONS Nitrate-nitrogen concentrations were significantly different (p = 0.01) between subbasins 65
66 CONCLUSIONS Ecosystem services provided by LID BMPs did provide the TW (Treatment) sub-basin with long term economic benefits which over time could outweigh the capital costs of construction 66
67 CONCLUSIONS In conclusion, the data collected represent a highly variable manmade system in which LID BMPs do provide beneficial water quantity and quality functions, as well as economic alternatives to traditional stormwater management 67
68 ACKNOWLEDGEMENTS I would like to thank the US Environmental Protection Agency and the Oklahoma Conservation Commission for project funding (OCC Task FY (h) Project 5 EPA Grant C ) I would like to thank Noah Berg-Mattson, Juan Arango, Kandace Steele, Dr. Julie LaBar, and Nicholas Shepherd with their help in sample management and water quality analysis I would like to thank Heather Kohl, Kathy Schweitzer, and Shana Wild for their moral support as I progressed through this project 68

69 QUESTIONS/COMMENTS 69