Components of the Groundwater Monitoring Program for Effective Resource Management
|
|
|
- Damon Nash
- 5 years ago
- Views:
Transcription

1 Components of the Groundwater Monitoring Program for Effective Resource Management Colusa County Groundwater Commission Meeting June 26, 2014 Presented by: Julie A. Reische, Geologist Presentation Prepared by: Julie A. Reische and Larry Ernst, CHG Wood Rodgers, Inc. Technical Support Provided by: Ken Loy, PG West Yost Associates
2 Outline I. Groundwater Elevations a. Current Water Level Conditions b. Groundwater Level Monitoring Network c. Goals & Objectives II. Groundwater Quality a. Current Water Quality Conditions b. Water Quality Monitoring Network c. Goals & Objectives III. Land Subsidence a. Ground Surface Elevation Monitoring Network b. Current Conditions c. Case Study: Subsidence in the Zamora area, northern Yolo County IV. Groundwater/Surface Water Interaction

")
 Source:")

3 I. GROUNDWATER ELEVATIONS Fall 2004 to Fall 2013 Shallow Aquifer (< 200 ft) Intermediate Aquifer ( ft) Source: DWR Northern Regional Office, Dec Deep Aquifer (> 600 ft)
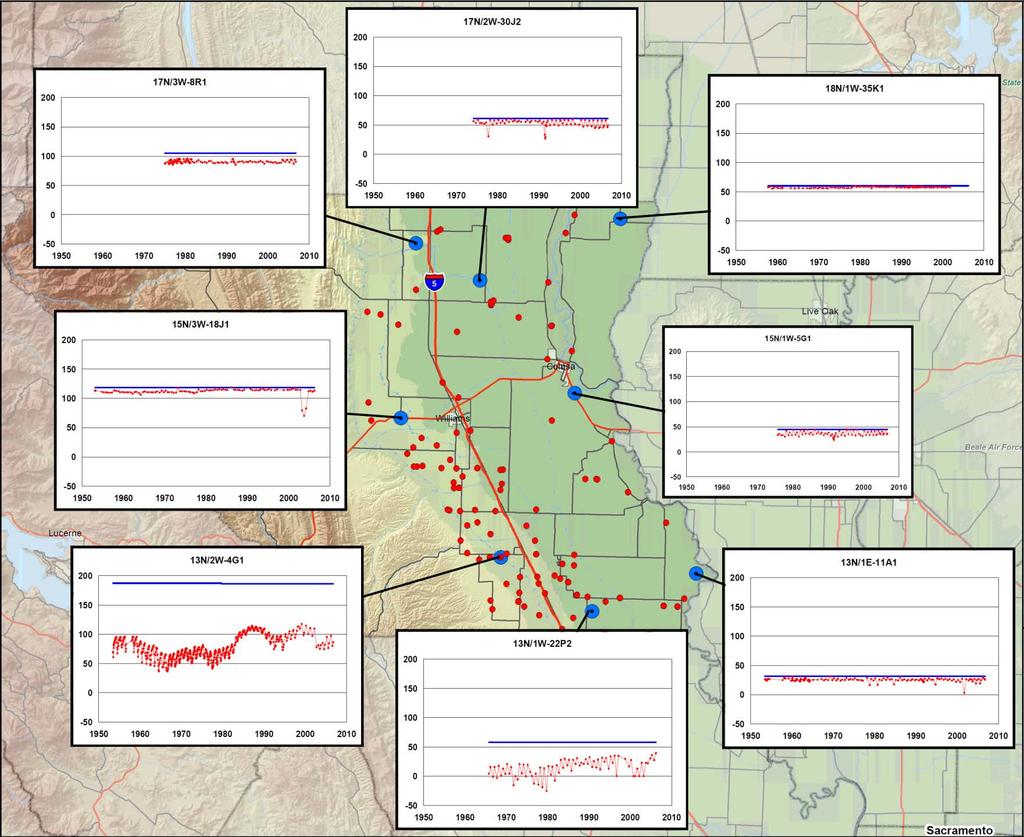

4 Groundwater Monitoring Network (2008)
5 GW Level Monitoring Program: Goals & Objectives Use current data from DWR to update hydrographs and indicate groundwater conditions (GMP data pre-2008) Verify adequacy of monitoring network Locate geographic & depth-specific data gaps Identify representative monitoring wells Use representative monitoring wells to establish baseline conditions of groundwater levels Historic and current record will help determine Basin Management Objectives (BMOs) related to groundwater levels in aquifers
6 Example of Updated Hydrograph N/2W-04G GMP

7 Locations of Candidate Monitoring Wells
8 Evaluation of Candidate Monitoring Wells 3 mi Candidate Monitoring Well Active well with construction record 3 mi T13N/R2W T14N Evaluation Process T13N - Review well records within 9 sq. miles of candidate well Evaluate number and depth of wells surrounding candidate well - Determine average depth of wells Is the candidate well representative of overall groundwater conditions in the area?
9 Example: Well Depths near Candidate Monitoring Well 100 Depths of Wells within 9 Sq. Miles Surrounding Key Well from N/02W-04 G001-G004M (Jensen Ave & TC Canal) Number of Irrigation Wells 9 80 Number of Domestic Wells Number of Other & Unknown Wells 8 70 Number of Mun & Ind Wells Frequency of Wells (%) 7 Percent of Total Wells (%) Key Well Stats Well Type: Nested MW G01 Perforations: ft; Total Depth 505 ft G02 Perforations: ft; Total Depth 853 ft G03 Perforations: ft; Total Depth 310 ft G04 Perforations: ft; Total Depth 193 ft Ground Surface Elevation: 189 ft 9 Sq. Mi. Area Stats 37 Domestic Wells, average depth 279 ft 14 Irrigation Wells; average depth 759 ft 3 Other & Unk. Wells, average depth 644 ft 8 Indus. & Muni. Wells, average depth 541 ft Number of Wells Total Well Depth (ft. below ground surface) 0
10 Other Evaluation Criteria Well construction; number of completions Completions depths and aquifers screened Period of record for groundwater levels; measurement frequency
11 Summary of GW Level Monitoring Evaluation of current monitoring network Assessment of existing representative monitoring wells and selection of new or replacement wells where necessary Will lead to an improved GW level monitoring network to establish baseline conditions for appropriate BMOs


12 II. GROUNDWATER QUALITY - EC is abbreviation for Specific Conductance, which is related to the salt content of water. - Public drinking water: - Recommended < Upper 1,600 - Short-Term 2,200 - Crop Sensitivity to EC:
13 GW Quality Monitoring Network: Goals and Objectives Update groundwater quality monitoring network, if needed (GMP 2008) Areas of poor water quality identified in GMP; does it reflect current water quality conditions? Educate to help reduce potential for groundwater contamination and water quality degradation

14 Cross-Contamination of Aquifers Potential Contamination Sources: - Improperly sealed wells - Abandoned or inactive wells - Wells perforated across multiple aquifers Metz and Brendle, 1996, USGS Water Resources Investigations Report: Potential for Water-Quality Degradation of Interconnected Aquifers in West-Central Florida
15
16 Summary of Water Quality Monitoring Overall, GW quality is generally good within the County Some localized degradation of quality exists Natural vs. anthropogenic sources of contamination: Improperly constructed wells connecting aquifers with different heads and water quality Surface contamination Erosion/oxidation of sediments within the aquifer or above recharge areas Continue WQ Monitoring Network to help establish appropriate BMOs
17 NCWA Irrigated Lands GW Study Broad coverage in Colusa County Wide range of parameters Powerful basis for assessing existing water quality conditions Scheduled to release in late June 2014 May affect evaluation of WQ Monitoring Network and development of BMOs.
18 III. LAND SUBSIDENCE Elastic vs. Inelastic Subsidence Elastic: sediments temporarily compress as a result of reduction in pore pressure and then rebound; cycles of elastic subsidence and rebound commonly occur seasonally due to groundwater pumping followed by recharge Inelastic: permanent compaction occurs when compressible sediments have pressure exerted due to declining groundwater elevations, often occurring after historic low groundwater levels have been reached

19 Extensometer Source: USGS

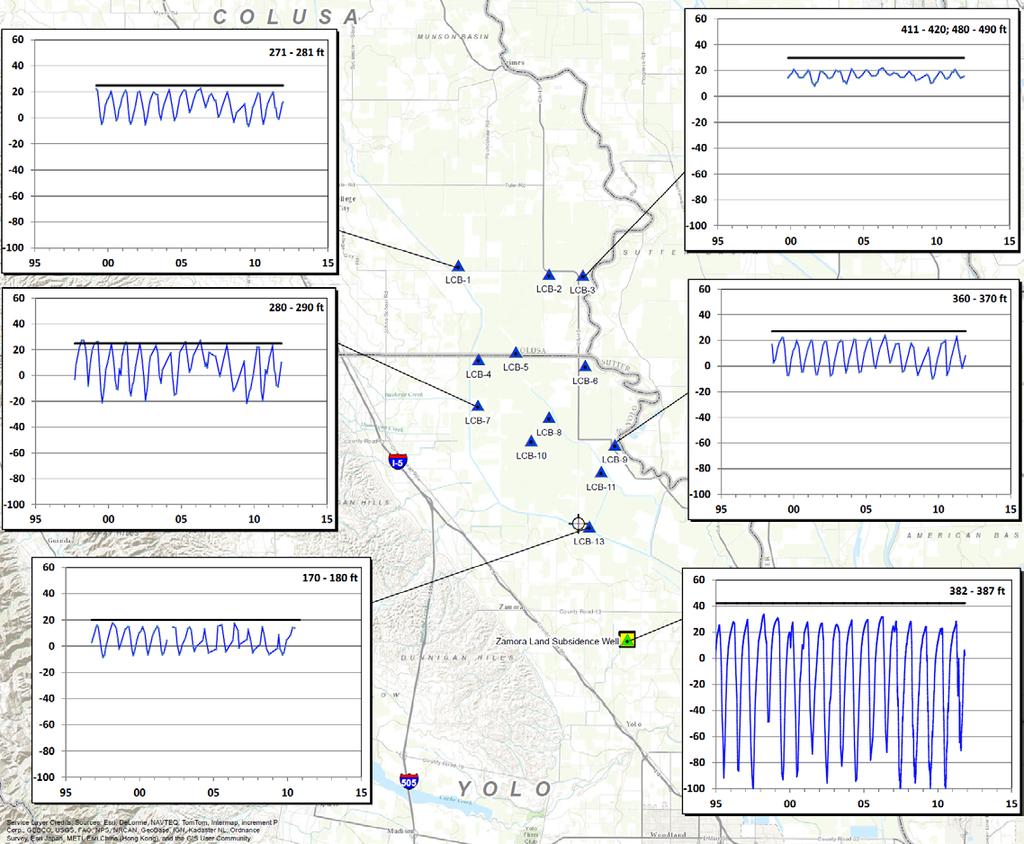
20 Land Surface Monitoring Network Extensometer: Continuous data GPS Benchmark: Surveyed 3-5 years (depending on funding)
21 Changes in Ground Surface Elevation Colusa Extensometer 16N/02W-05B1M December March 2014 Colusa County, California Total Depth: 797' below G.S. G.S. Elev: 60.22' Change in Ground Surface Elevation (feet) Change in Ground Surface Elevation (cm) Date
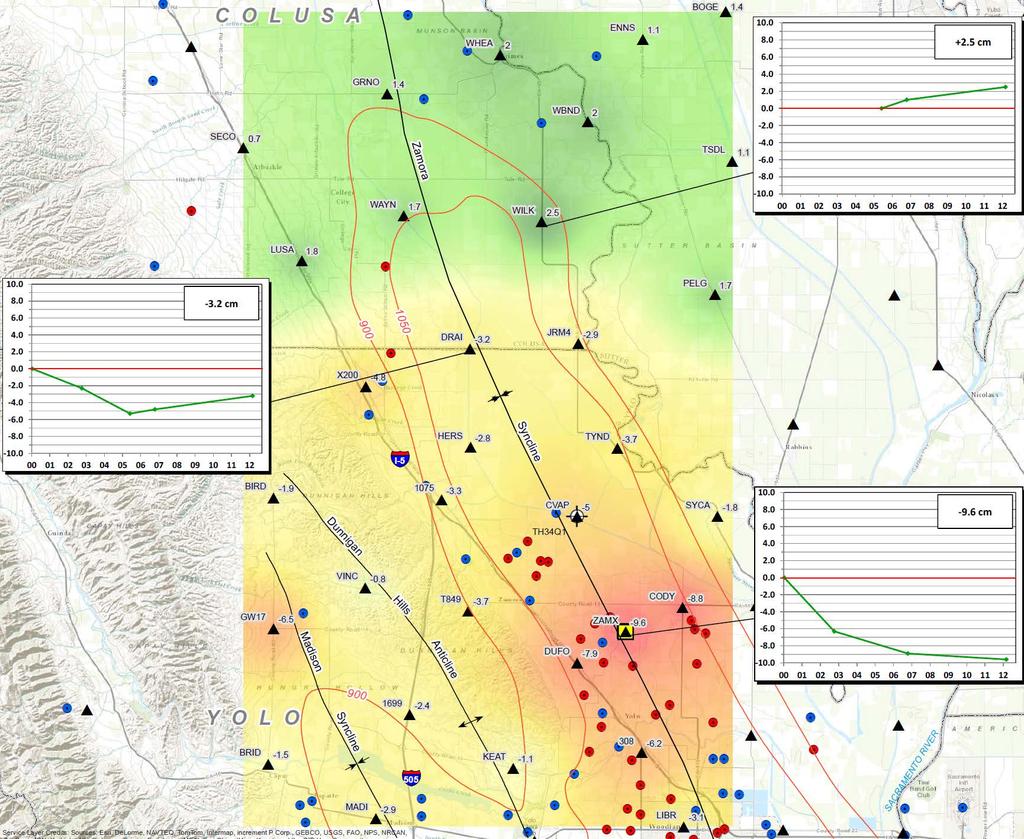
22 Subsidence Case Study: Zamora Geologic conditions in conjunction with groundwater extraction have caused inelastic subsidence in this area for the following reasons: Compressible geologic materials exist in the subsurface There is no surface water supply in this area; groundwater pumping is causing large changes in seasonal groundwater elevations
23 Changes in Ground Surface Elevation Zamora Extensometer 11N/01E-24Q8M October May 2014 Yolo County, California Total Depth: 1,000' below G.S. G.S. Elev: 42' Change in Ground Surface Elevation (feet) Change in Ground Surface Elevation (cm) Date
24
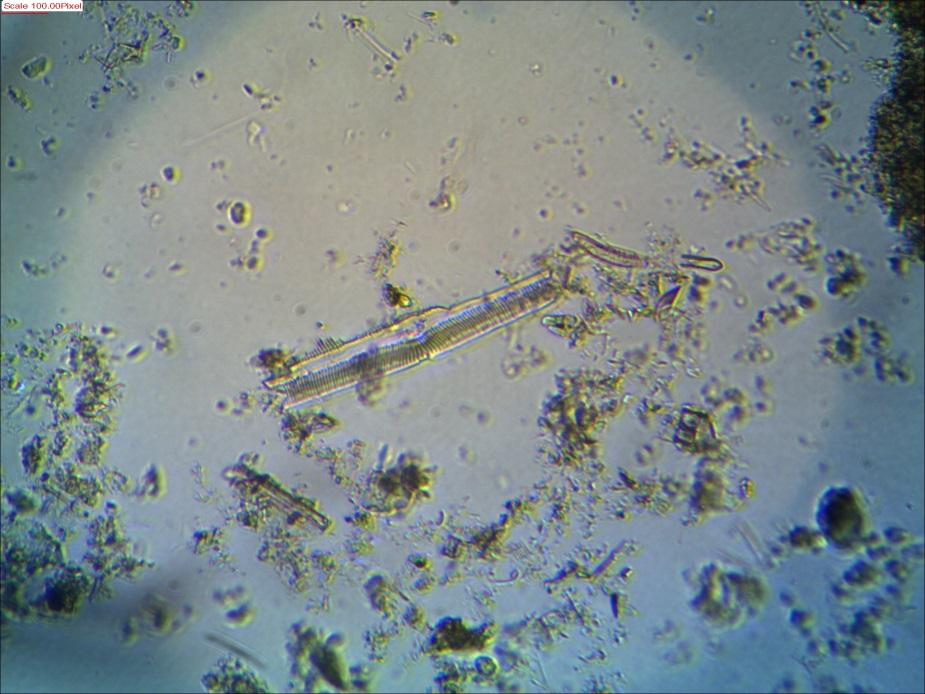
25 Diatomaceous Clay
26 Summary of Findings (Borchers and Page, USGS) Well video surveys in 1990 show well casings damaged by vertical compressive forces caused by compaction of compressible sediments that have been depressured by groundwater extraction. Almost all damage to well casings occurred within the underlying Tehama Formation.

27 Local Geology and Well Failure Structure Contour - Depth to top of Cretaceous section; elevation in meters above or below mean sea level; 1,050 m and 900 m contours selected to illustrate geometry of structures and folded sedimentary units

28 B B
29
30 Groundwater Elevations
31 Summary of Land Subsidence Geographic data gaps do exist in the land surface elevation monitoring network GPS benchmarks are needed in areas of current groundwater overdraft Funding for benchmark surveys is critical Establish BMOs that help avoid potential damage to local infrastructure
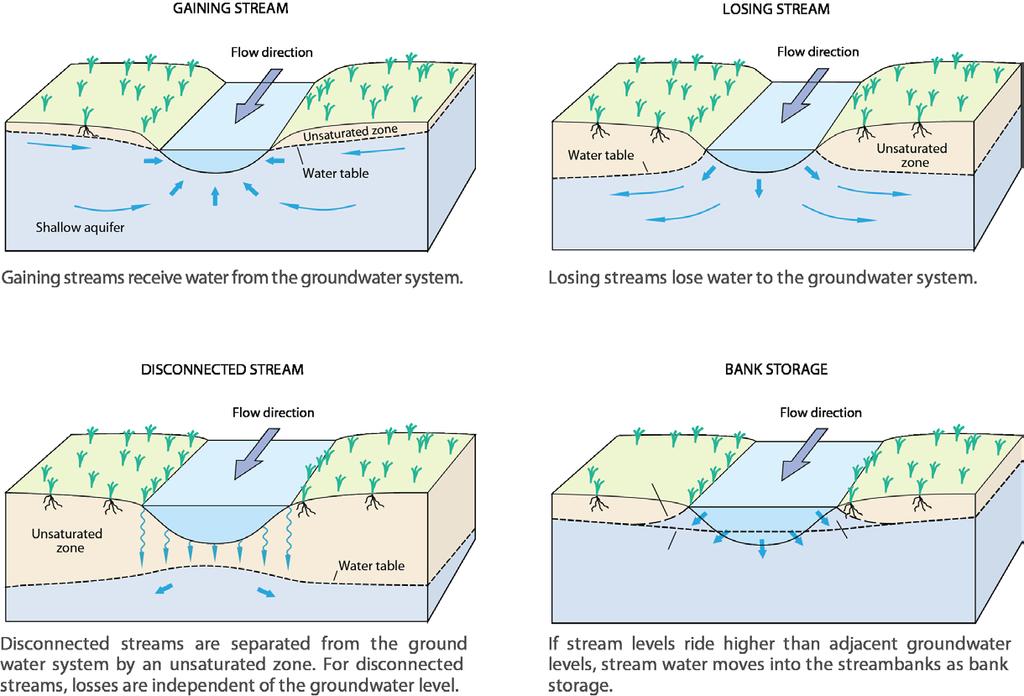
32 IV. GROUNDWATER/SURFACE WATER INTERACTION


33 Streamflow Depletion Caused by Groundwater Pumping Source: USGS, 2012, Streamflow Depletion by Wells Understanding and Managing the Effects of Groundwater Pumping on Streamflow, U.S. Geological Survey Circular 1376.
34 Summary of Pumping Effects Initially, water is removed from storage in the aquifer. Later, some groundwater that would have reached the stream is captured. If enough pumping occurs, streamflow can be reduced by seepage to the aquifer. Streamflow depletion can continue after pumping stops.

35 Current Groundwater Conditions Shallow Aquifer (< 200 ft) - Currently, there is no evidence that declines in groundwater levels have affected streamflow - Continued declines could affect streamflow in the future Source: DWR Northern Regional Office, Dec. 2013
36 Goals and Objectives Consider stream-aquifer interactions in monitoring well network design Conduct groundwater level monitoring in areas where groundwater pumping has the most potential to affect streamflow Develop and implement BMOs addressing streamaquifer interactions Maintain groundwater levels that minimize the potential for impacts on streamflow
37 Institutional Structure for GMP Implementation FIGURE IV.1 Colusa County GMP (2008)
38 Forum for Reviewing & Disseminating Groundwater Information FIGURE IV.2 Colusa County GMP (2008)
39 Conclusions TST will continue to analyze groundwater levels, quality, and land subsidence data and provide updates on current conditions of groundwater resources Establish BMOs that are appropriate for successful management of the County s groundwater resources Cooperation from all stakeholders is important to maintain sustainable groundwater resources and keep local control of groundwater use