Using Citizen Monitoring and Crowdsourcing to Track and Forecast Near-shore Lake Conditions
|
|
|
- Rachel Stone
- 5 years ago
- Views:
Transcription


1 Using Citizen Monitoring and Crowdsourcing to Track and Forecast Near-shore Lake Conditions Paul Dearlove- Watershed Program Manager Katie Van Gheem- Watershed Coordinator


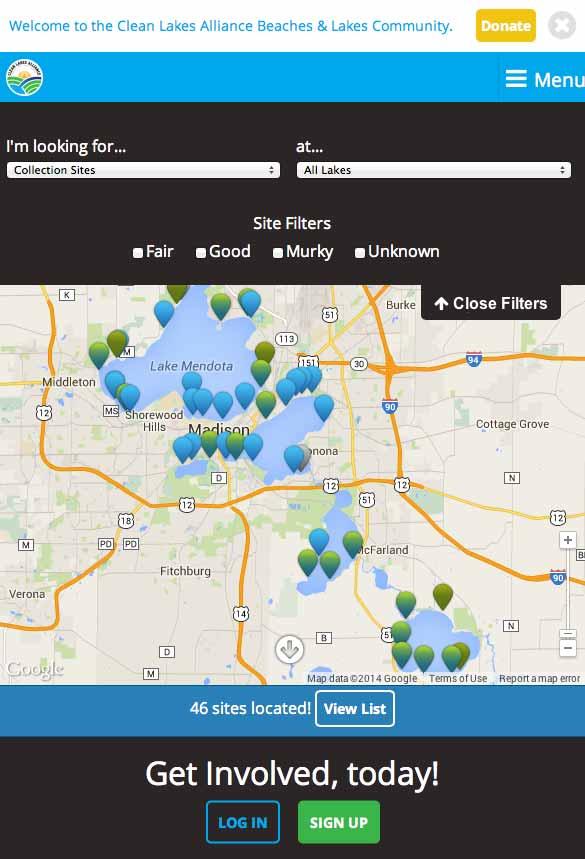
2 Reporting and Awareness

3 Reporting and Awareness


4 Reporting and Awareness


5 Reporting and Awareness
6 Vision We see a future in which everyone realizes that our lakes are the center of our community. Healthy Lakes. Healthy Community.


7 359 mi 2 watershed 28 municipalities 370,000 people 29 mi 2 of lake area 58 miles of shoreline 22 public beaches >3,200 lakefront property owners


8 Passive Citizen Volunteer Monitor Informed/ Engaged Advocate

")
9 Lake User Risks E. coli Bacteria Blue-green Algae (Cyanobacteria)


10 Perceptions vs. Reality Water quality is the BEST it s ever been! Water quality is the WORST it s ever been!


11 Perceptions vs. Reality


12 Filling Monitoring Gaps


13 Filling Monitoring Gaps

14 Beaches


15 Beaches


16 Beaches Purpose Increase confidence in beach safety through E. coli bacteria monitoring Parameters Daily (M F) E. coli concentration Water and air temperature Turbidity Visual observations Monthly Total phosphorus
17 10 9 Precipitation in 48 hours preceeding sampling (In) James Madison Beach 2014 E. coli Data 48 hr precip E. coli (MPN/100 ml) E. coli Beach Closure Date (m/dd/yy) E. coli Concentration (MPN/100 ml)


18 End-of-Pier
19 End-of-Pier Purpose Collect data that may be useful in modeling and forecasting bluegreen algal blooms Parameters Weekly Water and air temperature Turbidity Visual observations Monthly Total phosphorus


20 Source: Wisconsin Department of Health Services A. Green B. Blue-Green


21 Source: New York Department of Environmental Conservation A. Green B. Blue-Green


22 Source: New York Department of Environmental Conservation A. Green B. Blue-Green


23 Source: Sam Oliver A. Green B. Blue-Green


24 Visual Observations
 120 5/21/14 6/10/14 6/30/14")

25 MendotaPier15 Results Temperature (ᵒF) MendotaPier15 Water Temperature 0 Increasing murkiness Turbidity (cm) MendotaPier15 Water Turbidity 50 5/21/14 6/10/14 6/30/14 7/20/14 8/9/14 8/29/14 9/18/14 10/8/14 Date (m/dd/yy) 120 5/21/14 6/10/14 6/30/14 7/20/14 8/9/14 8/29/14 9/18/14 10/8/14 Date (m/dd/yy) Data Summary MendotaPier15 Lake Mendota Number of Observations % of Observations When Algae Present 6.3% 13% Average Water Turbidity 83.9 cm 87 cm Average Water Temperature 70.8 F 73.5 F Average Total Phosphorus mg/l mg/l
 40 60 80 100 50 6/7/14 6/14/14 6/21/14 6/28/14 7/5/14 7/12/14 7/19/14 Date (m/dd/yy) 120 6/7/14 6/14/14 6/21/14")
 85 cm Average Water Temperature 76.3 F 71.2 F Average Total Phosphorus 0.046 mg/l 0.")
26 MononaPier6 Results 85 MononaPier6 Water Temperature 0 MononaPier6 Water Turbidity Temperature ( F) Increasing murkiness Turbidity (cm) /7/14 6/14/14 6/21/14 6/28/14 7/5/14 7/12/14 7/19/14 Date (m/dd/yy) 120 6/7/14 6/14/14 6/21/14 6/28/14 7/5/14 7/12/14 7/19/14 Date (m/dd/yy) Data Summary MononaPier6 Lake Monona Number of Observations % of Observations Algae Present 25% 24% Average Water Turbidity 103 (cm) 85 cm Average Water Temperature 76.3 F 71.2 F Average Total Phosphorus mg/l mg/l

27 Crowdsourcing Purpose Increase public s understanding of local water quality issues Increase public lake involvement Strengthen dataset Source: Wisconsin Union

28 Thank You! We would like to specially thank Jon Standridge and Dr. Richard Lathrop Monitors Alan Ausel Allen & Claire Arntsen Amy Wencel Bill Lamm Carla Schubert Carol Gillen Caroline Hoffman Carolyn Betz Cathie Taylor Craig Ostrom David Schroder Dea Larsen Converse Deanna Letts Debbie & Eli Durcan Dick Pearson Eric Christenson Harmon & Nell Ray Jacob Stampen Jacqui Guthrie Jeff Schraml Jerry Jendrisak Jim Cordray Jim Wilcox John Reinders John Tye Josie & Peter Cyffka Juliette Schick Karen Faller Kirk & Betsy Swenson Leigh & Maddie Meier Mel McCartney Mike Horn Nick Hayden Rhonda Arries Robert Gilbert Roy Carter Sarah Balz Sasha Kerlow Silke Schmidt & Dan Phaneuf Tom Smith Theresa Vander Woude Woody Kneppreth Contributors Aaron Larson Barb Tiedje Barb Woehrl Brian Parks Chin Wu Craig Barabas David Webb Doug Voegeli Emily Stanley Eric Janquart Heather Becker Jake Vander Zanden Jennifer Lavender Braun Joe Sweeney John Reimer Jordan Barrette Josh Herritz Kathleen Dax-Klister Ken Potter Kerry Martin Kirsti Sorsa Lisa Mertins Molli MacDonald Pat Gorski Shawn Marsh Steve Carpenter Partners City of Madison City of Monona Dane County MIOsoft Public Health Madison & Dane County Thermo Fisher Scientific UW-Madison Center for Limnology Wisconsin Department of Natural Resources Wisconsin State Laboratory of Hygiene 100state This program wouldn t be possible without the help of our interns: Eric Krejcarek Justin Chenevert Paul Webb
29 Algal Blooms Reported By Lake in 2014 (May 27 September 30) Total # Algal Blooms Reported Mendota = 20 sites Monona= 11 sites Waubesa= 5 sites Kegonsa= 7 sites Wingra= 3 sites /16/14 6/5/14 6/25/14 7/15/14 8/4/14 8/24/14 9/13/14 10/3/14 Date (m/dd/yy)
 Percentages 0.0 12.0 13.0 20.0 22.0 29.0 30.0 47.0 50.0 80.0")
30 % Algal Bloom Presence Results for Summer 2014 (May 27 September 30) Percentages

31 Water Clarity (cm) R² = Total Phosphorus (mg/l)
32 Future Plans Increase number of end-of-pier and beach monitors Use data for research Modeling Reporting and awareness Incorporate crowdsourcing