Cape Town Water Outlook Updated 17 April 2018 Department of Water and Sanitation City of Cape Town
|
|
|
- Melina Holland
- 5 years ago
- Views:
Transcription


1 Cape Town Water Outlook 2018 Updated 17 April 2018 Department of Water and Sanitation City of Cape Town
2
3 Uncertainty and mystery are energies of life. Don't let them scare you unduly, for they keep boredom at bay and spark creativity. R. I. Fitzhenry Maturity of mind is the capacity to endure uncertainty. John Finley Uncertainty is the only certainty there is, and knowing how to live with insecurity is the only security. John Allen Paulos Education is the path from cocky ignorance to miserable uncertainty Mark Twain For my part I know nothing with any certainty, but the sight of the stars makes me dream Vincent van Gogh
4 J AN - 18 F E B - 18 M AR - 18 AP R - 18 M AY - 18 J U N - 18 J U L - 18 AU G - 18 S E P - 18 O C T - 18 N O V - 18 DEC- 18 J AN - 19 F E B - 19 M AR - 19 AP R - 19 M AY - 19 J U N - 19 J U L - 19 AU G - 19 S E P - 19 O C T - 19 N O V % Uncertainty 35.0% 30.0% We are here 25.0% 20.0% 15.0% 10.0% 5.0% 0.0% 13.50% Restricted, 100% MLD, 100% 2017 Restricted, No Augmentation
5
6 J AN - 18 F E B - 18 M AR - 18 AP R - 18 M AY - 18 J U N - 18 J U L - 18 AU G - 18 S E P - 18 O C T - 18 N O V - 18 DEC- 18 J AN - 19 F E B - 19 M AR - 19 AP R - 19 M AY - 19 J U N - 19 J U L - 19 AU G - 19 S E P - 19 O C T - 19 N O V % Or this! 35.0% 30.0% 25.0% We are here 20.0% 15.0% 10.0% 5.0% 0.0% 13.50% Restricted, 100% MLD, 100% 2017 Restricted, No Augmentation Restricted, 75% rain Restricted, 50% rainfall
7 MANAGEMENT OF THE DROUGHT DEMAND MANAGEMENT Restriction Level 6B Communications System integrity Pressure reduction Household flow regulators Punitive Tariffs Adaptation Information driving behavior change DAM MANAGEMENT Dam systems Rainfall DWS steercom Agricultural Releases Dam levels Modeling NEW WATER Groundwater Re-use Desalination Considerations Cost Timing Sustainability


8 Cape Town s water is part of an integrated system Cape Town gets its water from a system of dams that supply agriculture and other urban areas. The current system is heavily dependent on rainfall. This complex system is managed by the national Department of Water and Sanitation. About a third of the water in this system is used by agriculture and 7% by other urban areas (smaller towns).

9 Why is there a shortage of water in Cape Town? Cape Town is experiencing an unprecedented multi-year drought event. The National Department of Water and Sanitation is responsible for planning and implementing water resources schemes to meet water demand for cities, industries, mining and agriculture. The Department plans at a 1 in 50 year level of assurance. This means that during droughts with a severity of 1:50 years or more, restrictions need to be imposed to reduce demand The current drought is much more severe than a 1 in 50 drought event. The best estimate of the return interval of the meteorological drought in the region of WCWSS dams is 311 years, with 90% confidence that it actually falls between 105 and 1280 years 1. The next augmentation scheme for Cape Town was planned for 2022/3 and is being accelerated by the national Department. This scheme (augmentation of Voelvlei Dam) is unlikely to be ready before 2021.


10 Will it rain again? Yes. Historical (grey) and predicted (pink) annual rainfall for Cape Town, according to 16 global climate models. Yellow dots below indicate rainfall incidents equal to or lower than 2017 rainfall. Rainfall in the Cape Town area is variable. Wetter and drier years are common. 16 global climate models predict an overall decline in rainfall for Cape Town in the future with more dry years and fewer wetter years. A scenario in which it does not rain the future or in which it only rains at 2017 levels is unrealistic. Sources: 1 Facts are few, opinions plenty on drought severity again (January 2018) Is Cape Town s drought the new normal? (1 November 2017) Why Cape Town s drought was so hard to predict (19 October 2017)

11 VARIABLE RAINFALL!
12
13 MANAGEMENT OF THE DROUGHT DEMAND MANAGEMENT Restriction Level 6B Communications System integrity Pressure reduction Household flow regulators Punitive Tariffs Adaptation Information driving behavior change DAM MANAGEMENT Dam systems Rainfall DWS steercom Agricultural Releases Dam levels Modeling NEW WATER Groundwater Re-use Desalination Considerations Cost Timing Sustainability
14 Daily consumption MLD Nov-17 Dec-17 Jan-18 Feb-18 Mar-18 Apr-18 May-18 Jun-18 Jul-18 Aug-18 Sep-18 Oct-18 Daily consumption MLD Nov-17 Dec-17 Jan-18 Feb-18 Mar-18 Apr-18 May-18 Jun-18 Jul-18 Aug-18 Sep-18 Oct-18 Demand management through DWS restrictions Evaporation - Maximum Urban (DWS average of last 5 years) Agriculture unrestricted RESTRICT TO Evaporation - Maximum 45% restricted Urban Agriculture 60% restricted
15 Demand management: Both the City, other urban and agriculture must adhere to the restrictions imposed on the system Current savings: 40% (Target 45%) Prelim scenario (mid-march 2018) Anticipated savings >45%
, from a peak of 1200 Ml/day in 2015 down to nearly 500 Ml/day, a further reduction in demand is needed to below 450 Ml/day")

16 For Cape Town, this means that demand must be managed down to get below 450 Ml/day While Cape Town has significantly reduced its demand (measured here as production from the treatment works), from a peak of 1200 Ml/day in 2015 down to nearly 500 Ml/day, a further reduction in demand is needed to below 450 Ml/day immediately due to not meeting the 500 Ml/day target since July 2017 Demand reduction is saving 400 Ml/day Feb 2017 = 900 Ml/day Feb 2018 = 500 Ml/day Further measures are being put in place to reduce demand, including: punitive drought tariffs demand management devices & flow restrictors more aggressive pressure management
17 Demand management: Cape Town has done really well, but we have to reduce to 450MLD Water into network Litres per person per day (based on population in service area) Buffalo City Nelson Mandela Bay Mangaung Ekurhuleni Metro City Of Johannesburg City Of Tshwane ethekwini Cape Town 100 (All metros) 50 - (based on litres per person per day, population in service area)
18 Jan 2018 AUGMENTATION PROPOSED TO FUND FROM CITY SAVINGS, RATES & LOANS Section 29 report, 7 projects + Adaptation to reduce demand + Water Transfers + programme management Funding sources identified Only Augmentation projects funded outside of W&S tariff (through section 29 report) other future projects funded by tariff FUNDING ONLY FOR THESE PROJECTS REVENUE LOSS BEHAVIOUR CHANGE PROPOSED TO FUND FROM DROUGHT CHARGE Annual revenue loss is approximately R1.6bn for current year R1.6bn was the income we got from selling water to domestic households over 20kl/month We re selling about half the water but costs are mainly fixed and reduce only marginally so price has to increase to balance (else cut service) NO ADDITIONAL REVENUE PUNITIVE TARIFF PROPOSED TO BE REVENUE NEUTRAL Restriction tariff speaks to price elasticity needs to be far more expensive to change use Level 5 restriction implemented 3 September without restriction tariff Current process proposes Level 5, 6 and 7 Designed to be revenue neutral, i.e to change behaviour and not get more income. We want people to use (and as a result, buy) less SO NO ADDITIONAL REVENUE
19 Towards a more Resilient tariff structure SEWER WATER Fixed charge covers the costs of the reticulation business / cost of supply Based on Connection Size / Demand on the System (95% either 15 or 20mm) Rebates to protect poor households Consumption charges for domestic users: Basic usage for poor households is subsidised Basic usage for non-poor households is at average historical cost Other usage is at the average incremental cost of supply expansion (e.g. new bulk water costs / expansion to WWTW) Reduce to 4 step tariff structure Single flat rate consumption charge at average incremental cost (for other non-domestic users) Sewer Connection Sizes does not provide appropriate ratios Current complaints include linkage to water / sewer percentage / Not Resilient Value Based Charges for Sewerage Reduce indigent exposure Positive impact on Sewerage Collection Ratio

20 Demand management: Punitive tariff structure Punitive tariffs discourage high water usage & support a sustainable water service The drought affects the city s finances in two primary ways: 1. Reduced sales means that city income is reduced because tariffs are volume based. 2. Additional expenditure is required to increase availability of water. New sources of water are more costly than the water obtained from the existing dams. This increases both capital and operating costs. Existing Restriction Water Tariffs 2017/18 (ex VAT) Level 1 Level 2 Level 3 Level 4 Level 5 Level 6 Step 1 [0-6kl] Step 2 [6-10.5kl] Step 3 [ kl] Step 4 [20-35kl] Step 5 [35-50kl] Step 6 [+50kl] Commercial Moving towards a resilient tariff means we need to: 1. Recover full costs including cost of water resilience program and adequate depreciation. It is a legal requirement to balance budget 2. Retain affordability for indigent and less affluent households and improve payment levels 3. Increase resilience of tariff to shocks (greater revenue stability in face of drought conditions) 4. Tariff reflects value of water and supports sustainability See Annexure B of Water Outlook for details on 2018/19 Tariff increase
21 2018/19 TARIFF DRIVERS: Changes in volume of water sales Structure of demand Reduced volumes Domestic Non-domestic Inclining tariff steps Domestic water sales (million kl) Dom - Full Dom - Cluster Informal Settlements Domestic total Permanent behaviour change Subsidisation Jul-15 Aug-15 Sep-15 Oct-15 Nov-15 Dec-15 Jan-16 Feb-16 Mar-16 Apr-16 May-16 Jun-16 Jul-16 Aug-16 Sep-16 Oct-16 Nov-16 Dec-16 Jan-17 Feb-17 Mar-17 Apr-17 May-17 Jun-17 Jul-17 Aug-17 Sep-17 Oct-17 Nov-17 Dec-17 Jan-18 Feb-18
22 MANAGEMENT OF THE DROUGHT DEMAND MANAGEMENT Restriction Level 6B Communications System integrity Pressure reduction Household flow regulators Punitive Tariffs Adaptation Information driving behavior change DAM MANAGEMENT Dam systems Rainfall DWS steercom Agricultural Releases Dam levels Modeling NEW WATER Groundwater Re-use Desalination Considerations Cost Timing Sustainability

23 Hydrological year Start 1 Nov 20 year Dam levels 97% 84.1% % 60.3% 55.4% % % 31.0% % lower than 2017

24 What happened to Day Zero? 22 January Projection of 13.5% dam level = 12 April 2018, Weekly drawdown = 1.4%, Agriculture : CCT, 48% : 47% 7 May Projection of 13.5% dam level beyond July 2018, Weekly drawdown = - 0.1%, Agriculture : CCT, 1% : 89% The level of water in the dams supplying Cape Town will not drop below 13.5% this year if restrictions are adhered to and assuming rainfall similar to last year. Monitoring dam levels (inflow, evaporation and withdrawals) and managing withdrawals is key to maintaining the integrity of the system and getting through the drought. Day Zero calculation is based on conservative assumptions of consumption beyond the City s control, including releases to agriculture, urban demand, evaporation and rainfall. The projected Day Zero date is based on the previous weeks average volume extracted from the system, extrapolated into the future to the intersection point of 13.5% dam level without adjusting for potential rainfall, reduction in demand etc. Unlike previous years, DWS stopped releases to irrigation boards once allocations were reached late in January onwards thus dramatically reducing drawdown from the system. Furthermore, a sizeable transfer was made by an adjacent catchment area in February, also reducing the drop in dam level. These two aspects, as well as a reduction in urban demand led to the Day Zero date moving well beyond the anticipated start of the rainy season in 2018.
25 MANAGEMENT OF THE DROUGHT DEMAND MANAGEMENT Restriction Level 6B Communications System integrity Pressure reduction Household flow regulators Punitive Tariffs Adaptation Information driving behavior change DAM MANAGEMENT Dam systems Rainfall DWS steercom Agricultural Releases Dam levels Modeling NEW WATER Groundwater Re-use Desalination Considerations Cost Timing Sustainability
26 2018 Planned augmentation 2019 Planned augmentation 500MLD 2015 runoff 2016 runoff 2017 runoff Average runoff Wet winter runoff Augmentation - considerations Equivalent annual inflow (millions of m3) Augmentation schemes are a far more expensive source of water than runoff from rainfall. The volume of runoff cannot be easily augmented in short time periods and is dependent on rainfall patterns. Under poor rainfall conditions like 2017 we would require augmentation of ~770 MLD to match the volume of runoff. Despite all augmentation efforts, the supply scheme is vulnerable to poor rainfall. treated surface water- historical groundwater extraction - sandy aquifer permanent re-use permanent desalination groundwater extraction - TMG temporary water re-use temporary desalination Estimated cost ranges for treated water by source (R/kl) R 0 R 10 R 20 R 30 R 40 R 50 As can be seen the cost per kl of water from other sources vary considerably. The cost of bulk water, waste water and reticulation is common so the costs can be compared to the cost of runoff which is ~R5.20/kl vs temporary desalination at >R40/kl.
 2. 16 small plants (desal and reuse) logistically complex & poor economy of scale 3. Ships and barges hugely expensive (200 MLD) 4.")
27 What has the city learnt about augmentation? Slower and harder Project list (Oct 2017) and post review (Dec 2017) Sources: City of Cape Town Original program features: 1. Temporary desalination prioritised (104 MLD) small plants (desal and reuse) logistically complex & poor economy of scale 3. Ships and barges hugely expensive (200 MLD) 4. Groundwater (90 MLD) not part of immediate response 5. Focussed only on the city (not the wider system) Key review messages: 1. Manage demand and dam draw-down 2. Prioritise ground water 3. Don t pursue temporary desalination and reuse 4. Don t use ship or barge-based marine desalination plants 5. Procure permanent re-use and desal at
28 Augmentation - Advice from International Review (November 2017) 1. Assuming it will not rain again is not realistic 2. Prioritise ground water (Cape Flats Aquifer and Table Mountain Group Aquifer) 3. Do not pursue temporary desalination and reuse 4. Permanent Re-use is cheaper than desalination and may be quicker to execute 5. Plan and execute permanent desalination at an optimum scale 6. A turnkey approach for desalination with a water purchase agreement will yield the lowest cost per unit of water 7. Do not delay decisions on permanent reuse and desalination.
29 Yield, cost, timing inform priorities Indicative target time-frames to implement Target Unit Costs and uncertainty (Rand per thousand liters) Yield (million liters per day) Ground (100) Reuse (70) Desalination (120) Surface (60) % +33% +25% Desalination +20% Re-use Ground +120 Surface Time to implement (months from a firm commitment to proceed) Additional supply - Million liters per day (MLD) Surface water is least costly, but not resilient to drought; Groundwater is more drought resilient, and quick to provide additional water into the system; Permanent Desalination is very costly and cannot be implemented quickly BUT it is the only unlimited new source of water into the system not reliant on rainfall; Re-used water is less costly than desalination, and is necessary to maximize value from the diversified supply mix which is considerably more expensive than single source surface water.
30 Nov-17 Dec-17 Jan-18 Feb-18 Mar-18 Apr-18 May-18 Jun-18 Jul-18 Aug-18 Sep-18 Oct-18 Nov-18 Dec-18 Jan-19 Feb-19 Mar-19 Apr-19 May-19 Jun-19 Jul-19 Aug-19 Sep-19 Oct-19 70% New water supplies are important for water security going forward but these will have little impact before winter (Rainfall similar to 2017) 60% Impact of Rainfall Impact of Rainfall 50% Urban restriction very important 40% 30% 20% 10% New supplies have a small impact this summer. But are very important for 2019 if winter rainfall is low 0% Demand: 450Ml/day; 100% 2017 Rainfall; 100% Build Yield Demand: 450Ml/day; 100% 2017 Rainfall; 0% Build Yield Demand: 450Ml/day; 150% 2017 Rainfall; 100% Build Yield Demand: 600Ml/day; 100% 2017 Rainfall; 100% Build Yield Demand: 450Ml/day; 75% 2017 Rainfall; 100% Build Yield Actual Storage
31 Apr-18 May-18 Jun-18 Jul-18 Aug-18 Sep-18 Oct-18 Nov-18 Dec-18 Jan-19 Feb-19 Mar-19 Apr-19 May-19 Jun-19 Jul-19 Aug-19 Sep-19 Oct-19 Nov-19 Dec-19 Jan-20 Feb-20 Mar-20 Apr-20 May-20 Jun-20 Jul-20 Aug-20 Sep-20 Oct-20 Nov-20 Dec-20 Jan-21 Feb-21 Mar-21 Apr-21 May-21 Jun-21 Jul-21 Aug-21 Sep-21 Oct-21 Nov-21 Dec-21 Jan-22 Feb-22 Mar-22 Apr-22 May-22 Jun-22 The New Water Program 4 year view Provisional system augmentation programme (MLD) Springs & rivers Emergency desalination Permanent desalination Water transfers Temporary re-use Permanent re-use Groundwater existing Additional groundwater (conservative) Groundwater over & above (best case) Existing includes transfers, springs & rivers, existing groundwater (Atlantis), temporary desalination and temporary re-use; Conservative planned includes Existing plus conservative yields on CFA and TMG at constant yield Optimistic planned includes Existing plus more optimistic yields on CFA and TMG assuming rapid resolution of environmental and other issues, and providing for over extraction within license conditions. See Annexure A of Water Outlook for details of change in augmentation program
32 MLD Evolution of augmentation programme (Jan 2018) Permanent desalination Emergency desalination Water Reclamation Ground Water Abstraction (TMG) Ground Water Abstraction (sandy) Springs Temporary transfers 0
33 Jan-18 Feb-18 Mar-18 Apr-18 May-18 Jun-18 Jul-18 Aug-18 Sep-18 Oct-18 Nov-18 Dec-18 Jan-19 Feb-19 Mar-19 Apr-19 May-19 Jun-19 Jul-19 Aug-19 Sep-19 Oct-19 Nov-19 Dec-19 Jan-20 Feb-20 Mar-20 Apr-20 May-20 Jun-20 Jul-20 Aug-20 Sep-20 Oct-20 Nov-20 Dec-20 Jan-21 Feb-21 Mar-21 Apr-21 May-21 Jun-21 Jul-21 Aug-21 Sep-21 Oct-21 Nov-21 Dec-21 Jan-22 Feb-22 Mar-22 Apr-22 May-22 Jun-22 MLD Evolution of augmentation programme (Feb 2018) PROVISIONAL AUGMENTATION PLAN Water transfers Ground Water Abstraction (TMG) Ground Water Abstraction (sandy) Permanent desalination Direct re-use Springs & rivers
 Rest Water Diameter Level (mm) (mbgl) Recomm.")
34 Cape Flats Aquifer Drilling Progress Cluster Strandfontein West Strandfontein centre Strandfontein East Philippi Bishop Lavis Khayelitsha Hanover Park Bh No. Depth (mbgl) Rest Water Diameter Level (mm) (mbgl) Recomm. Drawdown (mbgl) Sustainable yield (l/s) Sustainable yield (m3/d) EM , ,2 622 P ,19 21,2 7,8 677 P ,41 20,4 7,7 663 P ,04 23, EM ,82 21,8 0,4 34 EM ,6 29,6 5,6 482 P ,1 26,1 61, P ,31 25,3 27, P ,79 24,8 39, P ,45 20,5 42, P ,48 20,5 14, P ,73 22,7 35, EM ,35 26,4 11, EM ,2 277 P ,74 25,7 3,7 320 P-23 44, ,44 33,4 1,8 156 P ,86 20,9 1, EM ,87 17,9 2,1 183 EM ,0 2,1 183 EM ,27 18,3 4,2 365 EM ,04 21,0 6,0 516 EM ,43 21, EM ,4 26 5,3 458 EM ,79 19,8 5,7 492 EM ,8 19,8 1,5 130 Swartklip EM ,3 32,3 6,8 590

35 Atlantis Aquifer Atlantis currently being supplied solely from groundwater source Further refurbishment of well field and treatment infrastructure in progress Targeting an additional 20 Ml/day abstraction to be distributed to areas south of Atlantis


36 TMGA: Theoretical Yields Note: The drilling plans are currently under review to address emerging environmental concerns
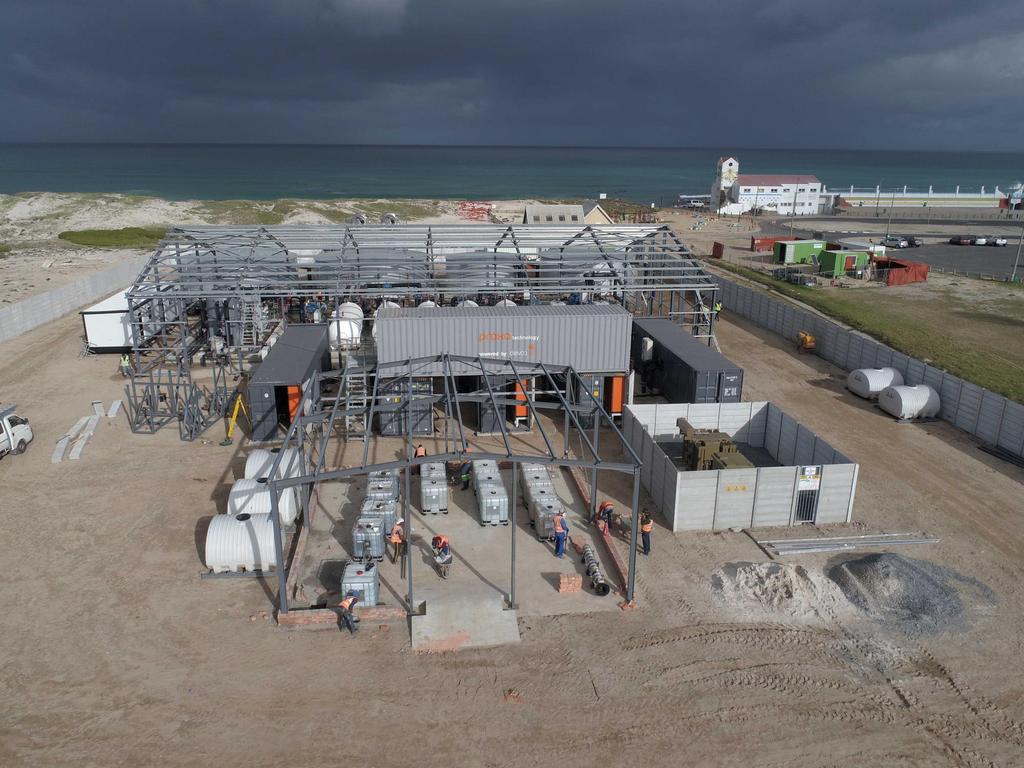
37 Temporary Desalination
38 Summary 1. Continue demand management to reduce dam drawdown (in line with NDWS restriction 450MLD required); 2. Manage and monitor dam behaviour; 3. Fast-track augmentation: Decisions under consideration by the City on optimal augmentation types, volumes, methods; Groundwater projects (Atlantis, Cape Flats and TMG Aquifers) have been prioritised; Aquifer recharge projects from treated wastewater under development; Long-term Permanent Re-use project under development; Long-term Permanent Desalination under evaluation in terms of siting, optimum yield & procurement method; 4. Manage financial impacts through appropriate adjustments to the tariff structure and level. There is a high degree of uncertainty related to future tariff revenues as a result of significant shifts in demand patterns and a steeply inclining block tariff; 5. Improve coordination and leadership within and between spheres of government; 6. Improve information flows and consistency of messaging; actively engage citizens and stakeholders to encourage active citizenry and stakeholder partnerships to jointly solve problems.
39 thanks