Intelligent System Design
|
|
|
- Luke Morrison
- 5 years ago
- Views:
Transcription


1 Intelligent System Design Justin Wieman Chiller Systems Engineer Trane, A Division of Ingersoll-Rand Member AHRI Systems Committes ASHRAE Member since 2000


2 When you buy a HVAC System would you rather buy: Individual HVAC Components An Entire HVAC System air handlers ductwork piping controls chillers Similar components, maybe, likely Vastly different results!
3 Building System Solutions with and for customers Design HVAC systems to optimize the building s performance for life. Intelligent Systems First Cost Operating Cost Carbon Footprint Comfort Indoor Air Quality Acoustics air handlers piping ductwork chillers controls

 Condenser Water: 3 GPM/Ton 57% @ 65 F 1% @ 85 F A= 100%")
 57% @ 65 F IPLV/NPLV is it good or bad?")
4 For example: Evaluate Real Chiller Efficiency Using IPLV or NPLV as a simple payback tool is simply WRONG! 1 Simple Comparative Tool? IPLV = ( 1 % 42 % 45 % 12 ) + + % + A B C D AHRI Conditions Chilled Water: 54 /44 F (12 /7 C) Condenser Water: 3 GPM/Ton 65 F 85 F A= 100% 85 F (30 C) B= 75% 75 F (24 C) C= 50% 65 F (18 C) D= 25% 65 F (18 C) 65 F IPLV/NPLV is it good or bad? NEITHER; it is just a rating point


 IPLV = 1% A")

5 Efficiency Calculations Index Rating vs. Real-World (because every project is unique) IPLV = 1% A % + 45% B C + 12% D How do the chillers in your plant run?

 is *good* for")


6 Efficiency Comparison IPLV/NPLV Good or Bad? IPLV (along with FULL load efficiency) is *good* for determining minimum efficiency requirements such as in ASHRAE Standard 90.1: Full load performance determines peak energy consumption, impacting utility demand charges and ratchets Part load performance reduces energy consumption as the load and lift decrease IPLV is *bad* for: Energy analysis Accurately representing a chiller s system energy use Indicating a financial payback Comparing VSD to non-vsd chillers ASHRAE Journal December 2009 IPLV is Neither Good nor Bad. It is a Rating Point.


7 Efficiency Comparison Real Payback Require Real Analysis System Analyzer TRACE 700 Building Energy Analysis Tool EnergyPlus Chiller Plant Analyzer Integrated Environmental Solutions Design tools available for accurate prediction.


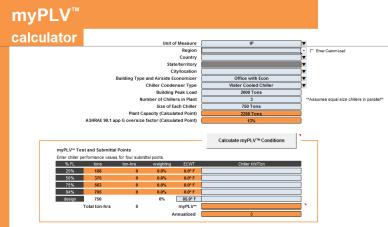
8 Trane myplv Accurately Predicting Your Future Chiller Part Load Performance myplv

9 Assumptions Comparison Weather Building Type Operation Hours Systems IPLV Weighted average of 29 cities across the U.S.A, represented 80% of chiller sales from 1967 to Weighted average of all types based on a DOE study Weighted average of various operations with chiller plants only, taken from the DOE study 1992and BOMA study Weighted average of systems with and without some form of economizer included. myplv Customized to your location (Global) Closely matched building type capabilities (building use, chiller plant design) Operational hours calculated Selectable number of chillers condenser control strategy customizable Performance is calculated based on national averages

10 myplv Because every project is unique Performance value calculated based on specific project Installation location Building type Operation conditions Chiller plant design Excel based Industry validated data Vendor agnostic Accurate performance based on unique project needs!
11 Real Life Example myplv Approach Real world conditions for real world buildings

12 Real Life Example myplv Approach Real world conditions for real world buildings


13 Real Life Example myplv Accurate Estimate Approximate Savings Centrifugal Chiller = $3,155 Financial Payback Calculation Made Easy
14 Why the Customer s Like Low Condenser Flow System efficiency increases Chiller works harder but is most efficient piece of equipment Lower flow equals less pumping energy and reduced pressure drops Pumps get smaller, so less horsepower Cooling towers get more efficient with smaller fans Cost of the job is reduced Equipment costs go down Trane CTV stays about the same price or even cheaper Cooling towers are sized on flow, smaller with less gpm Pumps are smaller Pipe size is reduced Contractor costs go down A smaller cooling tower may require smaller concrete pad and footprint Labor to install smaller piping will be cheaper Outside sound levels are reduced Smaller cooling towers generate lower dba s Additional capacity out of existing equipment


15 Quick Reference for Efficient Chiller Design Tools available to help you

16 Cooling Tower Selection Cooling tower cost can be reduced with lower condenser flow!
17 Low Condenser Flow - Summary Efficiency 3 gpm/ton Chiller = kw/ton Tower = 40 hp/500 tons = kw/ton Cond pump = (1500 gpm * 20 / 4000) / 500 tons = kw/ton Evap Pump = (1000 gpm * 18 / 4000) / 500 tons = kw/ton Total kw/ton = kw/ton 2 gpm/ton Chiller = kw/ton Tower = 20 hp/500 tons = kw/ton Cond pump = (1000 gpm * 20 / 4000) / 500 tons = kw/ton Evap Pump = (1000 gpm * 18 / 4000) / 500 tons = kw/ton Total kw/ton = kw/ton That s a saving of kw/ton (2.2%) and the installed cost is less!


18 myplv version 3 - Condenser Flow Optimizer
19 Series-Counter Flow
20 Series-Counter Flow Questions Efficient Chilled Water System - Maximized What Delta Ts are needed? What Temperatures are needed How does it benefit energy performance?
21 Chilled Water Design Parameters ASHRAE GreenGuide guidance on parallel plants Chilled water 12 F to 20 F ΔT 2.0 to 1.2 gpm/ton Condenser water 12 F to 18 F ΔT 2.5 to 1.6 gpm/ton Series-Counter Flow chiller plants Chilled water 16 F to 22 F ΔT 1.5 to 1.1 gpm/ton Condenser water 15 F to 18 F ΔT 2.0 to 1.6 gpm/ton
22 What Temperatures Required Remember the Rule of 2 to 1 For a given coil, a 1 degree increase in return water temperature requires a supply temperature 2 degrees cooler Coil originally sized for 44/54 with a 10 degree delta T requires: 42 degree water for 13 degree delta T 40 degree water for 16 degree delta T 38 degree water for 19 degree delta T Low Flow Benefits Reduced pumping energy More tons out of the distribution pipes
23 Parallel-Parallel Chillers 98.9 F 85 F 98.9 F 85 F 55 F 37 F RETURN SUPPLY 55 F 37 F 98.9 o F 62.9 o F 62.9 o F Equal lift 37 o F 37 o F
24 Series-Parallel Chillers 98.9 F 98.9 F 85 F RETURN SUPPLY 55 F 37 F 45.1 F 98.9 o F 53.8 o F 62.9 o F 6% Reduction 45.1 o F 37 o F Reduced lift = increased savings
25 Series-Series Chillers or Series-Counterflow Chillers 98.9 F 91.3 F 85 F RETURN SUPPLY 55 F 45.1 F 37 F 98.9 o F 91.3 o F 54.8 o F 54.3 o F 13% Reduction 45.1 o F 37 o F Further Reduced lift = MORE savings!!
26 Series-Series-Series Chillers or Series-Series-Counterflow Chillers 98.9 F 95.1 F 91.3 F 88.1 F 85 F 55 F RETURN 50.0 F 98.9 o F 45.1 F 95.1 o F 41.0 F 91.3 o F 37 F 88.1 o F SUPPLY 48.9 o F 50 o F 50 o F 51 o F 50 o F 19% Reduction EVEN Further Reduced lift = EVEN MORE savings!! 45.1 o F 41 o F 37 o F
 Chilled Water (kw) Condense r Water (kw) Cooling Tower (kw) Total")

27 Comparison of Power Requirements Arrangement Pumps Evap Condenser CH (kw) Chilled Water (kw) Condense r Water (kw) Cooling Tower (kw) Total Plant (kw) Paralle l Parallel 6, ,001 Series Parallel 5, ,385 Serie s Series Counterflo w Duplexes

28 Series-Series-Series Chillers 70% load ~constant speed pump 94.7 F 92.0 F 89.4 F 87.1 F 85 F 49.6 F RETURN 46.1 F 94.7 o F 42.7 F 92.0 o F 39.8 F 89.4 o F 37 F 87.1 o F SUPPLY 48.6 o F 49.3 o F 49.6 o F 50.1 o F 46.1 o F 42.7 o F 39.8 o F 37 o F EVEN Further Reduced lift = EVEN MORE savings!!

29 Series-Series-Series Chillers 70% load ~Variable Primary Flow 94.5 F 91.9 F 89.4 F 87.1 F 85 F 55 F RETURN 50.0 F 94.5 o F 45.1 F 91.9 o F 41.0 F 89.4 o F 37 F 87.1 o F SUPPLY 44.5 o F 46.8 o F 48.4 o F 50.1 o F 50 o F 4% Reduction 45.1 o F 41 o F 37 o F EVEN Further Reduced lift = EVEN MORE savings!!
30 Free Cooling Refrigerant Migration or a Plate Frame
31 Base Design Design Requirements 1400 ton building load 42/60 evap 85/2 gpm/ton cond VFDs N+1
32 Base Design Parallel-Parallel Chillers (identical) 98.9 F 85 F 98.9 F 85 F 98.9 F 85 F 60 F 42 F 930 gpm RETURN SUPPLY 60 F F gpm RETURN SUPPLY 60 F F gpm ton VFD chillers
33 Alternate Design Configuration Qty ton VFD chillers 42/60 and 42/51 evap 85/1500 gpmt cond Qty ton non VFD redundant chiller Free Cooling equipped 42/60 and 51/60 evap 85 / 1500 gpmt cond Series configuration

34 Free Cooling Design Series-Counter-flow (free-cooling upstream) 98.2 F RETURN F 85 F SUPPLY 60 F 51 F 42 F 1857 gpm 98.9 F 85 F RETURN SUPPLY 60 F F gpm Free Cooling with No VFD (same price)
35 Off Design Condition Building Loads 550 ton building load 38 WB 45 F Tower water available at max airflow


36 Base Design Parallel-Parallel Chillers (identical) 550 tons 61.4 F 52 F 60 F 42 F 730 gpm RETURN SUPPLY 60 F 0 gpm 42 F RETURN SUPPLY 60 F 42 F 0 gpm ton VFD chillers

37 Free Cooling Design Series-Counter-flow (free cooling upstream) RETURN 300 tons 45 F 49.9 F 49.9 F Bypass 300gpm 57 F 250 tons SUPPLY 60 F 52 F 42 F 730 gpm 730 gpm 98.9 F 85 F RETURN SUPPLY 60 F 0 gpm 42 F Reverse Flow to Parallel in Free Cooling
38 Comparison of Power Requirements Off Design Arrangement Pumps Evap Condenser CH (kw) Chilled Water (kw) Condense r Water (kw) Cooling Tower (kw) Total Plant (kw) Paralle l Parallel Series Free Cooling Series* *Counter-flow during mechanical cooling mode, but flow is reverse and thus in-line flow during free-cooling mode 28% Reduction in Energy Usage


39 Justin Wieman Thank you for your time and attention!