Source or Sink? Characterizing CH 4 flux in a Soybean and Corn Dominated Landscape
|
|
|
- Warren Harmon
- 5 years ago
- Views:
Transcription


1 Yale School of Forestry & Environmental Studies Source or Sink? Characterizing CH 4 flux in a Soybean and Corn Dominated Landscape Xin Zhang June 30, 2010


2 Outline Objectives Background Methods Results Summary
.")
3 Objectives To evaluate CO 2 and CH 4 fluxes from agricultural plants during the growing season (soybean and corn; aboveground and belowground section). To explore the impact of fertilization on CO 2 and CH 4 fluxes from agricultural fields.
4 Objectives (continued) To revise the current CH 4 inventory To build up a systematical method to research on gas inventory

5 Global CH 4 budget (IPCC, 2001) Sources CH 4 (Tg CH 4 yr -1 ) Natural Wetland Termites Ocean Hydrates 5-10 Anthropogenic Rice agriculture Ruminant animals Energy Landfills Biomass burning Total Sources Sink Troposphere OH Stratospheric loss soils 10-30

 Back ground concentration 25 CH 4 (59ppbv), CO 2 (1000ppm) and high purity")

6 A summary of observed CH 4 flux from Corn (zea mays) Reference Method Flow Light Temperatu re ( C) Beerling et 800ml al., 2008 min -1 Dueck et al., 2007 flow through cuvette; FID CH 4 sensing instrument continuous-flow gas cuvettes; 13C-labelling approach Kirschbaum non-flow-through and Walcroft, chamber 2008 Nisbet et al., 2009 Keppler et al., 2006 Vigano et al., l h -1 photosynthetically active radiation /dark controlled light intensity (300/600 µmol m -2 s -1 ) Back ground concentration 25 CH 4 (59ppbv), CO 2 (1000ppm) and high purity artificial air 25/35 12 CH 4 : 2100ppb 13 CH 4 : 22ppb CO 2 : 200~300ppm Intact/d Result etached intact -20 ~ 20 CH 4 gdw -1 h -1 intact 28±36 ng CH 4 gdw - N/A lighted by fluorescent lamps at the intensity of 5 µmol quanta m -2 s RH=100% CH 4 free intact -0.25±1.1 ng CH 4 gdw -1 h -1 non-flow-through N/A fluorescent, 180 µmol m -2 N/A ambient CH 4 detached emission was Chamber (gas removed s -1, photosynthetically concentration(1984- leaves negeligible at 24 hr. and 48 hr.) active. 2021ppb) incubation Chamber N/A direct sunlight ambient CH 4 free intact 374(198/598)ng temperature CH 4 gdw -1 h -1 Dark ambient CH 4 free intact 119(30.7/207) ng temperature CH 4 gdw -1 h -1 UV radiation: 49 W m ambient CH 4 flow-through chamber(detection limit ml min -1 is about 2 ng gdw-1 h-1) concentration or CH 4 free UV radiation: 49 W m ambient CH 4 ml min -1 concentration or CH 4 free detached (fresh) 1 h -1 50ng CH 4 gdw -1 h -1 detached 26ng CH 4 gdw -1 h -1 (dry)

7 Experiment artifacts Light condition Background CH 4 concentration Intact and detached plant Temperature and humidity

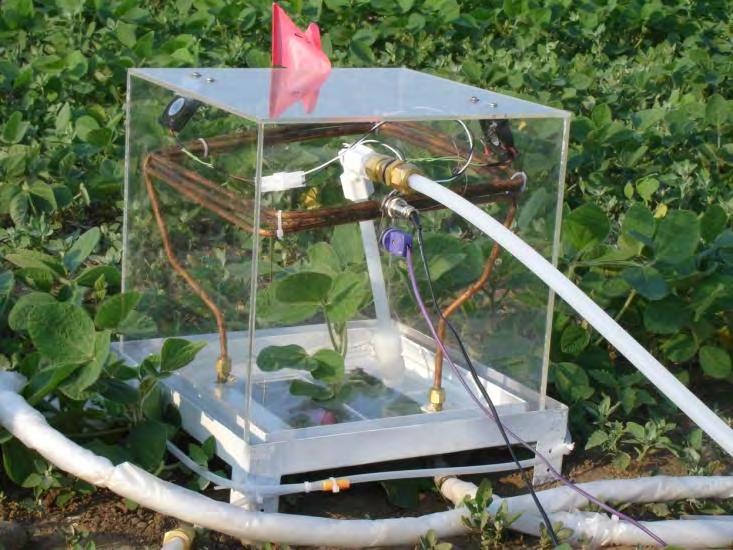
8 Methods: Dynamic chamber Transparent chamber Cooling system Platform CH 4 &N 2 O TGA MFC 0~2L/min Unsealed chamber system IRGA High frequency High accuracy Rotameter 1L/min Cooling system Inlet Outlet Pump Bleeder Rotameter 20~50L/min Fluxes= outlet-inlet


9 Methods- Modified Bowen Ratio method c 2 F2 F1 c 1 / z / z Assumption: all the scalar quantities were transferred indiscriminately. In the equation, F 2 is the flux of CH 4, F 1 is the flux of CO 2, c 2 / z is the gradient of CH 4, and c 1 / z is the gradient of CO 2. Here, the CO 2 flux was the average between close path eddy covariance systems on the two towers, one in corn field and in soybean field.


10 Research Site University of Minnesota Rosemount Research and Outreach Center Land cover types: within 5km, 32.5% for corn, 10.5% for soybean Soybean-corn rotation field Field management (fertilization, irrigation)


11 Methods: observation systems
12 Results: chamber blank tests Chamber CH 4 (µmol m -2 s -1 ) CO 2 (µmol m -2 s -1 ) Small ± ± 0.06 Medium ± ± 0.20 Big ± ± 1.19


13 Results: daily averaged plant flux
14 Results: plant flux through the growing season
15 Results: plant flux for midday and midnight 9 x x 10-3 CH 4 flux ( mol m -2 s -1 ) Soybean, day CH 4 flux ( mol m -2 s -1 ) Soybean, night Day of year 9 x Day of year 9 x 10⁻³ CH 4 flux ( mol m -2 s -1 ) Corn, day (a) (b) CH 4 flux ( mol m -2 s -1 ) Corn, night Day of year Day of year

 p = 0.0348 Not Related (-) p = 0.0127 (+) p= 0.084 Soil moisture (-) p =0.")
 N/A Not Related Not Related N/A (-) p=0.")
16 CH 4 flux vs. CO 2 flux and environment parameters P-value Daytime CH 4 flux from corn Nighttime CH 4 flux form corn Daytime CH 4 flux from soybean Incoming Solar radiation (+) p = Air Temperature (+) p = Not Related (-) p = (+) p= Soil moisture (-) p = Soil Temperature (+) p =0.035 Day time CO 2 flux (photosynth esis) (-) p = Night time CO 2 flux (respiration) N/A Not Related Not Related N/A (-) p=0.133 Not related Not related Not related (-) p=0.079 N/A Nighttime CH 4 flux form soybean Not related Not related (+) p=0.05 Not related N/A (-) p<1 10-7
 CH 4 flux ( mol m -2 s -1 ) 4 2 0 Corn -2 Unfertilized Night Fertilized Nigher -4 Unfertilized Day")

17 Results: CO 2 flux vs CH 4 flux on plant scale 6 x x 10-3 CH 4 flux ( mol m -2 s -1 ) Soybean -2 Unfertilized Night Fertilized Nigher -4 Unfertilized Day Fertilized Day CO 2 flux ( mol m -2 s -1 ) CH 4 flux ( mol m -2 s -1 ) Corn -2 Unfertilized Night Fertilized Nigher -4 Unfertilized Day Fertilized Day CO 2 flux ( mol m -2 s -1 ) Relation between CO 2 flux and CH 4 flux from plants: red dot daytime average flux from fertilized plant; blue dot daytime average flux from unfertilized plant; red triangle night time average flux from fertilized plant; blue triangle night time average flux from unfertilized plant.
18 Result: CH 4 production and consumption CH4 Day time Night time production UV radiation Diffusion consumption Methanotrophy / CO2 respiration Methanotrophy / CO2 respiration
19 Results: Regional scale flux 0.1 CH 4 flux ( mol m -2 s -1 ) Local standard time (hr) Ensemble diurnal variation of CH 4 fluxes calculated from the tall tower gradient measurement, August 2009: blue dot hourly flux value; red circle median value for each hour of the day


20 Nigh time flux CO 2 gradient and H 2 O gradient correlated CO 2 gradient vs CH 4 gradient on regional scale Diurnal pattern of CH 4 concentration
 0.6 0.4 0.")


21 Results: CO 2 gradient vs CH 4 gradient on regional scale 0.8 CH 4 Gradient (ppm) CO 2 Gradient (ppm) Linear relationship between the night CH 4 and CO 2 gradients, August The results of the linear regression are shown. Each data point represents the block average between LST.
22 Result: diurnal pattern of CH 4 concentration 3 CH 4 concentration (ppm) Diurnal composite of 0CH concentration near ground in The blue dots are a combination of CH4 concentration Local measured standard on time(hr) 3.5m at corn field during DOY 218~227 and on 3m at tall tower during 233~273. The red line is the mean value of all the concentration on each hour, and the error bars are the standard deviation.


23 STILT model
 and modeling(g) 2.15 2.1 2.15 2.1 2.05 2.05 2 1.95 2 248 250 252 254 256 258 260 1.")
24 Observe vs. modeled CH4Flux=0.02; CCH4 at 3m(r) and 200m(b) CH4Flux=-0.04; CH 4 from observation(200m,b) and modeling(g)
25 Summary Method Target DayCH 4 NightCH 4 Chamber Corn (unfer) Corn (fer) Soybean (unfer) Soybean (fer) Tall tower Landscape (corn/soybean/ soil/industry/la ndfill )
26 Summary Method Target DayCH 4 NightCH 4 Chamber Corn (unfer) Corn (fer) Soybean (unfer) Soybean (fer) Tall tower Landscape (corn/soybean/ soil/industry/la ndfill )
 +0.3 10-3 -0.2 10-3 Tall tower Landscape (corn/soybean/ soil/industry/la ndfill ) -0.04 0.02")
27 Summary Method Target DayCH 4 NightCH 4 Chamber Corn (unfer) Corn (fer) Soybean (unfer) Soybean (fer) Tall tower Landscape (corn/soybean/ soil/industry/la ndfill )