Retrofit of membrane carbon capture processes to cement manufacture
|
|
|
- Allison Janice Gray
- 5 years ago
- Views:
Transcription

1 Retrofit of membrane carbon capture processes to cement manufacture Olivia Improta, Dursun Can Ozcan, Hyungwoong Ahn, Stefano Brandani and Maria-Chiara Ferrari University of Edinburgh, School of Engineering, Edinburgh SCCS Scottish Carbon Capture and Storage Centre 13 th June 2017 EU funded Project Innovation and Networks Executive Agency (INEA) Grant Agreement Number:
 1 Accounts for more than 5% of global emissions from stationary sources 2 The Intergovernmental Panel on Climate Change (IPCC) concluded that consequential reductions of")
2 CO 2 Emissions from Cement Industry Schematic diagram of a cement plant Cement is a key construction material (3.78 billion tons in 2012) 1 Accounts for more than 5% of global emissions from stationary sources 2 The Intergovernmental Panel on Climate Change (IPCC) concluded that consequential reductions of global emissions by at least 50% are required by 2050 A more efficient thermal management has potential to reduce CO 2 emissions but deployment of a carbon capture technology is required to reach up to 90% 1 CW Group, Global Cement Volume Forecast Report, 2012.; 2 IPCC, In Climate Change
3 Reference Cement Plant The base cement plant is based on a dry process and includes all the major units: raw mill, preheaters, pre-calciner, kiln and cooler. The CO 2 generation intensity is around 0.8 ton CO 2 /ton clinker. The required thermal energy for unit clinker production is estimated to be 3.13 MJ th /kg clinker. To Atmosphere Raw Meal To Atmosphere B/F R/M 1 st PHE 2 nd PHE Gas Flow Solid Flow 3 rd PHE Coal Pet Coke 4 th PHE B/F F/D Collected Dust Primary Air Secondary Air Pre-C Kiln Cooler B/F Excess Air Clinker To Atmosphere Air Air Air Air Cooling Tertiary Air Air R/M: Raw Mill; B/F: Bag filter; PHE: Preheater; F/D: fuel drying; Pre-C: Pre-Calciner Ozcan D.C. et al International Journal of Greenhouse Gas Control 19: p
4 Permeate Membrane Separation Process Two stage membranes with recycle of 2 nd retentate and then CO 2 compression till 150 bar in a dense phase Conceptually simple process Flue Gas Retentate To atmosphere Modular and flexible solution High CO 2 concentration in kiln flue gases To compression Honeywell UniSim Design Simulation Membrane module implementation - Pressure drops, and non-ideal behaviour are considered - Multicomponent simulation - Orthogonal Collocations on Finite Elements Method (OCFEM) 4
5 Retrofit to cement plant Application of membrane technology end-of-pipe Stream Conditions CO 2 (mol%) 22.4 N 2 (mol%) 58.2 O 2 (mol%) 6.05 H 2 O (mol%) 13.2 Molar flow [kmol/h] 9382 Temperature [ C] 30 Pressure [kpa] Aim 90% CO 2 Recovery and 0.95 of CO 2 Purity 5


6 Membrane Materials PIM-1 McKeown, N.B. and Budd, P.M.,Chem. Soc. Rev., 2006, 35,

7 90% Recovery - 95% purity Running the simulation with 2 components and maintaining the same area and permeability, would reduce the recovery to 18% and the final purity to 59.7%. Water in the stream has a positive effect acting as an internal sweeping in the module and increasing the driving force for CO 2. 7

8 Material stability In reality, water is likely to hinder the permeation of CO 2 and this effect should be taken into account. Other important factors to be considered are the physical ageing of the material and the effect of other impurities. Lasseuguette E. et al International Journal of Greenhouse Gas Control 50: p Lau C.H.et al Angew. Chem. Int. Ed. 53: p

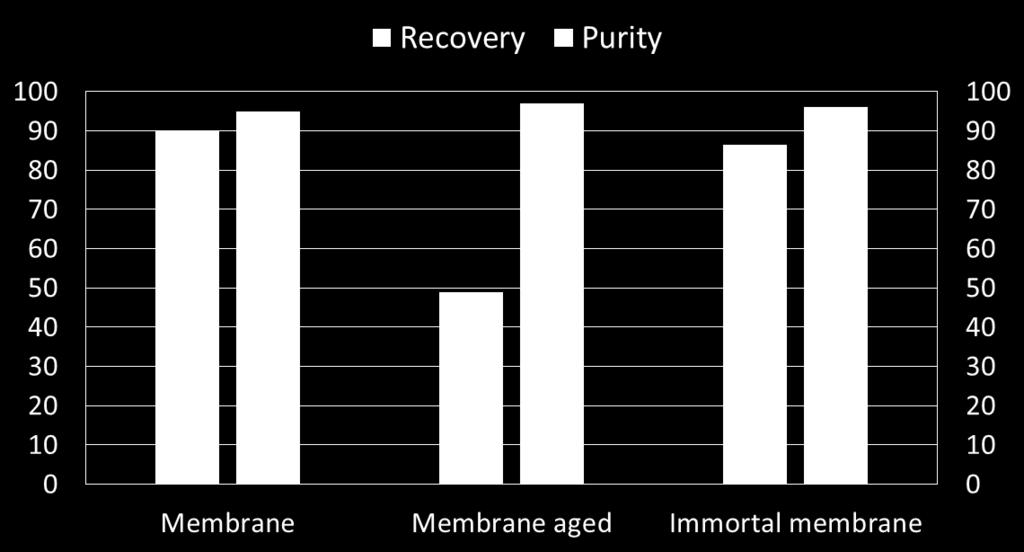
9 Material stability 9


10 Optimised configurations 90% Recovery and 95% purity Electric power converted to thermal (conversion factor 0.4) Ozcan D.C. et al International Journal of Greenhouse Gas Control 19: p


11 Comparison with other technologies Incremental Energy consumption = Net energy consumption Capture Net energy consumption Base case CO 2 intensity base case CO 2 intensity Capture CO 2 inensity base case = Amount of CO 2 emitted Clinker production capacity Ca-looping is not simple retrofit but full integration 11
12 Economic Analysis The comparison of different system integrations should take economic feasibility into consideration Levelised cost of cement production (LCOC) has been estimated for the base cement plant and the capture processes; thus, CO 2 avoided cost can be calculated from increase in LCOC Levelised cost of cement production ratio of the net present value of total capital, variable and operating costs of a cement plant to the net present value of cement production over its operating life I t : capital costs (CAPEX) M t : O&M V t : variable costs r : discount rate CC suffix: carbon capture IEA, CO 2 Capture in the Cement Industry, July 2008/3,
 Ca-looping full integration ETS: 14 /ton CO 2")
13 Economic performance ETS: Emission Trading System; Variable cost; O&M: operative and manteinance cost; TCR: Total Capital requirement Cost of electricity: 50 /kwh Immortal membrane considered at double cost compared to base case (50 $/m 2 ) Ca-looping full integration ETS: 14 /ton CO 2 13

14 Economic performance FGD accounts for 40% of the total investment cost in the capture case with membranes. If we consider FGD as part of the cement plant the increase in LCOC using Membrane is 15% instead of 22% ETS: Emission Trading System; Variable cost; O&M: operative and manteinance cost; TCR: Total Capital requirement 14
 Ca-looping full integration")
15 Avoidance cost Cost of CO 2 avoided = LCOC cc LCOC base ton CO 2 ton cement base ton CO 2 ton cement cc Immortal membrane considered at double cost compared to base case (50 $/m 2 ) Ca-looping full integration 15
16 Conclusion Membranes are a viable alternative capture process for cement plants. Minor components can affect dramatically the process configuration and performance and should be taken into considerations. High permeance-low selectivity material can deliver 90% capture rate at the usual 95% purity. For very low selectivity, an additional refrigeration stage required for certain materials has a marginal effect on cost. Materials stability is key factor in establishing the potential of membranes in carbon capture applications 16

17 Acknowledgements Membrane group, School of Engineering, University of Edinburgh: Dr Elsa Lasseuguette Nicholas Bryan Dr Davide Bocciardo Process Engineering Research Team, School of Engineering, Università degli studi di Genova: Prof Barbara Bosio Thank for your attention This project has received funding from the European Union s Horizon 2020 research and innovation programme under Grant Agreement No Present results reflect only the author's view - INEA is not responsible for any use that may be made of the information it contains. 17