Realistic opportunities for wood energy
|
|
|
- Lawrence Benson
- 5 years ago
- Views:
Transcription
1 Realistic opportunities for wood energy Warren Mabee Forest Products Biotechnology, University of British Columbia Main Mall, Vancouver, BC, Canada V6T 1Z4 Forest Sector Competitiveness: Finding a pathway to renewal BC Forum on Forest Economics & Policy 20 June 2007
2 Bioenergy definitions Bioenergy is the use of biomass to generate: Heat (hot air, steam) Power (electricity) Solid fuels (pellets) Liquid fuels (ethanol, biodiesel, etc.) Gaseous fuels (biogas, methane, etc.) 1 st -generation biofuels Agriculture-based (food) feedstocks (i.e. sugar, corn, wheat, oilseeds) Waste food feedstocks (i.e. used cooking oils, yellow grease) Examples: sugarcane ethanol, corn ethanol, biodiesel 2 nd -generation biofuels Non-food feedstocks (primarily lignocellulose, from agriculture and forest operations) A number of technical platforms (bioconversion, thermochemical conversion) Examples: cellulosic ethanol, biosyndiesel, Fischer-Tropsch fuels
3 Outline What bioenergy options are realistic? -Residential bioenergy -Industrial bioenergy & bioelectricity -Wood pellets (solid biofuel) -Liquid biofuels

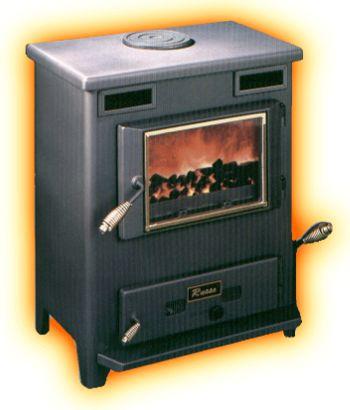
4 Small-scale application
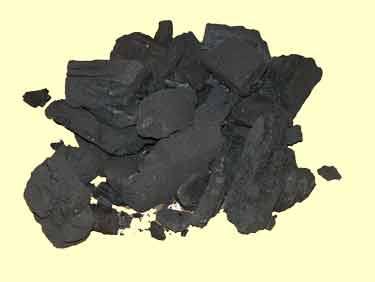
5 Efficiency of energy recovery Open fire Traditional wood stove Charcoal Wood pellet stove Conversion efficiency (η e ) Avg. energy delivered (GJ/bdt wood) Note: Average energy in wood, bone-dry basis: GJ/bdtonne Sources: Karlsson, Gustavsson 2003; Mabee et al. 2001

6 Industrial bioenergy use >1.2 million TJ million TJ million TJ <0.4 million TJ Sources: IEA 2007
7 Industrial bioenergy use Canada: #4 Worldwide PJ (USA #1 1,131 PJ) >1.2 million TJ million TJ million TJ <0.4 million TJ Sources: IEA 2007

8 Global bioelectricity >45,000 GWh 30-45,000 GWh 15-30,000 GWh <15,000 GWh Sources: IEA 2007
9 Global bioelectricity (2004) Canada: #5 Worldwide - 8 TWh (USA #1 40 TWh) >45,000 GWh 30-45,000 GWh 15-30,000 GWh <15,000 GWh Sources: IEA 2007


10 Power generation units Combust wood chips or pellets in a power boiler Can use mill wastes or hogfuel eg: Williams Lake Power Facility, BC (65 MW)

11 Combined Heat and Power Can deliver both heat and power (electricity) Can be used in District Heating systems Residential Industrial Institutional Allows optimal energy recovery from the feedstock
12 Efficiency of energy recovery Conversion efficiency (η e ) Avg. energy recovered (GJ/bdt wood) Combined Heat & Power (CHP) Steam-turbine power boiler Gasifier/power generator CHP with Flue Gas heat recovery Sources: Karlsson, Gustavsson 2003; Mabee et al. 2001
 (University of South Carolina) Dockside Green (Victoria, BC) Proposal with Pristine Power to build a $500 million bioenergy power network in")
13 Nexterra BC-based company Leader in gasification technology for heat & power generation Projects and partners across North America include: Tolko (11 MW) (Kamloops) Johnson Controls (21 MW) (University of South Carolina) Dockside Green (Victoria, BC) Proposal with Pristine Power to build a $500 million bioenergy power network in BC

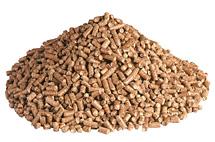
14 Sources: Swaan J (2006). Canadian Wood Pellet Association
15 Wood pellet energy balance Energy input Harvest-to-mill Mill construction Mill operation (Drying-Milling-Pressing-Cooling-Screening-Bagging) n.a GJ/tonne GJ/tonne Pellet transport: 200 km truck 1000 km train 10,000 km ship GJ/tonne GJ/tonne GJ/tonne Total inputs Total outputs Net energy efficiency GJ/tonne 16 GJ/tonne Source: Hoque et al. 2006
16 Outline What bioenergy options are realistic? A. Residential, industrial bioenergy & bioelectricity, pellets -Technically viable options -Need policy support (capital and production incentives) -Already great examples here in BC
17 Canadian energy demand by fuel Energy demand by fuel (EJ) Refined petroleum products (RPPs) Natural gas Electricity Other (coal, wood, LPG, coke, etc.) Source: Natural Resources Canada (2000). Canada s Emissions Outlook Update
18 Canadian RPP demand by end-use Refined petroleum product demand by end-use (EJ) Transportation Industrial Residential/Commercial Electricity generation Source: Natural Resources Canada (2000). Canada s Emissions Outlook Update
19 Looking back and forward log (primary energy use) by category Carbohydrate economy??-1800 Hydrocarbon economy Carbohydrate economy ?? Agricultural-based Industrial revolution Coal Oil & Gas Biomass & renewables
20
21 40 YEARS of oil left at current consumption
22 Ethanol production (sugar, corn) 50,000,000 40,000,000 30,000,000 20,000,000 Others India China EU US&Can Brazil 10,000,
23 Ethanol production (cellulosic) 50,000,000 40,000,000 Cellulosic ethanol <0.1% of total bioethanol production 30,000,000 20,000,000 10,000,

 Bolling, C. and Suarez, N.R. (2001).")
24 Sugar-to-ethanol (Brazil) SUGAR Pretreatment Fractionation Policies enacted in mid-1970 s to encourage sugar-to-ethanol Hexoses Fermentation Recovery Sources: (1) FAOStat 2006; (2) Bolling, C. and Suarez, N.R. (2001). USDA/ERS SSS-232.
25 Sugar-to-ethanol (Brazil) SUGAR Pretreatment 500 Sugarcane production by product (million metric tonnes) Fractionation Ethanol Hexoses Fermentation Recovery Sugar Sources: (1) FAOStat 2006; (2) Bolling, C. and Suarez, N.R. (2001). USDA/ERS SSS-232.
26 Sugar-to-ethanol (Brazil) SUGAR Pretreatment Fractionation By mid-1980 s industry had reached saturation of the sugar-cane resource (i.e. 10 years) Hexoses Fermentation Recovery Sources: (1) FAOStat 2006; (2) Bolling, C. and Suarez, N.R. (2001). USDA/ERS SSS-232.
27 Corn-to-ethanol (USA) SUGAR STARCH Pretreatment Fractionation Enzymatic Hydrolysis First push for corn-to-ethanol came in the early 1980 s Hexoses Fermentation Recovery
28 Corn-to-ethanol (USA) SUGAR STARCH Pretreatment 300 Corn production by product (million metric tonnes) Residual Fractionation 200 Ethanol Hexoses Enzymatic Hydrolysis 100 Trade Food, Bioproducts Fermentation Recovery 0 Animal Feed
29 Corn-to-ethanol (USA) SUGAR STARCH Pretreatment Fractionation Enzymatic Hydrolysis Hexoses Fermentation Recovery By early 1990 s, industry was viable but not large; Rising oil prices in 2000 s has given the industry much more impetus for growth
30 Wood-to-ethanol SUGAR STARCH LIGNOCELLULOSE Trade-off: feedstock cost vs process complexity Pretreatment Pretreatment Pretreatment Fractionation Fractionation Fractionation Enzymatic Hydrolysis Enzymatic Hydrolysis Fermentation Recovery Fermentation Recovery Fermentation Recovery BIOFUELS BIOENERGY BIOPRODUCTS
 Products include (1) lignin (2) furfural (3) ethanol 3 key products to minimize risk Further co-products will strengthen business")
31 Lignol Energy Corporation Organosolv pulping originally developed by GE and Repap for pulp and paper application US$100 million investment in 80 s-90 s Vancouver, British Columbia 1 tpd pilot plant (hardwood & softwood residues) Products include (1) lignin (2) furfural (3) ethanol 3 key products to minimize risk Further co-products will strengthen business later
32 Outline What bioenergy options are realistic? A. Liquid biofuels (i.e. alcohols, forest-based biodiesel) Feedstock availability is a major driver towards wood-based biofuels


33 Canadian ethanol production Current capacity Under construction Announced but not started ~750 million litres current capacity 700 million litres cap. under construction


34 Canada Forests
35
36
37
38


 Council of Forest")
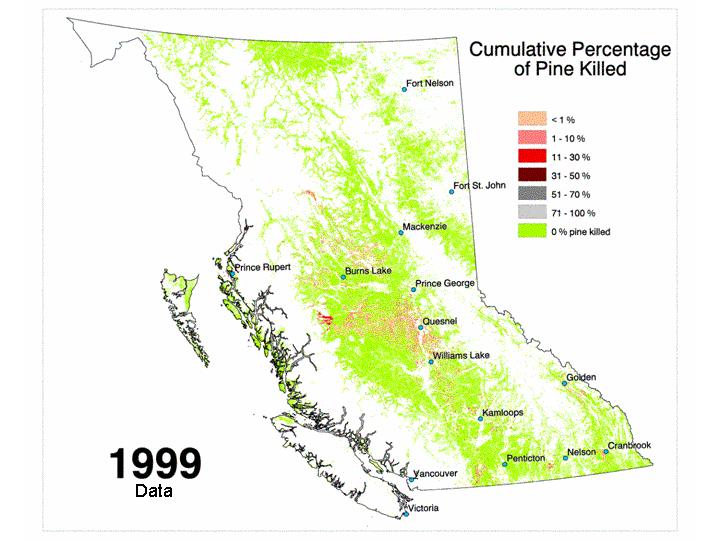
39 Cumulative impacts - area million ha 2005: 15 million ha dead & dying Denmark 5 million ha Portugal 10 million ha Sources: 1) Council of Forest Industries 2005.


40 Resource-reliant communities 5 communities have a pulp mill and are in the path of the current Mountain pine beetle outbreak
41 Outline What bioenergy options are realistic? A. Liquid biofuels (i.e. alcohols, forest-based biodiesel) Feedstock availability is a major driver towards wood-based biofuels Currently in late RD&D phase. Technical challenges remain - first demonstrations under construction
42 US Biofuel RD&D Department of Energy Biomass Program: Large-scale ethanol demonstration (6): $385 M Demonstration-scale biorefineries (10): $200 M Research Centres (3): $375 M BP Energy Biosciences Institute Headquartered at UC Berkeley (10 yr funds): $500 M

43 BP Energy Biosciences Institute Announced Feb. 1, 2007 Headquartered at UC Berkeley, with partners at University of Illinois, Lawrence Berkeley National Labs $500 million research funding, 25 faculty-level PIs Aim: to develop new sources of energy and reduce the impact of energy consumption on the environment
44 US Examples (Cellulosic Ethanol) 1. Abengoa Bioenergy: up to $76 million (Kansas) 2. Alico: up to $33 million (Florida) 3. BlueFire Ethanol: up to $40 million (California) 4. Poet: up to $80 million (Iowa) 5. Iogen Biorefinery Partners: up to $80 million (Idaho) 6. Range Fuels: up to $76 million (Georgia) TOTAL DOE Investment: (up to) US$385 million
45 EC 7 th Framework FP7 (duration ) allocates Billion to universities, industry, research centres and public authorities for Transport (including Aeronautics): Billion for Energy Billion First calls for proposal ( DGTREN): Air Transport: 4 million Surface Transport: 60 million Energy: 128 million
46 Outline What phase are we currently in? A. Currently in late RD/ early RD&D phase. Technical challenges remain - first demonstrations under construction When will deployment begin?
47 Outline What phase are we currently in? A. Currently in late RD/ early RD&D phase. Technical challenges remain - first demonstrations under construction When will deployment begin? A. After the first demonstrations prove successful likely 3-5 years from now Industry likely will reach a significant production capacity about 10 years after (i.e. 15 years from now) Policy drivers are required as well as continued technical progress and industrial experience
48 Policy drivers for bioenergy Climate change Climate-related disturbances are creating opportunities as well as increasing public demand Oil prices, scarcity Need to substitute renewable products for fossil products (i.e. bioproducts) Personal transportation Need to supply an expanding transportation sector (i.e. biofuels -> bioethanol, biodiesel) Security of supply
49 Take-home messages Realistic bioenergy options depend upon your perspective Technologically-feasible processes exist now, mostly for heat and electrical power generation Greatest historical increases in energy demand are for transportation fuels The biorefinery concept can maximize returns and improve the economic performance of bioenergy production Policy and technology must work together to let BC bioenergy succeed Feedstock availability is a key factor and BC s advantage

50 Acknowledgements Natural Resources Canada IEA Bioenergy Task 39 NSERC Forest Products Biotechnology Colleagues and collaborators Questions?