Update on the Barnett Shale. Ed Ireland, Ph.D. Executive Director Barnett Shale Energy Education Council
|
|
|
- Easter Fleming
- 5 years ago
- Views:
Transcription

1 Update on the Barnett Shale Ed Ireland, Ph.D. Executive Director Barnett Shale Energy Education Council

2 What is the Barnett Shale Energy Education Council? Established to provide factbased information on natural gas production in North Texas Comprised of leading energy companies in the region Non-profit, statewide resource

3 Shale Plays in the U.S.


4 Why Natural Gas? Daniel Yergin: It s simply the most significant energy innovation so far this century. Colorado Gov. Bill Ritter: mission critical. bridge fuel 1.3 million jobs in Texas 12% of total employment Cleanest fossil fuel Highly efficient Helps improve our country s energy security


5 The Benefits to Texas $6 billion annually in economic activity 70,000 direct jobs in North Texas; hundreds of thousands indirectly Rainy Day Fund funded by oil and gas severance taxes
6 Issues in the Barnett Shale Early Issues: noise, lighting, safety, truck traffic, water use, water disposal Later issues: water use, water disposal, earthquakes, contribution to ozone levels Latest issue: Benzene
7 Benzene Issue Timeline October 27, 2009: TCEQ published a memorandum about their initial test results near Dish which reported high levels of benzene at 2 facilities in southern Wise county and that they were conducting more tests October 29: First news report from WFAA Cancer causing toxin found in the air near gas facilities in the Barnett Shale
8 Benzene Issue Timeline Jan. 12, 2010: TCEQ reported that 126 air samples at gas wells in Fort Worth showed no detectable levels of benzene; later revised to report some low levels of detection. Anti-drilling groups criticized the study as being invalid because it was cold when samples were taken and they did not take enough samples
9 Benzene Issue Timeline Jan. 27, 2010: TCEQ reported on their 6 month investigation of 94 gas well in the Barnett Shale and compressor sites. Two (the same 2 reported in Aug.) exceeded acceptable levels and 19 showed elevated levels of benzene that may require action by facility operators.
10 TCEQ Jan. 27 report The other 73 sites didn t show high emission levels and the study didn t collect air samples farther away from the well sites where residents would likely breathe in the chemicals Wall Street Journal The Commission s chief toxicologist stated the test results prove there is no need for widespread alarm.
11 One report, many interpretations Barnett Shale study reveals alarming results Agency says that gas wells spew cancer causing chemicals all across north Texas State regulators found high levels of benzene at one in every five sites in the Barnett Shale TCEQ: Benzene not detected at most Barnett Shale gas sites
12 BSEEC Study Background BSEEC wanted to provide the public with data about air quality in the Barnett Shale Study focused on Fort Worth/Arlington urban area Engaged TITAN Engineering to conduct the study, a licensed engineering firm in Texas Goal of study was to test natural gas sites for VOCs, sulfur compounds and formaldehyde
13 Ambient Air Quality Study Doug Canter, TITAN Engineering
14 Site Selection Criteria Study Design - Random/Representative Sites vs. Intentional Bias to Projected Worst-Case Sites Looked at all wells in Fort Worth and Arlington District 2 Ranked by production and liquids produced per District COFW picked 2 compressor stations and TITAN chose 8 well sites projected to have the highest benzene emissions Sampled at locations predicted to have the highest concentrations
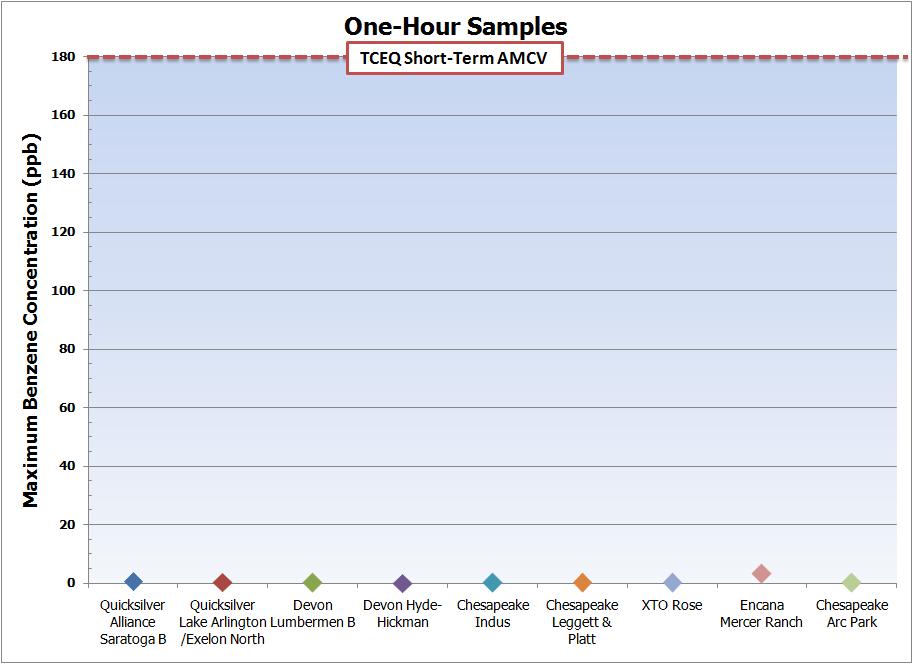
15 Study Conclusions: VOCs Tested for 81 VOCs No one-hour samples exceeded the short-term AMCV One 24 hour sample (1.96 ppbv at Mercer Ranch in District 3) slightly exceeded the 24 hour long-term screening criteria (1.4 ppbv) but was still significantly under the applicable ATSDR minimum risk level (9 ppbv)
16
17
18 Study Conclusion Based on the results of this study and the health effects criteria employed, TITAN concludes that harmful levels of benzene and other pollutants are not being emitted from natural gas sites in the study area.
19 What does all this mean? Janet E. Kester, Ph.D., D.A.B.T.
20 What is a Part per Billion (ppb)? One part per million = 1,000 parts per billion One second in 32 years One inch in 15,783 miles One teaspoon in a million gallons of water One pinch of salt in ten tons of potato chips
21 Interpreting Environmental Data Compare results to: Risk-based screening levels Effects levels Background/ambient levels
 Paracelsus (1493-1514)")
22 What is a Toxic Chemical? Accused by his many detractors in the medical establishment of poisoning his patients, the Renaissance physician (and alchemist) Paracelsus ( ) famously retorted All substances are poisons, and nothing is without poison. The dose alone differentiates a poison from a remedy.


23 Risk Assessment Toxicology Epidemiology RISK = TOXICITY & EXPOSURE Route of Exposure Concentration Duration and frequency Contact or intake rate
24 Air Monitoring Comparison Values (AMCVs) Exposure to an air concentration at or below the AMCVs is not likely to cause adverse health effects in the general public, including sensitive subgroups such as children, the elderly, pregnant women, and people with preexisting health conditions. If predicted or measured airborne levels of a constituent do not exceed the comparison level, adverse health or welfare effects would not be expected to result. If ambient levels of constituents in air exceed the comparison levels, it does not necessarily indicate a problem, but rather, triggers a more in-depth review.
25 Air Monitoring Comparison Values (AMCVs) for Benzene Short-term = 180 ppb based on acute exposure health and welfare data, is compared to monitored concentrations that can be instantaneous or up to 1-hour. Long-term = 1.4 ppb based on chronic health and welfare data, is used to evaluate annual averaged monitored concentrations or annual concentrations averaged over multiple years (if available)
26 What about a 24-hour sample?? Agency for Toxic Substances and Disease Registry (ATSDR) (public health agency of U.S. DHHS) provides acute Minimal Risk Levels (MRLs) for exposure of 1-14 days [MRLs] are below levels that might cause adverse health effects in the people most sensitive to such chemical-induced effects. Exposure to a level above the MRL does not mean that adverse health effects will occur. MRLs are intended only to serve as a screening tool to help public health professionals decide where to look more closely. (ATSDR (2007) Toxicological Profile for Benzene [ Acute MRL for benzene = 9 ppb
27
28 Acute Effects Levels EPA Acute Exposure Guideline Levels (AEGLS) AEGL-1: the airborne concentration of a substance above which it is predicted that the general population, including susceptible individuals, could experience notable discomfort, irritation, or certain asymptomatic nonsensory effects. However, the effects are not disabling and are transient and reversible upon cessation of exposure. Benzene AEGL-1 values (ppb) 10 min 30 min 60 min 4 hr 8 hr 130,000 73,000 52,000 18,000 9,000 [
 studies, as cited in ATSDR")
29 Sources of Benzene Emissions Data from EPA Total Exposure Assessment Methodology (TEAM) studies, as cited in ATSDR (2007)
 (Wilbur et al.")
30 Sources of Benzene Exposure Even passive exposure to cigarette smoke is responsible for more benzene exposure (about 5% of the total) than the emissions from the entire industrial capacity of the United States (about 3% of the total) (Wilbur et al. 2008) Data from EPA Total Exposure Assessment Methodology (TEAM) studies, as cited in ATSDR (2007)
31 Typical Levels of Benzene in the Environment Pumping Gas Rush Hour Traffic Driving Homes with Smokers Homes w/o Smokers Major Cities Rural areas Benzene Concentration (ppbv) Data from ATSDR (2007) Toxicological Profile for Benzene [
32 Ambient Benzene Concentrations in the U.S., Benzene concentrations in the U.S. declined 65% between 1994 and

33 Ambient Benzene Concentrations in the U.S., Dallas-Fort Worth Annual average mean and median values in Dallas-Fort Worth area monitors show similar levels and trend
34 YTD ave. = 0.11 YTD ave. = 0.05 From TCEQ website [

35 Benzene Concentrations in Texas Metropolitan Areas (2009) Data from TAMIS [
36