Capture of CO 2 from industrial sources. Professor Dianne Wiley School of Chemical Engineering, UNSW Australia
|
|
|
- Anthony Clinton Wells
- 5 years ago
- Views:
Transcription

1 Capture of CO 2 from industrial sources Professor Dianne Wiley School of Chemical Engineering, UNSW Australia IEAGHG Summer School 2015 University of Western Australia Perth AUSTRALIA 6-12 December 2015
 IEA")
2 Industrial CCS is essential Source: Energy Technology Perspectives 2015 Mobilising Innovation to Accelerate Climate Action (2015) IEA 2
 IEA")
3 Deployment ramp up from 2025 Source: Energy Technology Perspectives 2015 Mobilising Innovation to Accelerate Climate Action (2015) IEA 3

4 Direct CO 2 emissions (2010) Aluminium 1% Pulp and paper 3% NG Processing 3% Iron & Steel 35% Refining 10% Chemicals 18% Cement 30% Adapted from: Energy Technology Perspectives 2012 Pathways to a Clean Energy System (2012) IEA 4

5 Emission of CO 2 from industrial processes 5
6 Major source of CO 2 in industrial processes Chemical reactions that produce CO 2 On-site production of heat or electricity required for production and manufacturing boilers, burners, furnaces 6
7 World proven natural gas reserves (2011) Trillion m Africa East Asia Europe LAC MENA North America South & Central Asia SE Asia & Pacific Source: World Energy Council (2013) World Energy Resources: 2013 Survey 7
8 Natural gas composition Component Chemical Formula Typical range Methane CH % C2-C4 (Ethane, Propane, Butane) C 2 H 6, C 3 H 8, C 4 H % Carbon dioxide CO 2 0-8% Oxygen O % Nitrogen N 2 0-5% Hydrogen sulphide H 2 S 0-5% Rare gases Ar, He, Ne, Xe trace Compare coal seam gas (coal bed gas, coal bed methane, coal mine methane) contains CH 4, CO 2, H 2 O little H 2 S, C 2 H 6, C 3 H 8, C 4 H 10 Source: 8
9 Natural gas usage Domestic gas In Australia, CO 2 needs to be reduced to <2% LNG (Liquified Natural Gas) CO 2 <100 ppmv Industrial Gas CO 2 is removed to meet downstream processing and usage requirements 9

10 Natural gas processing 10
11 Overview of CCS for natural gas processing CO 2 emissions: centralised separation Attractions: already part of the processing operations Future challenges: high concentration CO 2 fields (up to 80%) sour gas fields 11
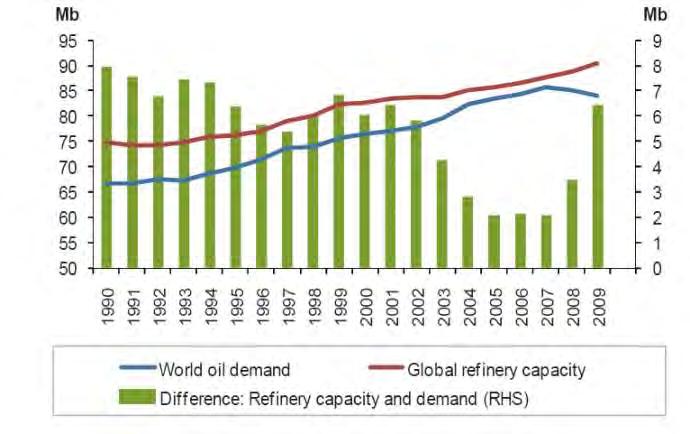
12 Global oil refinery production Source: mark range-oil-tec.htm 12

13 Some typical crude oil components Source: : 13

14 Crude oil refining: one type Source: C&I Engineering, 14

15 Crude oil refining: indicative CO 2 emissions Source: C&I Engineering, 15
16 Effect of crude quality on CO 2 emissions Source: G. Karas, Oil Refinery CO 2 performance (2011) Communities for a Better Environment 16
17 Overview of CO 2 capture for oil refineries CO 2 emissions: many distributed locations at variable volumes Attractions: low grade heat available Best opportunities for capture: hydrogen plant o pure CO 2 at atmospheric pressure reformer, catalytic cracker, vacuum distillation o CHP units with CO 2 capture process heaters, furnaces, boilers o similar to power plant compositions 17

18 Biofuels Solid, liquid or gas fuel derived from biomass Solid: sugarcane bagasse, native grasses, miscanthus, switchgrass, hemp, corn, poplar, willow, sorghum, trees Liquid: bioethanol, biodiesel, aviation fuel Gas: landfill gas, digester gas Source: 18
19 Overview of CO 2 capture for biofuels CO 2 emissions: many distributed locations at variable volumes many locations with low to moderate concentration Attractions: low grade heat available energy production from renewable sources 19
20 Global cement production Source: 20
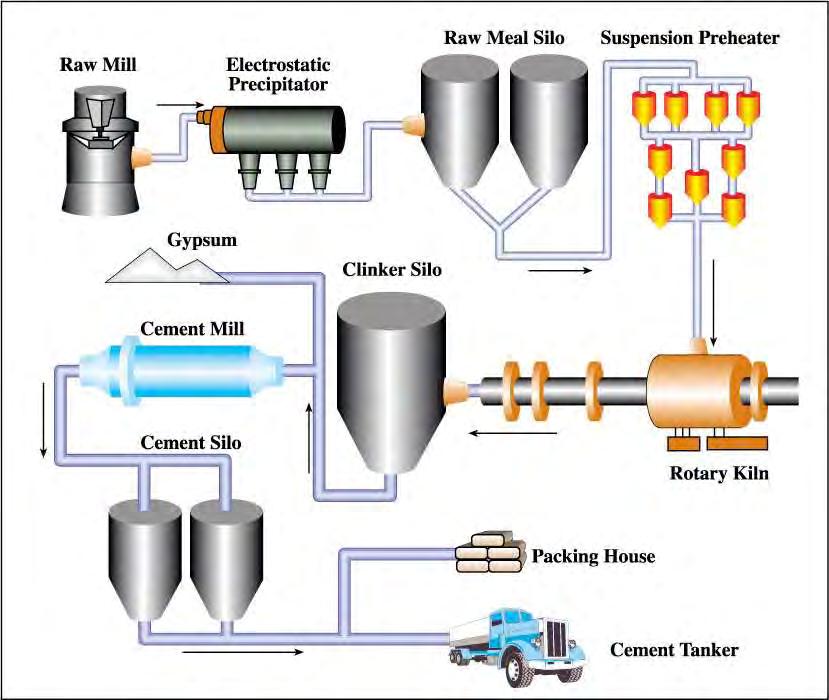
21 Cement production Source: notrickszone.com/2010/07/11/low-energy-cement-production-new-development/ 21


22 Cement production 0.5 kg CO 2 /kg clinker 22
23 Challenges of CO 2 capture for cement Flue gas: high CO 2 concentration low SO 2 concentration high temperature relatively low pressure relatively low volume ( 1 Mtpa) Post-combustion capture: low grade heat available no impact on product or process 23

24 Global steel production Source: 24

25 Iron and steel production: major processes 25
26 Blast furnace: main reactions Source: chemwiki.ucdavis.edu/inorganic_chemistry/descriptive_chemistry/transition_metals_and_coordination_complexes/metallurgy 26
 International Journal of Greenhouse Gas Control, 19: 145-159")
27 Iron and steel production: full plant Adapted from: Ho, Bustamante, Wiley, Comparison of CO 2 capture economics for iron and steel mills (2013) International Journal of Greenhouse Gas Control, 19:
28 Challenges of CO 2 capture for iron and steel CO 2 emissions: many distributed locations o low to very low volumes ( 1 Mtpa) major emission at power plant o moderate temperature o low pressure and concentration Nature of steel mills: highly integrated and optimized New processes: blast furnace top-gas recycling increase CO 2 concentration affect heat integration 28
29 Global ammonia production Mtpa North America South America Europe Middle East + Africa Asia Pacific Source: 29

30 Ammonia production 30
31 Challenges of CO 2 capture for ammonia production CO2 production and usage: CO 2 separated as pure point source 0.88 tonne CO 2 used per tonne urea CO2 emissions: 1.5 to 3.1 tonne CO 2 per tonne ammonia low temperature high pressure relatively low volume ( 1 Mtpa) 31
32 Summary: CO 2 concentration in emission gases Source type CO 2 concentration in waste gas (% of dry volume) Pressure of gas stream (kpa) Partial pressure of CO 2 (kpa) Iron blast furnace Up to before, 100 after combustion before, 27 after Cement Kilns Ammonia production Oil refinery heaters Natural gas processing Adapted from: IPCC (2005), Special Report on carbon dioxide capture and storage 32
33 CO 2 capture effort Percent CO2 in flue gas Electricity (gas) Required CO 2 concentration for storage Oil refining CAPTURE EFFORT Electricity (coal) Iron and Steel Industrial Process Cement Gas production Source: IPCC (2005), Special Report on carbon dioxide capture and storage 33
34 Government, Industry and Research Partners