How to Use Your Existing SCADA for Energy Management. Don Best, HDR Engineering, Inc.
|
|
|
- Nickolas Reynolds
- 5 years ago
- Views:
Transcription

1 How to Use Your Existing SCADA for Energy Management Don Best, HDR Engineering, Inc.

2 Presentation Outline Energy Management Connect a Power Meter to SCADA Understand Your Electric Bill Energy Benchmark Studies SCADA for Energy Conservation
3 Energy Management Process of monitoring, controlling, and conserving energy: Metering your energy use and collecting the data Finding opportunities to save energy Energy Conservation Measures (ECM s) Perform an Energy Audit Taking action to target the opportunities Start with the energy hogs Tracking your progress
4 Energy Management Benefits of using SCADA for Energy Management: Tracking and trending Baseline energy use calculations Information accessible to operators
5 Energy Management Energy Costs are a large portion of the O&M costs of a typical WWTP facility: Staffing 46% Energy 28% Solids 12% Others 07% Chemicals 04% Maintenance 03%

6 Power Monitoring Digital Power Meter (Eaton IQ Analyzer)
7 Power Monitoring Digital Power Meter Parameters: Line Currents L-L and L-N Voltages Power (Watts) Energy Use (Watt-hours) VA and VARs Power Factor Demand (Watts, VA, VARs, Currents) Frequency (Hz) Total Harmonic Distortion (%THD)
8 Power Monitoring Power Meter to PLC/SCADA: Analog Signals (4-20ma) Pulsed Output Signal (one pulse per kwh) Digital Communications: Serial: Modbus, Profibus, DeviceNet Ethernet: Modbus TCP/IP, Ethernet/IP
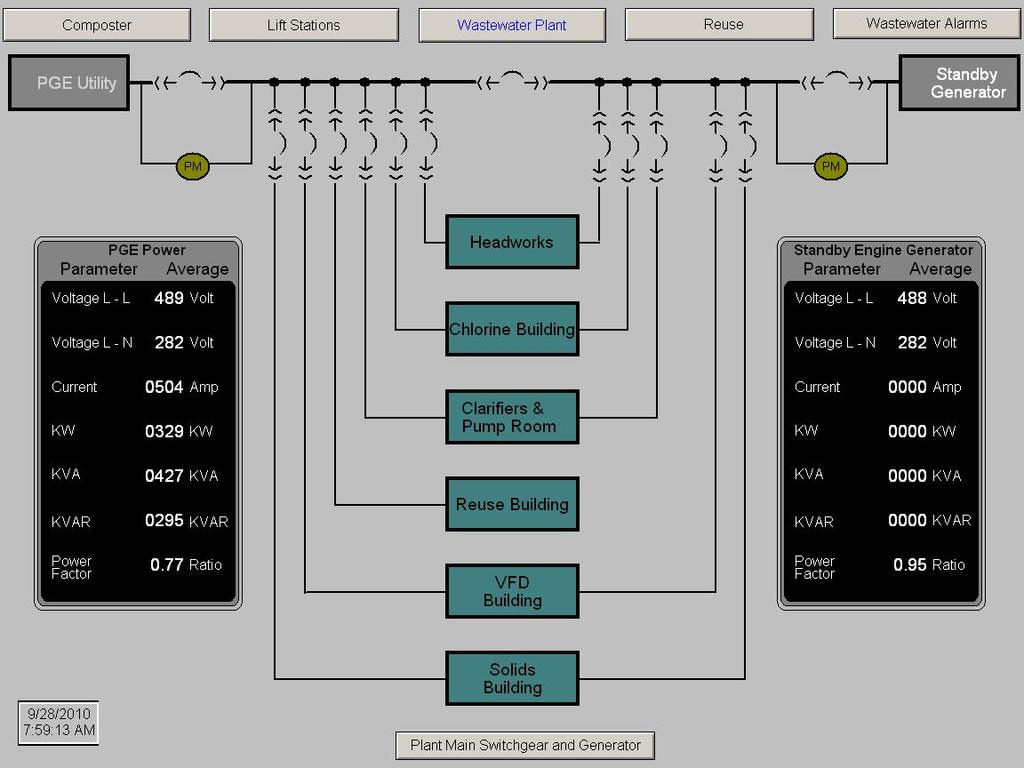
9 Power Monitoring
10 Power Monitoring kw 7-Day Period
11 Power Monitoring Calculate daily, weekly, monthly energy use Calculate Unit Energy Consumption kwh/mg Energy used per million gallons of wastewater treated.
12 Electric Costs Electric Utility Bill: Energy Use Charges (kwh) Demand Charges (kw) Transmission (monthly demand) Distribution (monthly demand) Distribution Facilities Capacity (facility demand)
13 Electric Costs Portland General Electric: Monthly Demand: Is based on the highest power requirement, averaged over any half-hour period during the billing cycle, measured in kw. Facility Capacity: The average of the two highest monthly demand kw for the last 12 months.

14 Electric Costs City of Newberg, OR WWTP Oxidation Ditch-Type, Activated Sludge (1987) Capacity: 4 MGD dry / 20 MGD peak April 2010 Data: Total kwh: 316,604 Total Flow: 131 MG 2,417 kwh/mg (Unit Energy Consumption)
15 Electric Costs City of Newberg, OR WWTP April 2010 Portland General Electric Bill Energy Use (kwh): $20,145 Transmission Charge: $506 Distribution Charge: $1,426 Distribution Facility Charge: $1,580 Others: $1,740 Total Charges: $25,397 }Demand Charges (14%)


16 Energy Benchmark Studies Compare your plant to energy benchmark studies:
17 Energy Benchmark Studies Each wastewater plant is different: Plant flow/loading requirements Treatment level requirements Type of treatment Trickling Filter, Oxidation Ditch Type of process equipment UV Disinfection, Hypochlorite Generators Size of plant (economy of scale)
18 Energy Benchmark Studies National Average Energy Use by Treatment Type Treatment Type kwh/mg Trickling Filter 950 Activated Sludge 1,300 Advanced Treatment 1,500 Advanced Treatment with Nitrification 1,900 Oxidation Ditch 2,900

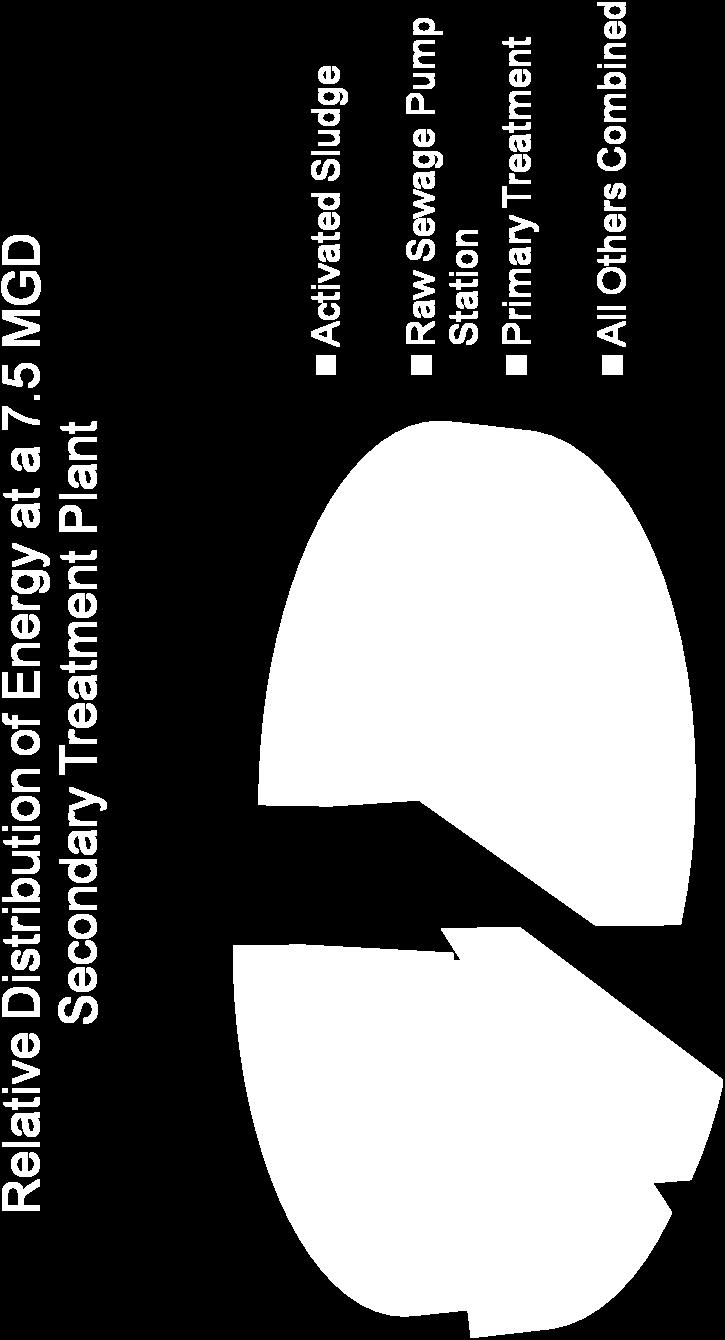
19 PG&E Study of 13 WWTP s in CA Energy Benchmark Studies Ave Energy Use: 2,243 kwh/mg Ave kwh/mg 45% of Energy Use for Secondary Treatment Process Wastewater Treatment Plants

20 Energy Benchmark Studies

21 Automated DO Controls: SCADA for Energy Conservation

22 SCADA for Energy Conservation Automated Controls for VFD s: PID Loop Control: Flow, Level, Pressure Monitor Motor Currents: or Power to motor
 Offers Better Diagnostic")
23 SCADA for Energy Conservation Motor Starter with Smart Overloads : Provides Motor Current Data Located in MCC Networked (DeviceNet) Offers Better Diagnostic Information
24 SCADA for Energy Conservation Manage Motor Inrush Currents (Demand): Large Motor Loads: Stagger Start Pump Rotation: Stop a pump before starting another.

25 SCADA for Energy Conservation Monitor Lift Station Operations: Daily Pump Start Counts Daily Pump Run Times Average Run Time per Start Look for Signs of Clogging or Faulty Pumps

26 SCADA for Energy Conservation Fine Tune Pump Controls to Improve Efficiency: Look for conditions where two pumps are running together at low speeds. Give priority to your most energy efficient pumps.
27 SCADA for Energy Conservation Automate the Plant Water System: Many systems are still manually controlled Use local Booster Pumps where high pressure is needed Use solenoid valves for chemical dilution water Monitor Mixing Air Flows: Grit Chamber, Chlorine Contact Basins Anaerobic Digesters: Mixing, Recirculation, and Sludge Heating
28 Power (kw) Alarm Setpoint SCADA for Energy Conservation (ALARM)
29 SCADA for Energy Conservation Can Loads be Shifted to Off-Peak Hours? WAS or Sludge Transfer Pumps Hypochlorite Generators Sludge Thickening / Dewatering
30 Summary Use Your SCADA System to Help Plant Staff: Monitor Energy Use See Results of Energy Conservation Measures Look for Faulty/Abnormal Conditions Optimize the Process Controls Run a More Efficient Plant

31 Thank You! For more information contact Don Best HDR Engineering DRIVE SAFE!!