City of Port Orford Water Supply Expansion. Phase I Distribution System Phase II Hubbard Creek Impoundment
|
|
|
- Michael Davidson
- 5 years ago
- Views:
Transcription


1 City of Port Orford Water Supply Expansion Phase I Distribution System Phase II Hubbard Creek Impoundment
2 City of Port Orford Water Supply Expansion Presented by: City of Port Orford SHN Consulting Engineers & Geologists, Inc.
3 Water Supply Expansion Project Acknowledgements: Oregon Infrastructure Finance Authority (Community Development Block Grant). Technical Assistance Grant Oregon Water Resources Department USDA Rural Utilities Services TA Grant Rural Community Assistance Corporation City of Port Orford City Council
 North Fork Reservoir Garrison Lake Do Nothing Water Loss (Yr 2000 @ 22%) Water")
4 Water Supply Status 2005 Water Master Plan Shortage of Raw Water Supply Alternatives to Expand Source N. Fork Reservoir Expansion New (additional) North Fork Reservoir Garrison Lake Do Nothing Water Loss (Yr 22%) Water Loss (Yr 57%)
5 Opinion of Probable Cost Phase 1--Distribution System $ 13,145,000 Phase 2--Reservoir $ 3,829,000 Application in to USDA RUS for ARRA Funding for $ 14,000,000 * Based on Preliminary Engineering Report

6 Distribution Phase 1

7 Phase I Water Distribution System Improvements
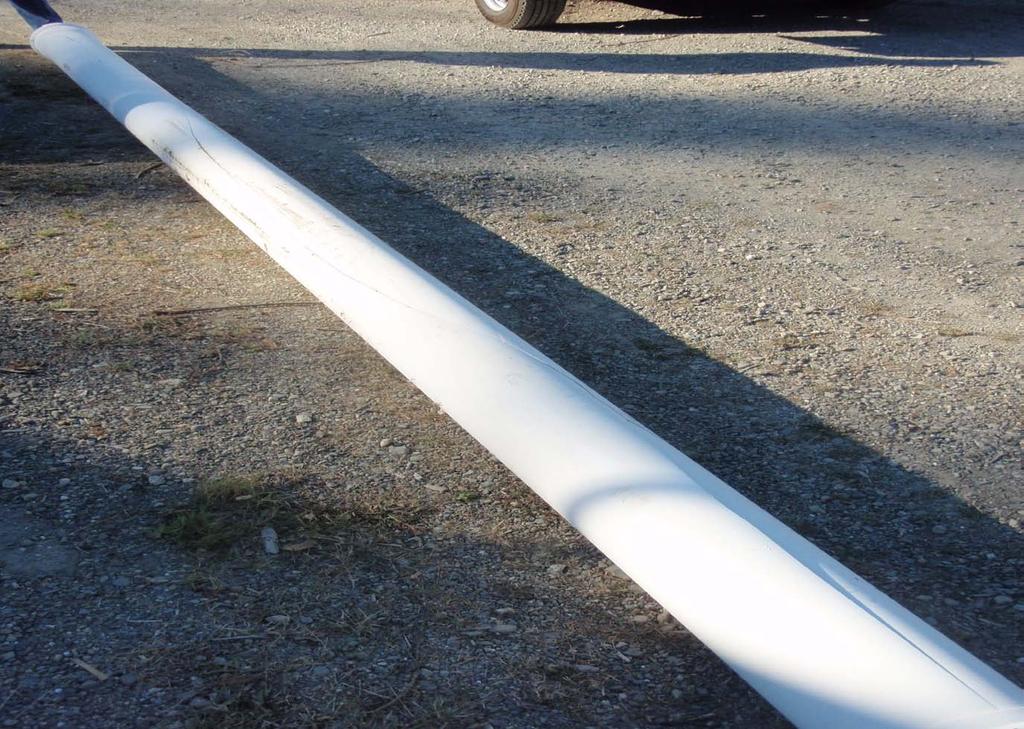
8 Water distribution system leaks
 is from 1926 Most was installed in the 1950s and")
9 Distribution system piping System consists of 15 miles of water lines 12 miles of Asbestos Cement pipe 3 miles a mix of PVC and other pipe Oldest located (so far) is from 1926 Most was installed in the 1950s and 1960s
10 Distribution system pump stations 6 pump stations, necessary due to terrain Portions of system less than 20 psi No capacity to allow additional connections to some of the pump stations No fire flow in higher elevation areas Age of pump stations causing maintenance problems (parts availability, reliability etc.)
11

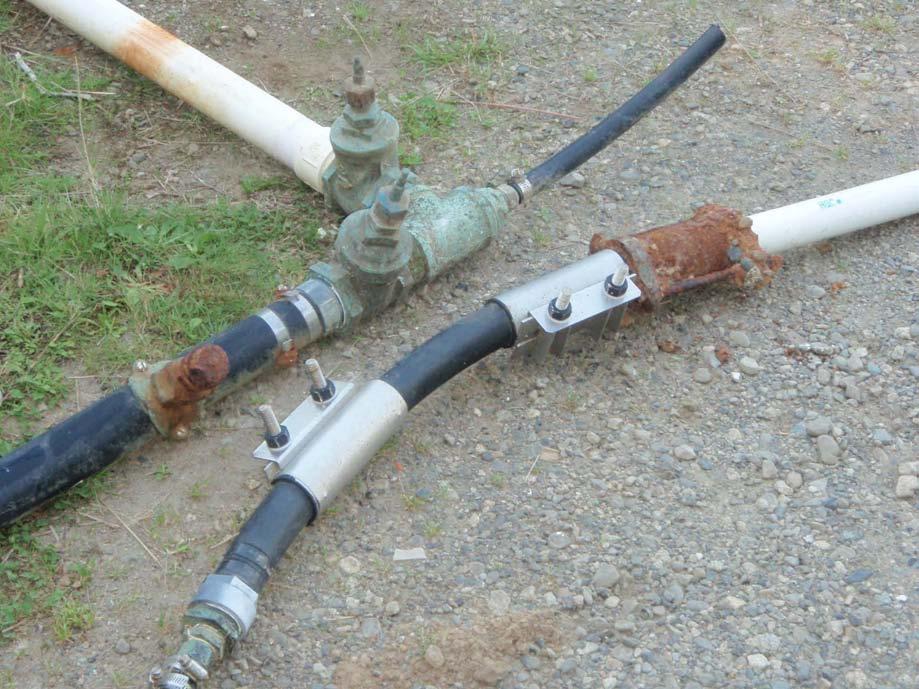
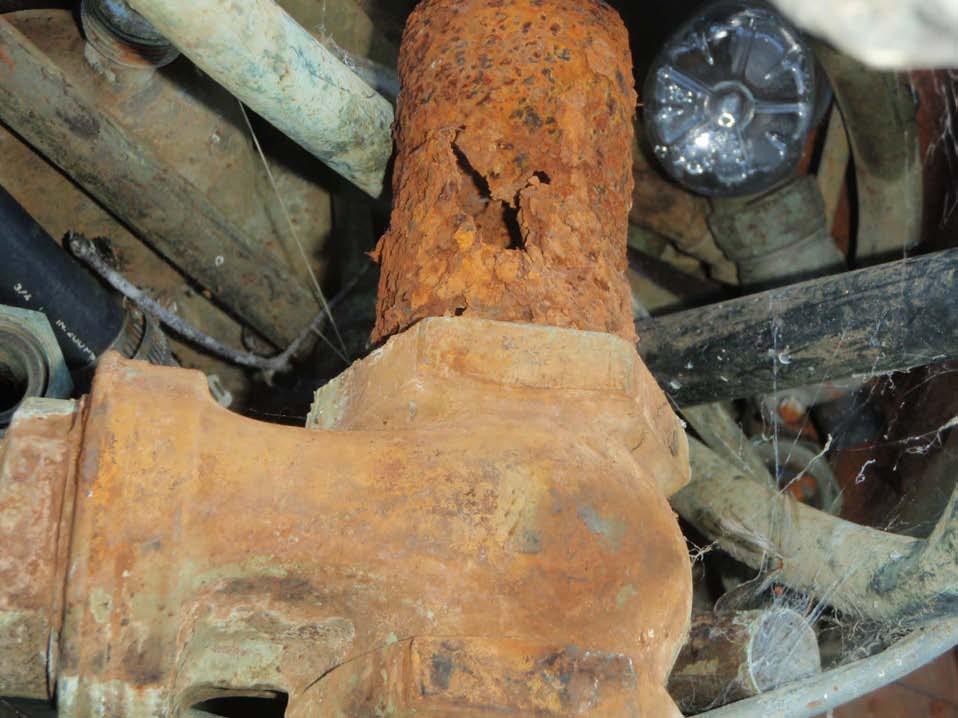
12 Types of System Failures
13
14
15 Phase 2 Reservoir Expansion
 North Fork Reservoir Garrison Lake Do Nothing Water Loss (Yr 2009 52% - Yr 2010 @ 57%) Less Than")
16 Water Supply Status 2010 Situation Critical Shortage of Raw Water Supply Alternatives to Expand Source N. Fork Reservoir Expansion New (additional) North Fork Reservoir Garrison Lake Do Nothing Water Loss (Yr % - Yr 57%) Less Than Average Year Requires Conservation

17 N. Fork Hubbard Creek Reservoir

18 N. Fork Hubbard Creek Reservoir
19 2010 Situation Water Supply Status Critical Shortage of Raw Water Supply Distribution System is Failing Continue Leak Detection and Repair Water Loss (Yr 57%) PER/EA Evaluation of Expanding Source Replacing Distribution System Expansion of N. Fork Reservoir Funding Applications
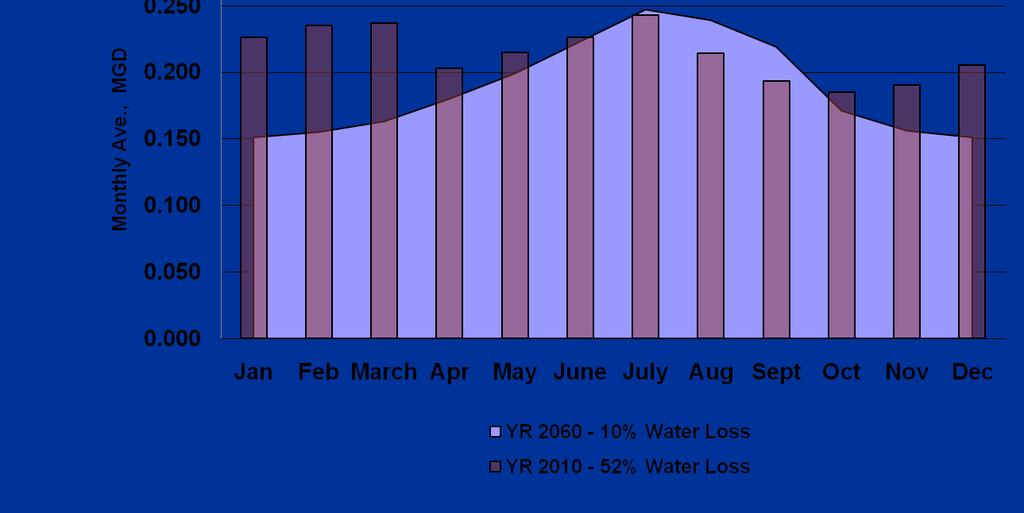


20 Water Consumption Practices

 38 foot Dam Height Release Minimum Stream")
21 Recommendations Reduce Water Losses to Less than 10% Replace Distribution System Implement Conservation During Drought (15% Reduction in Water Usage) Expand Existing Impoundment 59 acre-feet (19.4 Million Gallons) 38 foot Dam Height Release Minimum Stream Flow cfs

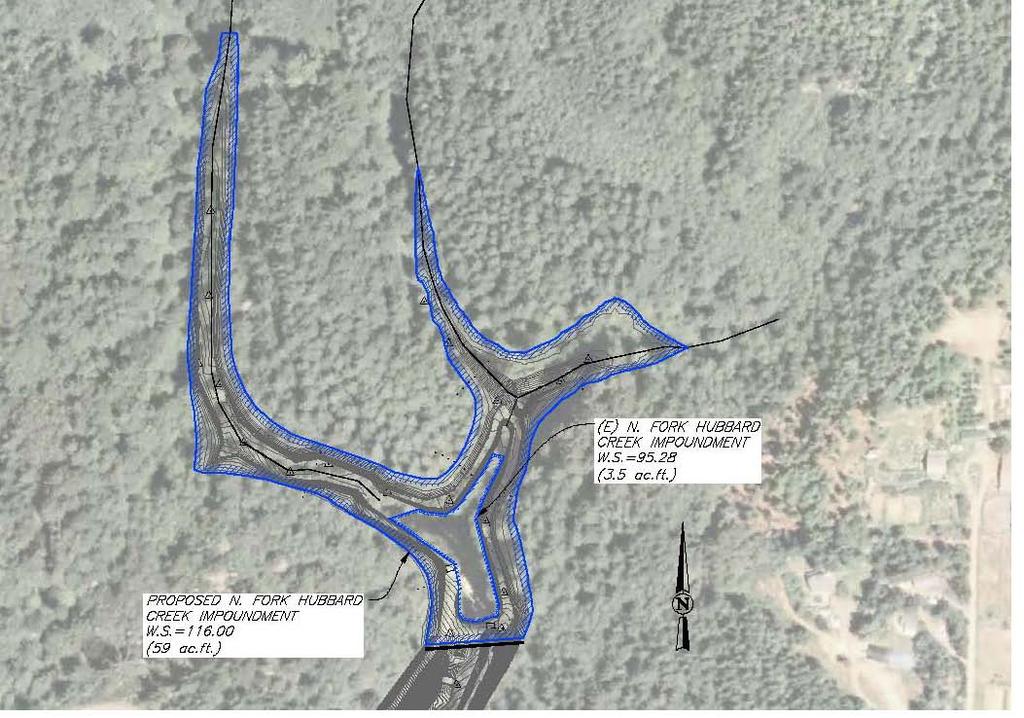
22 Phase II Expanded Reservoir

23 Proposed Earthen Dam
24 Section of Proposed Dam & Intake
25 Section of Proposed Dam and Primary Spillway


26 Current Water Rates 2010 Base rate, incl. first 2000 gallons $ gallons $ gallons $ gallons $ gallons $10.49
27 Water bill calculation Usage 4400 gallons Base rate $ /M $15.58 Total bill this customer $42.66
 $26.")
28 Wastewater Rates Base Rate (no gallons included) $37.08 Usage rate per thousand gallons $6.13 Wastewater Bill Calculation Usage 4400 gallons Base Rate $37.08 Usage (at $6.13/thousand gallons) $26.97 Total for this customer $64.05

29 Average Customer water and waste water bill Average customer 4400 gallons of water/wastewater per month. Water Bill $42.66 Wastewater Bill $64.05 Total bill for average customer $106.71
30 Water system operating budget Personal Services $183,760 Materials and Services(O & M) $109,631 Annual debt service $72,450 Total Costs to operate water system $365,841 FY2010 revenue (charge for water) $342,368 Net loss for FY2010 <23,480>


31 Water system total usage 667 utility accounts Average use per account 4400 gallons/ month Average amount of water sold/month 2,488, total data Total water treated for the year 67,493,004 Total water sold for the year 29,865,768

32 Total water fund revenue 667 $27.08 $216, gallons X 6.49/M X 667 $124,702 Total revenue generated $341,450
33 Water system (only) debt Water system debt principal $348,495 Water system debt interest $67, 529 Debt total for water only $416,024
34 Distribution system (phase 1) funding package Grant funds CDBG $1.895 M USDA $1.250 M Loan funds SDW $6.0 M USDA $4.0 M Total package $ M
35 Payment and interest calculations $4,000,000 loan amount, 3.5% interest, 40 years $6,000,000 loan amount, 1% interest, 30 years Rate based payback Payment is 419, per year, or approximately $52.45 per customer per month. Total water (only) bill for this scenario is $94.45 Property Tax based payback General Obligation, 100,000,000 assessed value $ per thousand of assessed value
36 Payment based on $6M General Obligation bond and $4M Revenue Bond General Obligation bond $ per thousand of assessed value. Revenue Bond requires rate increase of $23.40 per month per customer.
37 COUNCIL DECISION REQUIRED: If the vote for either the general obligation bond fails, or the revenue bond fails, the project cannot be completed. Both MUST pass in order for the funding package to be viable.
38 This ends the presentation