INDIAN POWER SECTOR ROAD MAP NEW DELHI
|
|
|
- Harvey Randall
- 5 years ago
- Views:
Transcription
1 INDIAN POWER SECTOR ROAD MAP NEW DELHI
2 GROWTH SO FAR
 NUCLEAR 5,780.0 2% NUCLEAR 3,900.")

3 (FIGURES IN MW) GROWTH OF ALL INDIA INSTALLED CAPACITY(CATEGORY WISE) INSTALLED CAPACITY (AT END OF March 2007 INSTALLED CAPACITY (AT END OF SEP,2016) NUCLEAR 5, % NUCLEAR 3, % THERMAL 86, % THERMAL 213, % HYDRO 43, % HYDRO 34, % TOTAL 1,32, MW THERMAL NUCLEAR RES 7, % HYDRO RES RES 44, % TOTAL 3,06,358 MW THERMAL NUCLEAR HYDRO RES
![(FIGURES IN MW) GROWTH OF ALL INDIA INSTALLED CAPACITY(SECTOR WISE) INSTALLED CAPACITY (AT END OF March 2007) INSTALLED CAPACITY (AT END OF SEPTEMBER,2016) [CATEGORY NAME][VAL UE]](/docs-images/86/94177490/images/4-1.jpg "[PERCENTA GE] CENTRAL 76,312.26 25% CENTRAL 42,037 32% STATE 73,579 55% PRIVATE 16,713 13% TOTAL 1,32,329.84 MW STATE PRIVATE CENTRAL PRIVATE 127,956.")
4 (FIGURES IN MW) GROWTH OF ALL INDIA INSTALLED CAPACITY(SECTOR WISE) INSTALLED CAPACITY (AT END OF March 2007) INSTALLED CAPACITY (AT END OF SEPTEMBER,2016) [CATEGORY NAME][VAL UE] [PERCENTA GE] CENTRAL 76, % CENTRAL 42,037 32% STATE 73,579 55% PRIVATE 16,713 13% TOTAL 1,32, MW STATE PRIVATE CENTRAL PRIVATE 127, % TOTAL 3,06,358 MW STATE PRIVATE CENTRAL
5 PLANWISE ALL INDIA CONVENTIONAL CAPACITY ADDITION TARGET VS ACHIEVEMENT 120,000 [VALUE] 100,000 88,537 MW 80,000 [VALUE]* 54,964 60,000 40,000 20,000 41,110 40,245 19,119 21, TH PLAN 10TH PLAN TARGET 11TH PLAN 12TH PLAN ACHIEVED *AS PER MID TERM APPRAISAL (FIGURES IN MW)
6 760, , , , , , ,477 1,000, , ,320 GROWTH OF ALL- INDIA CATEGORY WISE ACTUAL GENERATION 500, ,341 37, ,244 36, ,848 34, ,720 32, , , ,000 32, , , ,000 26,266 MWh 600, THERMAL NUCLEAR HYDRO (FIGURES IN MWh)
 ALL FIGURES in MW Wind 26,866.")

7 INSTALLED CAPACITY OF RES (as on ) ALL FIGURES in MW Wind 26, % Total : 42,849 MW Solar 6, % Bio-Power 4, % SHP 4, % 7
8 10,000 5, SHP WIND BIOMASS U&I SOLAR , , , , , , , , , , , , , ,000 4, , , , , , ,000 24, ,000 3, , , , ,000 3, ,000 12, ,000 2, , MW GROWTH OF ALL INDIA INSTALLED CAPACITY OF RES (CATEGORY WISE) TOTAL (FIGURES IN MW)
9 ALL INDIA THERMAL PLF (%) (%) * PROVISIONAL
10 ALL INDIA ANNUAL PER CAPITA CONSUMPTION OF ELECTRICITY 16.3 in 1947
11
12 th 12 Plan Achievements
 FIGURES in MW 12TH PLAN TARGET Coal")


13 CONVENTIONAL CAPACITY ADDITION (Type wise) FIGURES in MW 12TH PLAN TARGET Coal 69,800 79% Coal 87,540 86% LIKELY CAPACITY ADDITION Gas 2,540 3% Nuclear 5,300 6% TOTAL 88,537 MW Hydro 10,897 12% Gas 6,080 6% Nuclear 2,500 3% TOTAL 1,01,645.2 MW Hydro 5,525 5%


14 CONVENTIONAL CAPACITY ADDITION (Sector Wise) FIGURES in MW LIKELY 12TH PLAN ACHIEVEMENT 12TH PLAN TARGET State 15,530 17% State 23, % Private 57, % Private 46,825 53% Central 26,182 30% Central 20, % TOTAL: 88,537 MW TOTAL: 101,645 MW 14 (FIGURES IN MW)
![FIGURES in MW 12th Plan Target [CATEGOR Y NAME]](/docs-images/86/94177490/images/15-0.jpg "[VALUE] [PERCENT AGE] TOTAL 30,000 MW 15 [CATEGOR")
![Y NAME] [VALUE] [PERCENT AGE] [CATEGOR Y NAME]](/docs-images/86/94177490/images/15-1.jpg "[VALUE] [PERCENT AGE] Solar 17,823 51% Likely12")

15 FIGURES in MW 12th Plan Target [CATEGOR Y NAME] [VALUE] [PERCENT AGE] TOTAL 30,000 MW 15 [CATEGOR Y NAME] [VALUE] [PERCENT AGE] [CATEGOR Y NAME] [VALUE] [PERCENT AGE] Solar 17,823 51% Likely12 th Plan Achievement Bio-Power and waste power 2,219 7% Small Hydro 1,104 3% TOTAL 34,755 MW Wind 13,609 39%
16 NO OF UNITS NO OF SUPER CRITICAL UNITS (SECTOR WISE) (likely in ) PER UNIT CAPACITY(MW) CENTRAL STATE PRIVATE TOTAL
17 FUTURE SCENARIO ( )
18 ALL INDIA DEMAND PROJECTIONS ( ) YEAR ENERGY REQUIREMENT (BU) PEAK DEMAND (GW) REDUCTION DUE TO DSM ENERGY REQUIREMENT (BU) PEAK DEMAND (GW) 137(7.83%) 9(3.68%) DEMAND AFTER DSM ENERGY REQUIREMENT (BU) PEAK DEMAND (GW)
19 Committed capacity addition Conventional : MW ( Hydro:15330 MW, Gas : 4340 MW, Nuclear:2800 MW) Renewable: MW by 2022 (Solar : MW, Wind: MW, Biomass10000 MW, Small Hydro :5000 MW)

20 RENEWABLE ENERGY TARGET BY 2022 (175 GW) Biomass; 10; 6% Small hydro; 5; 3% Wind; 60; 34% Solar; 100; 57% (FIGURES IN GW)
21 LIKELY ALL INDIA CAPACITY ADDITION AND PLF OF THERMAL PLANTS ( ) Scenario (RES IC by 2022) Committed Hydro (MW) Committed Nuclear (MW) Committed Gas (MW) Additional Coal Based Capacity Required (MW) RES Energy Coal Based Contribution PLF of Coal Generation( (GWh)in Total Based Gross) Energy Plants (%) requirement (GWh) +++ ** 60.3* 327 (20.3%) (47.9) GW (17.7%) (50.4) GW (15.2%) (52.8) PLF has been computed based on the requirement of nil capacity addition from coal based power plants. Since a coal based capacity of 50,025 MW is under construction and likely to yield benefits during ,figures in bracket indicate PLF% including 50,025 MW. 175GW assuming Auxiliary Power consumption of coal stations as 6.5% ** Includes Solar, Wind, Bio mass and Small Hydro Generation
22 LIKELY CAPACITY ADDITION (MW) DURING THE YEARS ,330 HYDRO THERMAL COAL GAS TOTAL NUCLEAR RENEWABLES TOTAL 50,025 4,340 54,365 2,

23 LIKELY INSTALLED CAPACITY BY END OF TOTAL 5,23,389 MW Renewables 175,000 33% Coal 248,513 48% Nuclear 10,080 2% Hydro 59,828 11% 23 Gas 29,968 6% Including 50,025 MW of Coal based capacity addition currently under construction ALL FIGURES in MW
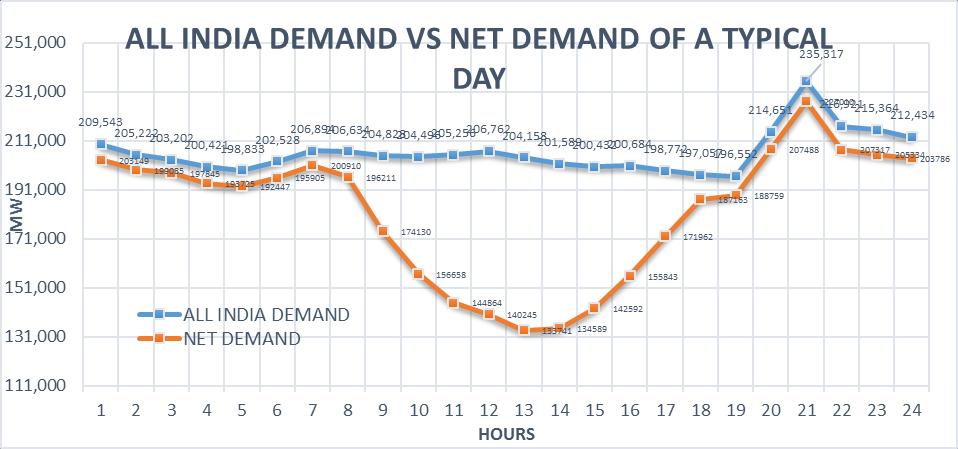
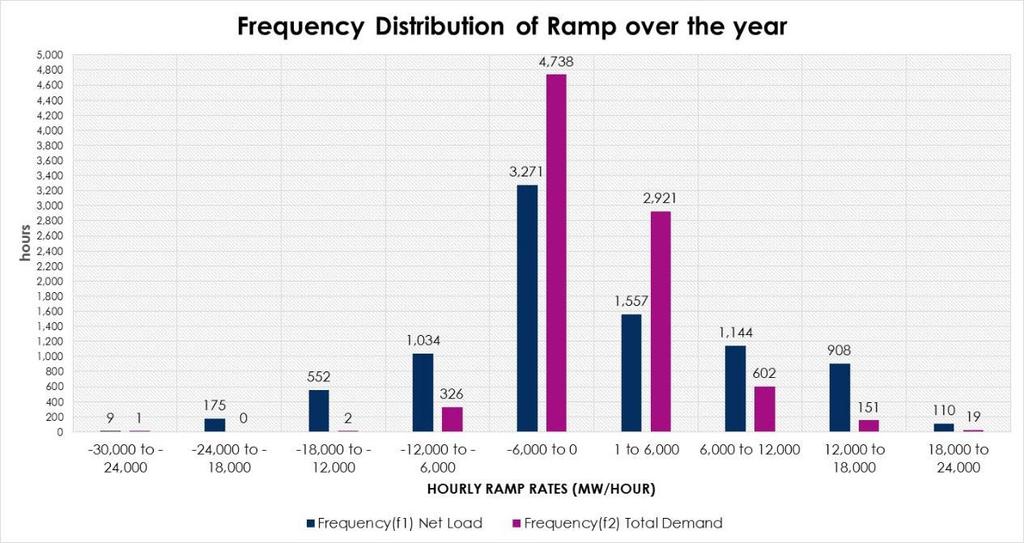
24 Challenges in Integration of Renewables
25 Low Wind Months 80,000 70,000 60,000 50,000 40,000 30,000 20,000 10,000 0 MW MW High Wind Months Hours Wind Solar 80,000 70,000 60,000 50,000 40,000 30,000 20,000 10, Hours Wind Solar 25
26
27
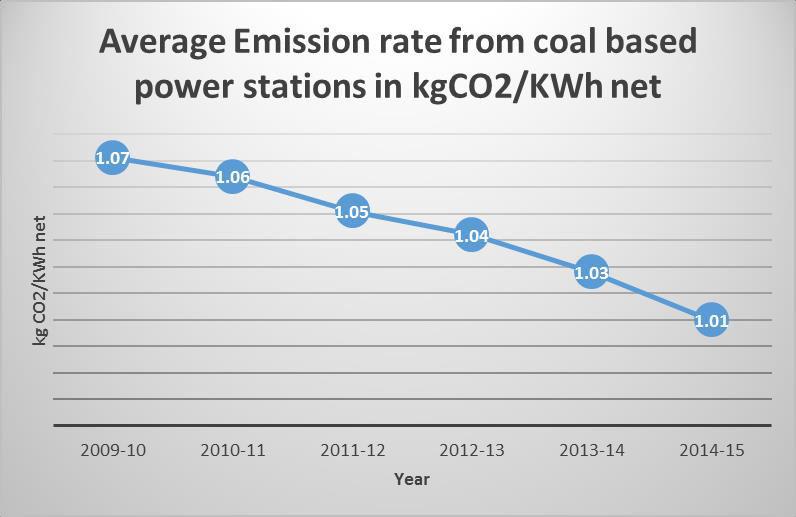
28 YEAR Projected Total Carbon Emissions# (Million Tones) Emission Rate* (KgCO2/kWh) * Including RES Generation. # Estimated 28
29 India s Intended Nationally Determined Contribution (INDC) To reduce the emissions intensity of its GDP by 33% to 35 % by 2030 from 2005 level. YEAR Emission intensity from grid connected power stations (kgco2/rs GDP) Reduction in Emission Intensity (Base 2005) Note: The percentage may change depending on actual capacity addition and retirements %
30 India s Intended Nationally Determined Contribution (INDC) 40 % cumulative power installed capacity from non-fossil fuels by Year March,2016 March,2022 (likely) Installed Capacity(IC) (GW) IC of Fossil Fuel (GW) IC of Non-Fossil Fuel (GW) % of Non-Fossil Fuel in IC % 46.8% Note : 1. Non-Fossil fuels includes Hydro, Nuclear and RES sources. 2. The percentage share may change depending on actual capacity addition and retirements. 3. Includes 50,025 MW of Coal based capacity addition currently under construction and likely to yield benefits during
31 THANK YOU