The State of Energy and Power Generation/ Consumption in China
|
|
|
- Constance Hawkins
- 5 years ago
- Views:
Transcription


1 UNIVERSITY OF PITTSBURGH The State of Energy and Power Generation/ Consumption in China Minking K. Chyu Leighton and Mary Orr Chair Professor and Chairman Department of Mechanical Engineering and Materials Science University of Pittsburgh

2 Energy Quality of Life
; but energy/capita is low (1/6 of US); inefficient system World s largest oil importer (will past US Oct. 2013, 6.")
3 Some Energy Related Facts of China World s most populated country with a rapid economic growth since 1980 s. World s largest energy consumer (~18%); but energy/capita is low (1/6 of US); inefficient system World s largest oil importer (will past US Oct. 2013, 6.3MBarrel/day), was an oil exporter in 1970 and 1980 s World s largest producer and consumer of coal, #3 in reserve; but still import coal World s largest greenhouse gas emitter World s largest producers of rare earth materials Heavy energy user costal area producer - inland special economic zone

4 1983 Data Coal North Oil & Gas West Hydro no 3-gorge Thermal north Nuke not at all


")
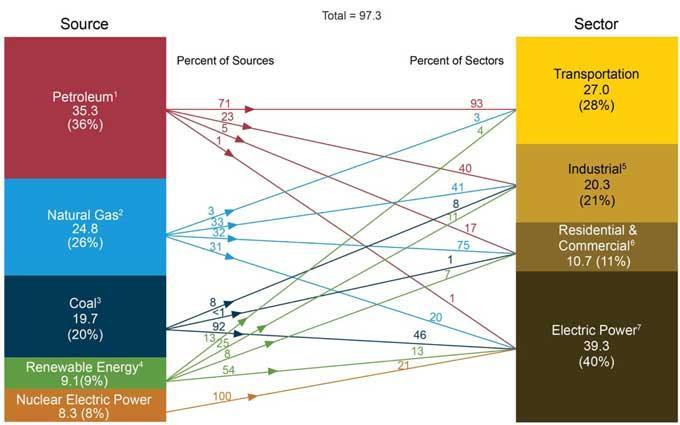
5 U.S. Energy Consumption Renewable BY SOURCE BY SECTOR Nuclear Coal 23% 8% 7% Natural Gas 23% Oil 39% Transportation 28% Industrial 31% Residential 22% Commercial 19% Sources: U.S. Energy Information Administration (EIA) 2007; EIA Annual Energy Review 2008
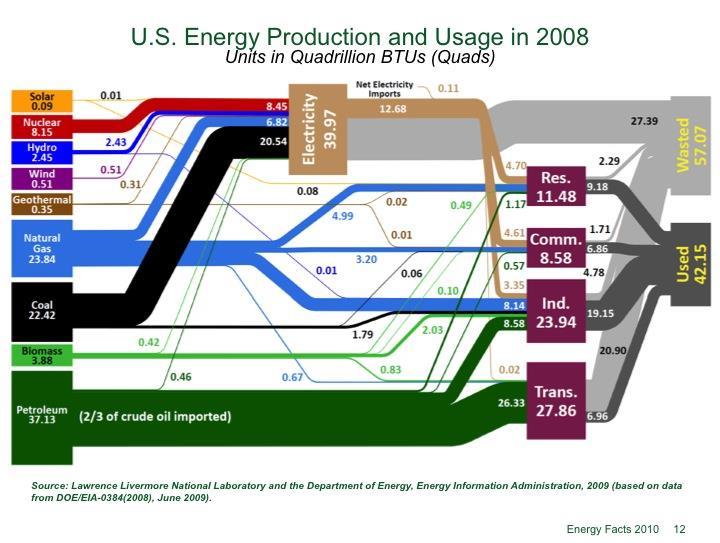
6 Energy Consumption in U.S. US 2011 Data

7 Kilowatt-hours of Generation US Electric Power Generation by Fuel Types 2,500 x 10^9 kwh information is U.S. kwh generation by fuel type source: AEO 2001, Table A.8 renewable and hydro, Table A.17 Coal 2,000 x 10^9 kwh 1,500 x 10^9 kwh Natural Gas 1,000 x 10^9 kwh Nuclear Power 500 x 10^9 kwh Conventional Hydropower Petroleum Other Renewables 0 x 10^9 kwh year


8 Energy Demand Today Energy Demand QBtu / Year 85% Fossil Energy United States 131 QBtu / Year 86% Fossil Energy Coal 26% Oil 39% Gas 21% Nuclear 7% Renewables 7% 475 QBtu / Year 80% Fossil Energy 725 QBtu / Year 81% Fossil Energy World World Coal 26% Oil 32% Gas 23% Nuclear 5% Renewables 14% Fossil Fuels Continue to Provide Primary Supply U.S. data from EIA, Annual Energy Outlook 2007, years 2006 and 2030; world data from IEA, World Energy Outlook 2006, years 2004 and 2030
9 Total Energy Perspectives The world will need about 10~20 tetra (10 12 ) watthours electricity per year in the next 20 yrs. Fossil energy, i.e. oil, coal, natural gas,, dominates, which emits CO 2. CO 2 free power generation: Nuclear (~20% projected) Renewable (~10% projected) : wind, hydro, solar, Unrealistic and virtually impossible to rely solely on nuclear and renewable energy.


10 The dirtiest and cheapest fossil fuel of vast reserves Carbon Ash (rock) Sulfur Nitrogen Hydrogen Mercury Water Clean-up technologies for Mercury, Sulfur Oxides, SOx Nitrogen Oxides, Nox are well established Control of carbon dixoides, CO2, as a greenhouse gas is problematic & challenging

11 Conventional Coal Plant C + O 2 = CO 2 14 MW 41 % Efficiency 86 MW 100 MW 41 MW 45 MW


12 Gas Turbine For electric power generation, Fuel is Natural Gas, mainly Methane, CH 4 Exhaust: CH 4 + 2O 2 = 2H 2 O + CO 2 Air contains Oxygen, O 2
13 Gas Turbine Simple Cycle 100 MW 62 MW 38 MW 38% Efficiency

14 Gas Turbine Combined Cycle 22 MW 100 MW 40 MW 62 MW Fuel 19 MW 38 MW 21 MW to condenser = 57 MW, 57% Efficiency! Combined Cycle means gas-turbine combined with steam turbine for higher efficiency!

15 Coal Combustion & Gasification Gasification produces mainly H 2 and CO, both are good fuels General burning coal results in CO 2 and H 2 O

16 100MW Integrated (Coal) Gasification Combined Cycle (IGCC) Net Coal to Power: = 42% Same as Conventional Coal Plant; but expensive to build 17MW 9MW 15MW 79MW 21MW 47MW 49MW 30MW 26 MW
17 Clean Coal Technology Clean & Efficient Coal Based Power Systems that Capture CO 2 Most advanced technological solution is the Integrated Gasification Combined Cycle (IGCC) based electrical power generation plants with CO 2 capture and sequestration (CCS)
18 IGCC: Integrated Gasification Combined Cycle Also known as Hydrogen Turbine Power System If CO 2 is completely capture and sequestrated before combustion in turbine, emission will only be steam pollution free! Coal gas burned here For a conventional coal plant retrofitted for CO2 sequestration, the Carbon capture occurs after combustion Combined with steam turbine for higher efficiency

, 1/3 of nitrogen oxides (NO x ), and 1/2 of")

19 Coal vs. Natural Gas Worldwide electricity generation, ~40% from coal, 21% from natural gas Natural gas is much cleaner than coal. Natural gas emits virtually no mercury and sulfur oxides (SO x ), 1/3 of nitrogen oxides (NO x ), and 1/2 of carbon dioxides (CO 2 ) than coal. Natural gas today is also cheap, hence many developed countries move coal to natural gas for power generation. Top coal producers are: China, United States, and India. Top natural gas producers are: United States, Russia, Canada and Iran World reserve has 950 billion tons of coal and 850 trillion cubic meters of natural gas huge! 35% of US natural gas is recovered by hydraulic fracturing (fracking)


20 Natural Gas in China Shale Gas Black developed/developing Red - reserved Gas Pipeline Coal-layer Natural Gas Systematic recovery started from late 1990 s, Liquefied LNG, Compressed CNG Has world s largest shale gas reserve, similar to the level of the U.S. Gas reserve is deeper, m; region lacks water resources; recovery is challenging Most reserve is in the west, transportation & pipeline - 西气东输, 川气东送


21 Nuclear Energy Consumption U.S. vs. China Renewable Coal 23% 8% 7% Oil 39% Natural Gas 23% China s Energy Profolio: Coal dominant Natural Gas very low Nuclear is insignificant Sources: U.S. Energy Information Administration (EIA) 2007; EIA Annual Energy Review 2008
22 Global Carbon Emissions (million metric tons carbon) CO 2 Concentration (ppm-vol) Fossil Power Generation Carbon Emission
23 CO 2 Production Source Process Emissions (MtCO2/yr) Percentage Fossil Fuel Power Generation 8, % Autoproducers % Other Energy Sources 1, % Manufacturing and Construction 4, % Transportation 5, % Road 4, % Other Sources 3, % Residential 1, % Biomass Bioethanol and Bioenergy % Total 23, %

24 Timescales of Greenhouse Gases CO 2 Effects can be long lasting!
25 World CO 2 Annual Emissions CO 2 Emissions 2007 CO 2 Emissions 2030 India + non-oecd Asia 10.2% Middle East Africa Central/South America 12.5% United States 21.0% 6.9% India + non-oecd Asia 12.4% Middle East Africa Central/South America 13.6% United States 18.5% 6.8% China* 19.4% * - IEA estimates China has surpassed the U.S. in billion metric tons/year OECD (minus U.S.) + non-oecd Europe and Eurasia 36.9% World China 26.2% 42.9 billion metric tons/year Developing Countries Have Significant Share of Emissions Growth OECD (minus U.S.) + non-oecd Europe and Eurasia 29.3% EIA, International Energy Outlook 2007

26 What Does This Mean? 1 million metric tons of CO 2 Every year would fill a volume of 32 million cubic feet Close to the volume of the Empire State Building U.S. & China each emits roughly 6 billion tons (gigatons) of CO 2 per year Enough to fill Lake Erie with liquid CO 2 almost twice Under an EIA reference case scenario, cumulative CO 2 emissions are expected to be 1 trillion tons

27 CO 2 Geological Sequestration

28 CO 2 Ocean Sequestration ICCP, 2003


 Sink Type Low High Oil and Gas Fields 140 140 Saline Formations")
29 Geologic Sink Capacity Estimates Adequate Storage Projected U.S. emissions ~ 6 Gt CO 2 / yr, all sources 4,674 stationary sources identified Oil and Gas Fields Saline Formations Estimated North American CO 2 Storage Potential (billion tons) Sink Type Low High Oil and Gas Fields Saline Formations 3,300 12,600 Unmineable Coal Seams Unmineable Coal Seams Hundreds of years storage potential! DOE/Fossil Energy/NETL, Carbon Sequestration Atlas of the United States and Canada, November 2008

30 Carbon Capture and Storage (CSS) in China Key Acitivities & Issues Location and adequacy of CO2 storage sites (see map) Technology and IP rights framework for CCS Retrofit low-efficient coal plants for CCS compatility; plant size/age, land/space, water/cooling Development of a regulatory framework for CCS in China International collaboration, mainly with EU and US
 coal plant - $/KW plant construction costs, +30% - $/KW electricity production costs, +40% - Plant net power output, -15% - Plant thermal efficiency, -10% to")
31 CCS s Double-Edged Sword Current Carbon Capture and Sequestration (CCS) technology is costly, e.g. CO2 compression to high pressure, piping to transport, leakage monitoring, etc. Compared to a conventional (pulverized) coal plant - $/KW plant construction costs, +30% - $/KW electricity production costs, +40% - Plant net power output, -15% - Plant thermal efficiency, -10% to -20%, depends on capture method In general, a 600 MW IGCC plant, adding CCS will lose ~100MW. To make up the lost power and efficiency could mean more fuel consumption and accordingly more CO2 emission CSS for natural gas plants is even more difficult and costly, because the concentration of CO2 in flue gas is low
 or Gen 4 technology developments, from 17 to 47 nuke plants, 3X Renewable hydro 40% up, wind 3X, solar")
32 China Near-term Energy Targets ( ) Fossil Retrofit old coal plants, Build/Order higher efficient supercritical plants, Natural gas fired plants, Clean coal technology, IGCC Integrated Gas Combined Cycle + C02 sequestration Nuclear Gen 3 (AP 1000) or Gen 4 technology developments, from 17 to 47 nuke plants, 3X Renewable hydro 40% up, wind 3X, solar 7x

33 Potential Role of Energy Efficiency + Rnewables in Reducing China's Emissions from Coal Even with strong policy incentives for energy efficiency, renewables and other low carbon technologies, coal will remain a major part of China's energy mix until at least 2030: China 2025 Total: 2752 Mtoe China 2002 Total: 1089 Mtoe Renewables in China are mainly hydropower Mtoe = million tons oil equivalent = 4.2 GJ Source: IEA World Energy Outlook 2007

34 Mtoe China Energy Mix Distribution
35 China s Current Efforts to Reduced Coal Usage Focus is on improving energy efficiency and promoting renewables and other alternative technologies Key targets and requirements determined by Chinese Government: target to reduce coal in overall energy mix below 60% requirement that all new large power plants use high efficiency super-critical coal-fired technology expected improvement in coal power generation efficiency from 32% in 2000 to 39% in 2030 target of 70 GW of nuclear power by 2020 (up from 14 GW in 2013) requirement that 10% of total energy should come from renewables by 2020
 45-55% 1100-1400 Twelve units waiting for approval by NRDC Supercritical and ultra")
36 Coal based Power Generation Technology in China Technology Efficiency Cost ($ per kw) Status Subcritical 30-36% Main base of China's current generating fleet Supercritical 41% About half of current new orders Ultra-supercritical 43% Two 1000 MW plants in operation IGCC (precombustion) 45-55% Twelve units waiting for approval by NRDC Supercritical and ultra supercritical plants operated steam (heated by coal) * of Indicates very high current temperature efficiency. Improvements and pressure. are expected Higher in the efficiency future meaning use less coal, and less emission. In average, China builds one new power plant every other week. Current power Generation is based on the least efficient, cheapest technology


37 China s IGCC Plan


38 Nuclear Power Plants in China Data: 17 plants in operation, ~14GW 2020 Projection: 30 plants under construction, all coastal; 35 more plants planned on coastal provinces, total ~ 68GW 24 plants planned inland total ~25GW, mostly delayed Total 89 plants planned construction, ~93GW Jinshan PWR ~600MW


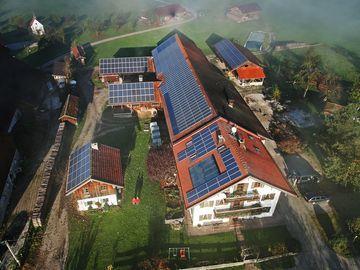


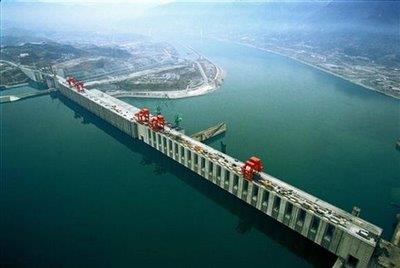

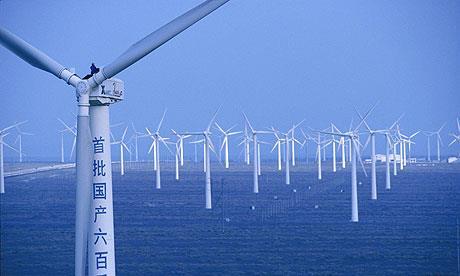

39 Renewable Energy Solar Wind Hydropower Biomass, Biofuels Except hydropower, other renewables are very nominal now, <1%
40 Summary China s energy demand will continue to increase substantially and its dependence on coal and oil remains strong. Usage of natural gas for power generation will still be far below world s average. China faces great technical and political challenges to be more energy efficient and clean, while sustaining economic growth. China s carbon management needs a comprehensive retrofit strategy for aging, low efficient coal based power plants. Nuclear energy and renewable energy (excluding hydro) are subject to heavy investment and grow rapidly; but their combined weightage in China s overall energy portfolio remains insignificant. Huge commercial and technical opportunities exist in these transformational challenges.
41 References CCS Retrofit Analysis of the Globally Installed Coal-Fired Power Plant Fleet, M. Finkernrath J. Smith, and D. Volk, International Energy Agency, 2012 China s Energy Policy BF3-A1B2-2C8C0D47C8CF/21586/Librobiancoenergia2012Cina.pdf
42 Thank You!
43 Prompt In your view, what would be the best way for China to approach its development of power generation technology in order to meet the increased energy demand while keeping the greenhouse gas emission in control? The energy sources for consideration are: (1) fossil fuels, e.g. coal, natural gas, and oil, (2) nuclear energy, and (3) renewable energy, e.g. solar, wind, hydro, geothermal, and biomass.