New opportunities to develop bio-based products related to 2 nd generation ethanol production
|
|
|
- Allan Ferguson
- 5 years ago
- Views:
Transcription
1 New opportunities to develop bio-based products related to 2 nd generation ethanol production Workshop sustainable production of biopolymers and other bio-based products 26/07/2012 ( jpradella@bioetanol.org.br) 1
2 Some history: the sugarcane 2
3 1532: Martim Afonso de Souza introduced sugarcane and built the country's first mill, in the coastal town of São Vicente, in São Paulo State 3
4 4

5 5

6 6
7 1931: The Federal Government issued Law No mandatory purchase of ethanol by gasoline importers; mix up to 5% in gasoline 7
8 Ethanol Production 10 6 Litres The international oil price crisis and ethanol production in Brazil ProAlcool establishment 1st oil crisis 2 nd oil crisis Flexfuel cars Instability crisis Oil Price/Barrel WTI US$ 0 0 Ethanol Production_Brazil Oil Price/Barrel Source: Produced based on P/EIA & UNICA (2009) 8
9 Sugarcane main characteristics 9
10 Sugar and Ethanol Mills location N-NE C-S Sugarcane 15% 85% Ethanol 10% 90% Source: IBGE and Conab (2006) 10

11 11


12 Mechanized sugarcane harvesting (100% up to 2014) 12

13 The sugarcane plant BASE: 01 year (medium values) Fresh biomass : 80 t/ha Bagasse + straw: 20 t/ha 1 ton of fresh sugarcane Straw: 140 kg Fiber: 140 kg Sucrose: 150 kg H2O+salts: 570 kg 13
14 Biomass composition Componentes Composição (%) Celulose 43.4 Hemiceluloses 25.6 Lignin 23.2 Ash 2.9 Extratives 4.8 *Average from more than 50 analysis Sugarcane bagasse Rocha, G. J. M. et al, 2010 Catalytic conversion of biomass to biofuels - D.M. Alonso, J. Q. Bond and J. A. Dumesic (GREEN CHEMISTRY, 2010) 14
 Pith")

15 Fiber (60% w/w) Pith (40% w/w) 15 (Olivares, 2009) 15


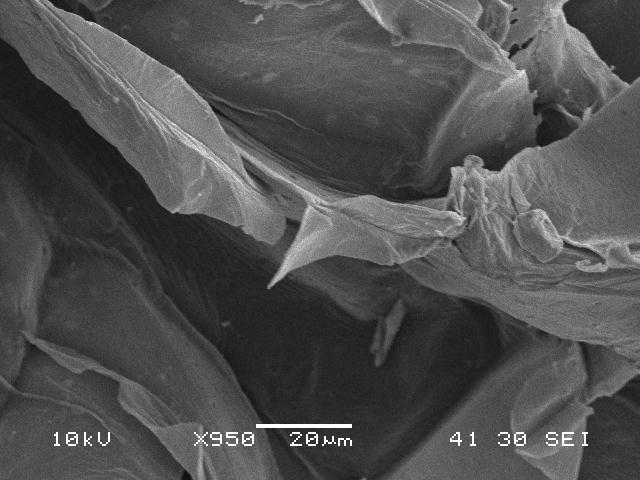

16 Fiber Bagasse MEV Pith 16 16
")
17 AFM images of fiber fraction (Courtesy of Lucia Vieira Santos, UNIVAP, 2012) 17

18 Biomass composition Componentes Composição (%) Celulose 43.4 Hemiceluloses 25.6 Lignin 23.2 Ash 2.9 Extratives 4.8 *Average from more than 50 analysis Sugarcane bagasse Rocha, G. J. M. et al, 2010 Catalytic conversion of biomass to biofuels - D.M. Alonso, J. Q. Bond and J. A. Dumesic (GREEN CHEMISTRY, 2010) 18
19 Hemicellulose fraction 19

20 Block flow diagram - Integrated 1 st and 2 nd generation bioethanol production from sugarcane 20

21 Pentose liquour Xylo-oligomers Xylose Glucose Furfural Hydroxymethylfurfural Acetic acid Phenols 21
22 The C5 Biorefinery High amount of C5 carbohydrates (> t/year) C5 stream valorization Use of low emission technology 22
23 Biological platforms Escherichia coli Corynebacterium Clostridium Lactobacillus Aspergillus rsaccharomyces cerevisiae Candida, Rhodotorula, Yarrovia, Pichia 23
24 Potential products from C5 Biorefinery Biofuels Ethanol Butanol Lipids Isoprenoids 24

25 Potential products from C5 Biorefinery Organic acids Acetic acid Propionic acid Lactic acid Butyric acid 1-4 diacids: Succinic; Fumaric; Malic acid Adipic acid Terephtalic acid?? 25
26 Potential products from C5 Biorefinery Alcohol, ketone and aldehyde Isopropanol Acetone Propanol 1-3 propanediol, 1-4 butanediol Butanol Acetic aldehyde 26
27 AS: ácido succínico 27
28 Some ideas 28
29 Xylose consumption Enzimatic catalysis ex cellula Chemical catalysis (Matsushika, 2009) 29
30 E coli (semi) synthetic anaerobic pathway (Clomburg, 2010) 30
31 Fig. 6. Conversion of glucose/glycerol to 1,3-propanediol by the expression of glycerol-3-phosphatase in organisms already transformed with dhab and dhat. DHAP=DihydroxyAcetone Phosphate, G-3-P=Glycerol 3-phosphate, GA-3-Pglyceral=dehyde 3-phosphate, 3HPA=hydroxypropionaldehyde, 1,3-propanediol, GPP1/2=glycerol-3-phosphatease dha B=glycerol dehydratase, dhat=1,3-propanediol oxidoreductase. ( adapted from Saxena, 2009) 31
32 E coli (semi) synthetic aerobic pathway (Clomburg, 2010) 32
33 (Pradella, 1980) 33
34 E coli synthetic pathway to adipic acid (cited in Pradella, 2008) 34
35 Some economics A case study: ethanol from xylose 35
 M. Sedlak, et al.")
36 Xylose fermentation kinetics re coli P. stipitis YNRRL Y-7124 rs. cerevisiae Prod = 1 g/lh μp = 0.30 h-1 Yp/s = 0.5 g/g Prod = 0.3 g/lh μp = 0.02 h-1 Yp/s = 0.32 g/g Prod = 1.5 g/lh μp = 0.15 h-1 Yp/s = 0.45 g/g Tao et al., (2001) M. Sedlak, et al. (2003) Silva et al. (2009)
37 Inhibition kinetics μ = μ max K S S S I P 1- P max n P: inhibition by product of interest I: inhibition by substance present culture media S: carbon source
38 Simulation of Ethanol production from xylose using E. coli KO11 S-103 P-3 / HX-101 P-5 / HX-102 S-108 S-102 Heating Cooling S-114 S-101 S-112 S-113 P-1 / MX-101 Mixing P-2 / PM-101 Fluid Flow P-4 / FR-101 S-104 S-115 S-116 S-109 Stoich. Fermentation S-106 S-107 S-110 S-117 P-6 / FR-102 S-105 Stoich. Fermentation P-8 / PM-102 Fluid Flow P-10 / FR-104 Stoich. Fermentation P-9 / DS-101 Centrifugation S-111 Yp/s = 0,5 g/g; Pmax = 50 g/l; n = 1,0; μmax = 0,8 h-1;v1=2 *V2=2 *V3; Θ = 14 h; Sin = 95 g/l P-7 / PM-103 Fluid Flow P out= 47,5 g/l Pp = 14,2 g/l h
39
40 Some final comments 40
41 R&D route Seek for xylose consumers Reinforcement /redirection/implantation of metabolic pathways to final products Pressure, adaptation and selection: overcoming either C5 liquor and product inhibition Bioreactor intensification: increase yield and productivity 41