The Impact of Climate Change on a Humid, Equatorial Catchment in Uganda.
|
|
|
- Emma Miller
- 5 years ago
- Views:
Transcription


1 The Impact of Climate Change on a Humid, Equatorial Catchment in Uganda. Lucinda Mileham, Dr Richard Taylor, Dr Martin Todd Department of Geography University College London
2 Changing Climate Africa has experienced a mean continental 20th Century warming of 0.7 C The periods of greatest warming are and post 1970, with the five warmest years on record occurring since decrease in runoff of 17 % in major river basins Predicted temperature increase of between 2-6 C by 2100 Accompanied by evaporative increases of % by 2080 Changes in the seasonality and intensity of future precipitation Why is it important in Uganda Dependence on rainfall-fed agriculture Reliance on localised (untreated) sources of water Groundwater is the only reliable source of potable water Current population of 25.8 million is estimated to more than double by 2025
 climate at scales appropriate for hydrological modelling.")
3 Main Objective To quantify the impacts of climate change on groundwater recharge and surface runoff in Uganda, East Africa. Specific objectives To evaluate the ability of a RCM to reproduce the current ( ) climate at scales appropriate for hydrological modelling. To develop a soil-moisture balance model for groundwater modelling operating at a scale which allows coupling with a RCM. To quantify the impacts of climate change (2070 to 2100) on catchment-scale terrestrial water resources in Uganda.
4 PRECIS What is PRECIS? (Providing Regional Climates for Impacts Studies) A simple-to-use PC-based RCM, has been developed by the Hadley Centre (UK) specifically to address the need for countries to make regional-scale climate predictions. Model resolution 25 or 50 km² Daily time-step Boundary conditions - A three member ensemble of central experiments ( ) - ECMWF ERA 40 reanalysis experiment A three member ensemble of SRES A2 scenario experiments ( ) - A single SRES B2 scenario experiment User defined emission scenarios, and specification of output levels Limited user manipulation land use, inland water features and topography can be changed but model parameterizations cannot be altered.
,")
5 Study Area / Method Catchment Scale River Mitano catchment. 2, 098 km 2 High relief and incised drainage reflect a runoff-dominated regime Land use - Agriculture (79 %), Grassland (17 %) wetland (3 %), small areas of forest and plantation
6 Regional scale - PRECIS Mean Climatology Precipitation (mm/day) PRECIS-ERA PRCIS-GCM VasCLIMO UDEL CRU GPCC V3 0.5 PRECIP GPCP PRECIP 1979-now CMAP (1979-now) TRMM Jan Feb Mar Apr May Jun Jul Aug Sep Oct Nov Dec Bi-modal precipitation regime Good representation of the temporal distribution of precipitation Overestimation of precipitation between December-March


7 PRECIS CRU VasCLIMO GPCC GPCP TRMM
8 Catchment-scale validation of precipitation 7 PRECIS CRU Station VasCLIMO GPCC GCPC CMAP TRMM 6 5 Preciptiation (mm.day) Jan Feb Mar Apr May Jun Jul Aug Sept Oct Nov Dec <10 % error in mean annual precipitation Better representation of Sep-Nov rainy season Magnitude remains poorly resolved in Jan-Mar Poor representation of peak Precipitation in first rains
9 Future PRECIS Change ( ) cont Increased precipitation July-December Shift in timing of peak seasons Mean annual precipitation increase of 14 % 3.5 C increase in Temperature 53 % increase in PET

10 Soil moisture balance model (SMBM) Simulates changes in soil moisture ( green water ) and provides estimates of rainfall-fed, groundwater recharge and runoff (infiltration excess) Can be run as a lumped parameter model OR as a semi-distributed model by running for different soil, slope and vegetation characteristics. Critically, can be run using gridded RCM or downscaled GCM data.
11 SMBM calibration ( ) Validated against discharge data from the River Mitano gauging station Poor performance is due to lag responses Stormflow is significantly better represented than baseflow due to its shorter lag response Should only be used to represent baseflow and stormflow on annual and longer timescales SMBM reproduces well the mean annual recharge and runoff


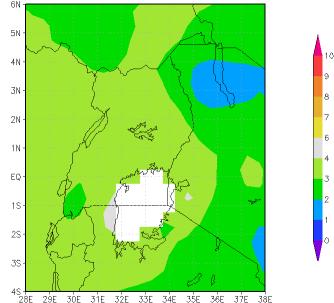
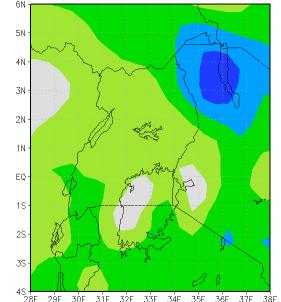
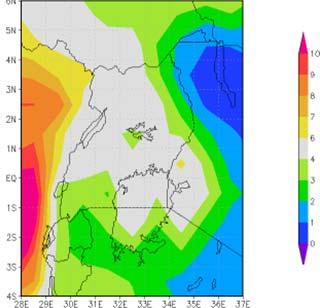
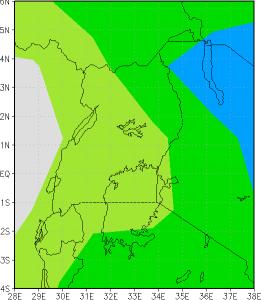
12 JJA SON Mean monthly delta factors Difference between and modelled precipitation. DJF MAM All seasons exhibit small increases in precipitation across Uganda Delta factors 0.9 to 1.8 Mean monthly factor Applied to daily data
13 Effect on Hydrology 14 % increase in Recharge 3.0 DELTA RECHARGE GRIDDED STAT RECHARGE 84 % increase in Runoff. Recharge (mm.d-1) JAN FEB MAR APR MAY JUN JUL AUG SEP OCT NOV DEC DELTA RUNOFF GRIDDED STAT RUNOFF Runoff (mm.d-1) JAN FEB MAR APR MAY JUN JUL AUG SEP OCT NOV DEC
14 Changes in Daily Precipitation Distribution Monthly Delta factors fail to account for changes in the daily precipitation distribution Reduction in small precipitation events (<10 mm) Increase in large precipitation events (>10 mm) Variable results for extreme precipitation events The distribution of precipitation is key for modelling of recharge and runoff
15 Impacts on hydrology The transformation method matches future precipitation and historical precipitation distributions. Recharge (mm.d-1) TRANSFORMED RECHARGE GRIDDED STAT RECHARGE 66 % increase in Recharge 123 % increase in Runoff JAN FEB MAR APR MAY JUN JUL AUG SEP OCT NOV DEC Fails to account for changes in occurrence TRANSFORMED RUNOFF GRIDDED STAT RUNOFF Runoff (mm.d-1) JAN FEB MAR APR MAY JUN JUL AUG SEP OCT NOV DEC
16 Conclusion PRECIS does a reasonable job at representing the climate of east Africa Observational uncertainty is large SMBM represents well the mean annual catchment recharge and runoff Recharge and runoff are sensitive to the distribution of precipitation Increase in the magnitude and intensity of precipitation Large increases in evapotranspiration and temperature Increases in surface runoff and groundwater recharge under future climates