The Community Land Model: Biogeophysics
|
|
|
- Georgiana Stone
- 5 years ago
- Views:
Transcription


1 The Community Land Model: Biogeophysics David Lawrence NCAR Earth System Laboratory with input from lots of LMWGers NCAR is sponsored by the National Science Foundation
2 Why the focus on land What distinguishes a land model within an Earth System Model that consists of so many important pieces? The land is a critical interface through which climate, and climate change impacts humans and ecosystems and through which humans and ecosystems can effect global environmental and climate change

 Permafrost")
 NH")

3 Observed terrestrial change Arctic greening (Bunn et al. 2007) Permafrost degradation (Akerman, 2008) NH snow cover anomaly (Rutger s Global Snow Lab) Deforestation

 Milly et al.")
4 Water resources: When will Lake Mead go dry? % Change in Runoff by 2050 (A1B) Milly et al., 2005 Barnett et al., 2008


5 Soil moisture Precipitation feedback How much does a precipitation-induced soil moisture anomaly influence the overlying atmosphere and thereby the evolution of weather and the generation of precipitation? Photo by D. Fritz

6 Land-atmosphere interactions GLACE: To what extent does soil moisture influence the overlying atmosphere and the generation of precipitation? How does the representation of land-atmosphere interactions affect simulation of droughts, floods, extremes? Koster et al., 2004; IPCC


7 Terrestrial Feedbacks: e.g., representing Arctic climate-change feedbacks in CESM Global warming Arctic warming Shrub growth Carbon sequester CO 2 efflux CH 4 efflux Permafrost warms and thaws Enhanced [nitrogen] Expanded wetlands Lakes drain, soil dries Microbial activity increases Arctic runoff increases Adapted from McGuire et al., 2006
8 Terrestrial carbon cycle impact on atmospheric CO 2 Climate-Carbon model intercomparison (C 4 MIP): Nine climate models of varying complexity with active carbon cycle Large range in simulated atmospheric CO 2 at 2100 max is > 1000 ppm min is < 750 ppm CSM1 Most of the difference can be attributed to land processes Courtesy of Pierre Friedlingstein
9 Why the focus on land The role of the land model in an Earth System Model Provide energy, water, and momentum fluxes to atmosphere Partition turbulent fluxes into latent vs sensible heat Calculate absorbed solar radiation, surface albedo Runoff to ocean Trace gas and particle exchange with atmosphere CO 2 fluxes to atmosphere Dust emissions Biogenic Volatile Organic Compound emissions Surface mass balance to ice sheet
10 Why the focus on land The role of the land model in an Earth System Model Provide energy, water, and momentum fluxes to atmosphere Partition turbulent fluxes into latent vs sensible heat Calculate absorbed solar radiation, surface albedo Runoff to ocean To model these fluxes, need to model Riverine transport of sediment, the state variables carbon, and of the nutrients land (i.e., soil moisture, soil T, snowpack, veg Trace gas and particle exchange with atmosphere type, height, leaf area, C and N CO 2 fluxes to atmosphere stocks in veg and soil) Dust emissions Biogenic Volatile Organic Compound emissions CH 4, N 2 O emissions Surface mass balance with ice sheet
11 Land model processes Rainfall Canopy evaporation Transpiration Throughfall Surface runoff Soil evaporation Sublimation α, T *, z o Sub-surface runoff
12 Land model processes Rainfall Throughfall Surface runoff Canopy evaporation Transpiration Photosynthesis model Soil evaporation Stomatal conductance: solar radiation, temp, humidity deficit, soil moisture, [CO 2 ] Nitrogen fertilization Bonan, 1995; Denning, 1995; Cox, 1999 Sublimation α, T *, z o Sub-surface runoff
13 Land model processes Rainfall Canopy evaporation Transpiration Throughfall Surface runoff Sub-surface runoff Photosynthesis model Soil evaporation Sublimation Soil hydrology model Runoff Vertical water flow Phase change T 1, T 2, T 3, T 10, α, T *, z o

14 Land model processes Rainfall Canopy evaporation Transpiration accumulation compaction melt Throughfall Surface runoff Sub-surface runoff Photosynthesis model Soil evaporation Sublimation Soil hydrology model Snow model T 1, T 2, T 3, T 10, α, T *, z o
15 Main Features of the Community Land Model Structural aspects (surface dataset and input datasets) Component submodels
16 Main Features of the Community Land Model Structural aspects (surface dataset and input datasets) Heterogeneity of landscape, tiling Plant Functional Types - vegetation types Soil texture River routing Aerosol and nitrogen deposition
17 Community Land Model subgrid tiling structure Gridcell Landunit Glacier Wetland Vegetated Lake Columns Soil Type 1 Urban PFTs


18 Community Land Model subgrid tiling structure Gridcell Landunit Glacier Wetland Vegetated Lake Columns Soil Type 1 Urban PFTs


19 Plant Function Type distribution in CLM4 based on MODIS/Crop datasets Lawrence and Chase, 2007
20 Plant Functional Type Parameters (CLM) Optical properties (visible and near-infrared): Leaf angle Leaf reflectance Stem reflectance Leaf transmittance Stem transmittance Land-surface models are parameter heavy!!! Morphological properties: Leaf area index (annual cycle) Stem area index (annual cycle) Leaf dimension Canopy height Root distribution Photosynthetic parameters: quantum efficiency (mmol CO 2 mmol photon -1 ) m (slope of conductancephotosynthesis relationship)

21 Soil Properties Soil parameters are derived from sand / clay percentage and soil organic matter content which is specified geographically and by soil level Soil moisture concentration at saturation Soil moisture concentration at wilting point Hydraulic conductivity at saturation Saturated soil suction Thermal conductivity Thermal capacity Soil profile 10 soil levels (~3.5m) 5 bedrock levels (~50m)
22 Land cover / land use change Land Use Change Wood harvest BET C4 Grass BET C4 Grass Crop Crop

23 Land cover change (prescribed changes in distribution of PFTs) Trees Crops Deforestation across Eastern North America, Eastern Europe, India, China, Indonesia, SE South America for Crops Lawrence, P et al. J. Climate, 2011

24 Impact of historic land cover change on climate
25 Main Features of the Community Land Model Component submodels Soil hydrology and thermodynamics model Snow model Photosynthesis model Radiation and albedo model River Transport model Lake model Urban model Vegetation dynamics model Carbon and nitrogen cycle model Volatile Organic Compound emissions model Dust emissions model
26 Modeling evaporation and runoff The ability of a land-surface scheme to model evaporation correctly depends crucially on its ability to model runoff correctly. The two fluxes are intricately related. (Koster and Milly, 1997). Runoff and evaporation vary non-linearly with soil moisture Evap, Runoff Soil wetness
27 Runoff processes SIMTOP: TOPMODEL-based runoff Infiltration excess P q o P f P f Severe storms Urban area Frozen surface


28 Subgrid-scale soil moisture heterogeneity SIMTOP: TOPMODEL-based runoff Infiltration excess P q o P f P f Severe storms Urban area Frozen surface Saturation excess P P q o P q s q r z wt


29 River Transport Model Chatahoochee River Raw GCM runoff Routed GCM runoff Observed riverflow 20-yr average river flow (m 3 s -1 )
30 River Discharge Accumulated discharge from 90 o N (10 6 m 3 s -1 ) Annual discharge into Global ocean Obs CLM4CN CLM4SP CLM3.5 CLM4SP River flow at outlet Top 50 rivers (km 3 yr -1 ) CLM3 CLM3: r = 0.86 CLM3.5: r = 0.87 CLM4SP: r = 0.94 CLM4CN: r = 0.77
 Streamflow (mm/mon) Yeh and Eltahir, 2005 Precipitation (mm/mon) GW level (m) water table Groundwater model (SIMGM) determines water table depth Subsurface runoff is exponential")
31 Groundwater in CLM Groundwater controls runoff (Yeh and Eltahir, 2005) Groundwater affects soil moisture and ET (Gutowski et al, 2002; York et al., 2002) Streamflow (mm/mon) Yeh and Eltahir, 2005 Precipitation (mm/mon) GW level (m) water table Groundwater model (SIMGM) determines water table depth Subsurface runoff is exponential function of water table depth Niu and Yang, 2005

 CCSM3 and CCSM4 data from 1870 and")
32 Soil (and snow) water storage (MAM SON) CCSM4 GRACE (obs) CCSM3 GRACE satellite measures small changes in gravity which on seasonal timescales are due to variations in water storage (mm) CCSM3 and CCSM4 data from 1870 and 1850 control
33 Total Land Water Storage (CCSM vs GRACE)
34 Abracos tower site (Amazon) Latent Heat Flux Latent Heat Flux Model Model CLM3 CLM3.5/4 OBS Total soil water OBS CLM3.5/4 CLM3


35 Evaluating and Improving the model with Tower Flux data Global Flux Tower Network
36 Morgan Monroe State Forest tower site OBS CLM3 Latent Heat Flux OBS CLM3 Sensible Heat Flux
 Latent Heat Flux Sensible Heat Flux r RMSE r RMSE (W/m 2")
37 Tower flux statistics (15 sites incl. tropical, boreal, mediteranean, alpine, temperate; hourly) Latent Heat Flux Sensible Heat Flux r RMSE r RMSE (W/m 2 ) (W/m 2 ) CLM CLM CLM4SP


38 Model components: Snow Model Up to 5-layers of varying thickness Treats processes such as Accumulation Snow melt and refreezing Snow aging Water transfer across layers Snow compaction destructive metamorphism due to wind overburden melt-freeze cycles Sublimation Aerosol deposition Snow depth Snow depth T snow T snow

, JGR Flanner and Zender (2006), JGR Flanner and")
39 Snow, Ice, and Aerosol Radiative Model (SNICAR) Snow darkening from deposited black carbon, mineral dust, and organic matter Vertically-resolved solar heating in the snowpack Snow aging (evolution of effective grain size) based on: Snow temperature and temperature gradient Snow density Liquid water content and Melt/freeze cycling Flanner et al (2007), JGR Flanner and Zender (2006), JGR Flanner and Zender (2005), GRL

40 Snow cover fraction How much of a grid cell is covered with snow for a given snow depth? Niu and Yang, JGR, 2006
 and K (thermal conductivity) are functions of: temperature total soil moisture soil texture ice/liquid")
41 Soil thermodynamics Solve the heat diffusion equation for multi-layer soil and snow model Cp T t = z K T z where C p (heat capacity) and K (thermal conductivity) are functions of: temperature total soil moisture soil texture ice/liquid content
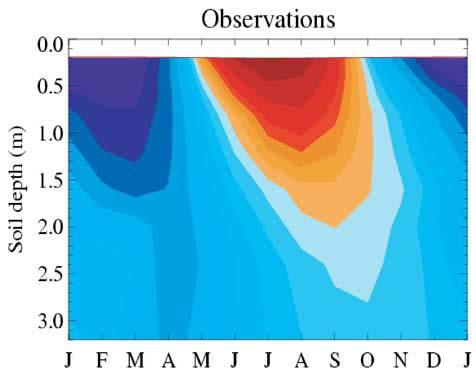
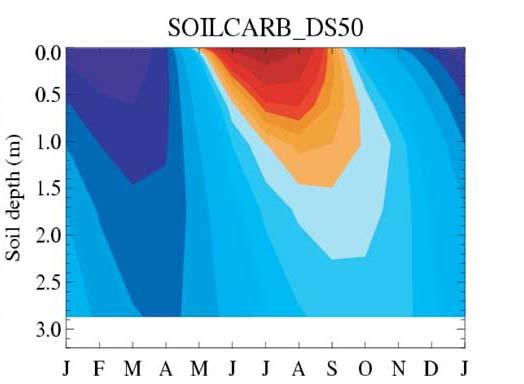
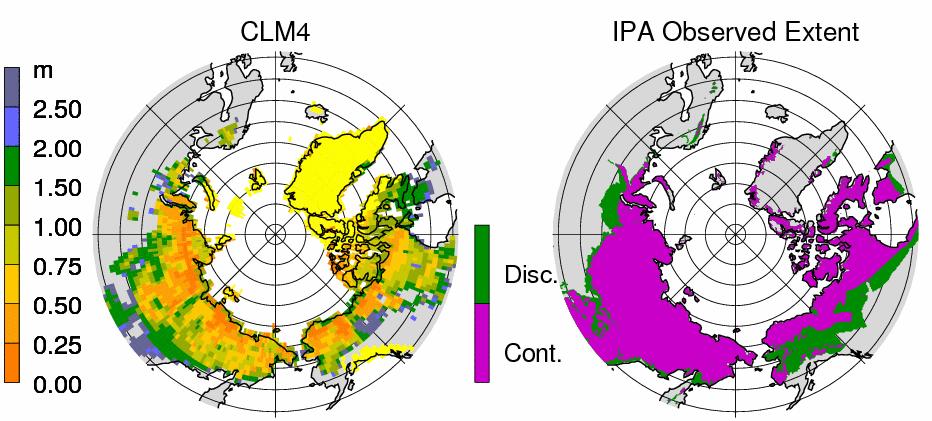
42 Modeling Permafrost in CLM Lawrence et al., J. Climate, 2011


43 Modeling surface albedo Surface albedo a function of Vegetation cover and type Snow cover Snow age Solar zenith angle Soil moisture Amount of direct vs diffuse solar radiation Amount of visible vs IR solar radiation
 Snow depth> 0.2m Snowfree Snowfree Snow depth > 0.")

44 Surface albedo (CLM offline compared to MODIS) Model Bias (%) RMSE (%) Snow depth> 0.2m Snowfree Snowfree Snow depth > 0.2m CLM Note: MODIS albedo biased low for snow at high zenith angle (Wang and Zender, 2010) CLM4SP

45 Urban Model

46 Percent Urban at Climate Model Resolutions

47 Urban Modeling in CCSM4 Present day Urban Heat Island (UHI) simulated by CLM Urban ( C) Modeled UHI ranges from near-zero up to 4 C with spatial and seasonal variability controlled by urban to rural contrasts in energy balance. Oleson, K.W., G.B. Bonan, J. Feddema, M. Vertenstein, C.S.B. Grimmond, 2008a, J. Appl. Meteor. Climatol. Oleson, K.W., G.B. Bonan, J. Feddema, M. Vertenstein, 2008b, J. Appl. Meteor. Climatol.
48 Putting it all together: CLM on a single slide!

49 Diffuse solar Reflected solar Absorbed solar Aerosol deposition SCF Downwelling longwave Emitted longwave Soil (sand, clay, organic) Bedrock Surface energy fluxes Latent heat flux Sensible heat flux Soil heat flux Precipitation Momentum flux Wind speed 0 u a Transpiration Evaporation Dust Sublimation Melt Soil Aquifer recharge Unconfined aquifer Throughfall Water table Hydrology Evaporation Infiltration Surface runoff Saturated fraction Sub-surface runoff Fire Phenology Biogeochemical cycles Photosynthesis Soil C/N Vegetation C/N Litterfall N mineralization BVOCs Heterotrophic respiration Root litter N uptake Autotrophic respiration N dep N fixation Denitrification N leaching Glacier Wetland Runoff River Routing Lake Competition Vegetation Dynamics Disturbance Urban River discharge Wood harvest Land Use Change Growth Figure 1: Lawrence et al., Journal Advances Modeling Earth Systems, 2011


50 Future and Ongoing Challenges With steadily increasing complexity, just keeping everything operating and working together well is a challenge Heterogeneity C, N, water interactions
51 CLM near-term development activities, CLM4.5 (late next year?) Crops and irrigation Revised cold region hydrology Prognostic wetland 2-way RTM / grid cell interactions Revised canopy processes Methane emissions model Improved fire algorithm including human triggers and suppression Revised lake model Dynamic landunits Transitions glacier to vegetated, lake area change

52


53 Global Partitioning of Evapotranspiration % CLM3 CLM4SP CLM4CN GSWP Transpiration Ground Evap Canopy Evap
 Reduces CCSM energy imbalance by ~0.15-0.")
54 CLM3.5 CLM4 Ice stream in River Transport Model For snow capped regions send excess water to ice stream (poor man s ice sheet calving) Reduces CCSM energy imbalance by ~ W/m 2 Unrealistic high sea-ice thickness in semi-closed bays Ice runoff Liquid runoff
55 Photosynthesis model Plant physiological controls on evapotranspiration Function of solar radiation, humidity deficit, soil moisture, [CO2], temperature Stomatal Gas Exchange CO 2 H 2 O Leaf cuticle Guard cell Guard cell Photosynthetically active radiation Chloroplast light CO H 2 O CH 2 O + O 2 + H 2 O Bonan (1995) JGR 100: Denning et al. (1995) Nature 376: Denning et al. (1996) Tellus 48B: , Cox (1999) Figure courtesy G. Bonan
56 Land models have come a long way 1 st Generation: Bucket Model Precipitation Evaporation E = β E p β = 1 for w w 0 β = w/w 0 for w < w 0 Water depth, w Critical depth, w 0 Runoff Bucket Model Manabe (1969) Mon Wea Rev 97: Williamson et al. (1987) NCAR/TN-285+STR Figure courtesy G. Bonan
57 Morgan Monroe State Forest tower site OBS CLM3 CLM3.25 Latent Heat Flux Reduced canopy interception Permits more water to enter soil Groundwater/aquifer model Stores/releases moisture on seasonal-decadal timescales
58 Morgan Monroe State Forest tower site OBS CLM3 CLM3.25 CLM3.45 Soil evaporation resistance decreases LH in spring, more water available in summer for transpiration Stöckli et al., JGR-BGC (2008)
59 Another way of putting it is that at each timestep the land scheme solves Surface energy balance S + L = S + L + λe + H + G S, S are down(up)welling solar radiation, L, L are up(down)welling longwave radiation, λ is latent heat of vaporization, E is evaporation, H is sensible heat flux, and G is ground heat flux Surface water balance P = E S + E T + E C + R Surf + R Sub-Surf + SM / t P is rainfall, E S is soil evaporation, E T is transpiration, E C is canopy evaporation, R Surf is surface runoff, R Sub-Surf is sub-surface runoff, and SM / t is the change in soil moisture over a timestep

60 Mitigating the Urban Heat Island (UHI) with White Roofs Reduction in the UHI simulated by Community Land Model Urban (CLMU) ( C) Increasing global roof albedo to 0.9 in CLMU reduces annual UHI by 1/3 on average. Effectiveness of white roofs as a UHI mitigation technique varies according to urban design properties, climate, and interactions with space heating. Oleson, K.W., G.B. Bonan, and J. Feddema, 2010, Geophys. Res. Lett.