Detention Pond Design Considering Varying Design Storms. Receiving Water Effects of Water Pollutant Discharges
|
|
|
- Shonda May
- 5 years ago
- Views:
Transcription


 Habitat destruction")
 Low dissolved oxygen (from organic materials) Pathogens")
 Temperature Debris and unsafe")
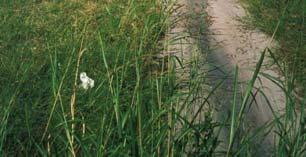
1 Detention Pond Design Considering Varying Design Storms Land Development Results in Increased Peak Flow Rates and Runoff Volumes Developed area Robert Pitt Department of Civil, Construction and Environmental Engineering University of Alabama Tuscaloosa, AL Similar undeveloped area Large Rain Small Rain Receiving Water Effects of Water Pollutant Discharges Sediment (amount and quality) Habitat destruction (mostly through high flows and sedimentation) Eutrophication (nutrient enrichment) Low dissolved oxygen (from organic materials) Pathogens (mostly from municipal wastewater and agricultural runoff) Toxicants (heavy metals and organic toxicants) Temperature Debris and unsafe conditions etc. Wet Detention Ponds 1


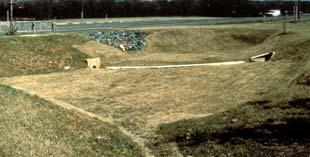

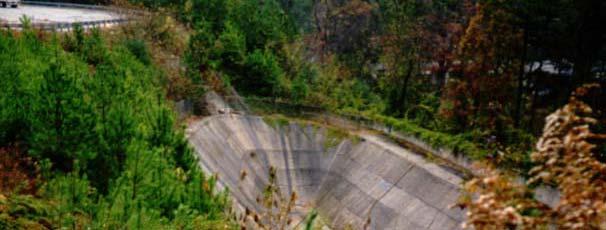
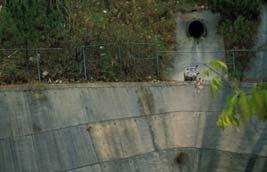


2 Extended Detention Ponds Dry Ponds with Pilot Channels Caltrans, San Diego and Los Angeles, California Unusual Dry Detention Pond Located on Hillside to Meet 100 year Peak Flow Rate Criterion Large Corrugated Pipes used for Underground Detention Below Parking Area 2


, worse conditions are likely to occur at downstream areas WinTR-55 is the easiest and")

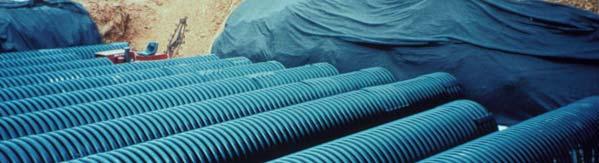
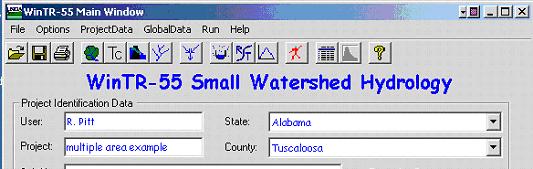
3 Examples of Proprietary Underground Detention Systems Basinwide Hydraulic Analyses Contech Construction Products, Inc. Invisible Structures, Inc. Basinwide analyses are needed to identify the most suitable locations and sizes for flood control detention ponds If just follow pre and post development peak flow rate criterion (the peak flow rate after development must be no larger than the peak flow rate before development for a specific design storm), worse conditions are likely to occur at downstream areas WinTR-55 is the easiest and cheapest tool available to perform a basinwide hydraulic analysis to ensure that hydrographic interferences will not occur. StormTech StormTrap Developing subwatershed requiring detention pond Predevelopment hydrographs from upstream area and from developing subarea 3

 3 to 8 : 4% of rains (13% of runoff) >8 :")

 Most of the events (numbers of rain storms) Little of annual al runoff")

4 Final hydrographs from subareas and total area with detention pond to meet predevelopment peak flow criterion Probability distribution of typical Alabama rains (by count) and runoff (by depth). <0.5 : 65% of rains (10% of runoff) 0.5 to 3 : 30% of rains (75% of runoff) 3 to 8 : 4% of rains (13% of runoff) >8 : <0.1% or rains (2% or runoff) EPA report on wet weather flows, Pitt, et al Same general pattern in other parts of the country, just shifted. Pitt, et al. (1999) Design Issues (<0.5 inches) Most of the events (numbers of rain storms) Little of annual al runoff volume Little of annual pollutant mass discharges Probably few receiving water effects Problem: pollutant concentrations likely l exceed regulatory limits (especially for bacteria and total recoverable heavy metals) for each event 4
5 Design Issues (0.5 to 3 inches) Majority of annual runoff volume and pollutant discharges Occur approximately once a week Problems: Produce moderate to high flows Produce frequent high pollutant loadings Design Issues (3 to 8 inches) This range of rains can include drainage-design storms (depending on rain intensity and site time of concentration). Most of these storms last for one to two days. Drainage design storms of these depths would last only for a few hours. Establishes energy gradient of streams Occur approximately every few months (two to five times a year). Drainage design storms having high peak intensities occur every several years to several decades) Problems: Unstable streambanks Habitat destruction from damaging flows Sanitary sewer overflows Nuisance flooding and drainage problems/traffic hazards Design Issues (> 8 inches) Occur rarely (once every several years to once every several decades, or less frequently). Three rains were recorded that were >8 inches in the 37 years between 1952 and 1989 in Huntsville, AL. Produce relatively small fraction of the annual pollutant mass discharges Produce extremely large flows and the largest events exceed drainage system capacity (depending on rain intensity and time of concentration of drainage area) Combinations of Controls Needed to Meet Many Stormwater Management Objectives Smallest storms should be captured on-site for reuse, or infiltrated Design controls to treat runoff that cannot be infiltrated on site Provide controls to reduce energy of large events that would otherwise affect habitat Provide conventional flooding and drainage controls 5

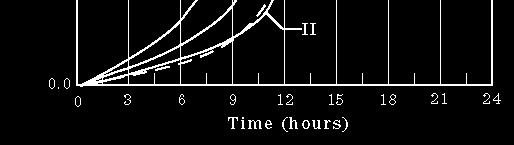
6 Figure and Table from Center for Watershed Protection Urban Steam Classification Channel Stability Aquatic Life Biodiversity Impervious Cover Model Sensitive Impacted Damaged 0 10% 11 25% % Imperviousness Imperviousness Imperviousness Stable Unstable Highly Unstable Good/Excellent Fair/Good Poor Hours of Exceedence of Developed Conditions with Zero Runoff Increase Controls Compared to Predevelopment Conditions (MacRae (1997) Recurrence Interval (yrs) 1.01 (critical mid-bankfull conditions) 1.5 (bankfull conditions) Existing Exceedence for Flowrate Predevelopment (m 3 /s) Conditions (hrs per 5 yrs) Exceedence for Existing Exceedence for Ultimate Development Development Conditions, with Conditions, ZRI Controls with ZRI (hrs per 5 yrs) Controls (hrs per 5 yrs) Can calculate the hours of exceedence of various flow targets for different development scenarios Rainfall Frequency Example Intensity - Duration - Frequency (IDF) Curve Rainfall frequency is commonly expressed as the average return period of the event. The value should be expressed as the probability of that event occurring in any one year. As an example, a 100-yr storm, has a 1% chance of occurring in any one year, while a 5-yr storm has a 20% chance of occurring in any one year. Multiple rare events may occur in any one year, but that is not very likely. 6


")


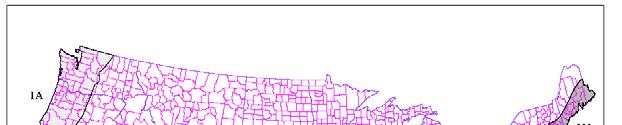
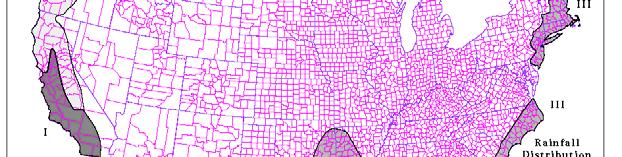
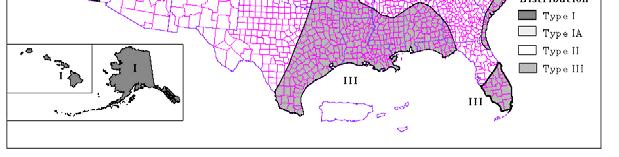
7 Developed by S. Rocky Durrans SCS (NRCS) Rainfall Distributions Zones of Different Rainfall Distributions 7


 and DAMS2 (SCS 1982) computer programs provide accurate analysis methods. WinTR55 also has improved routing.")
8 Rainfall Distributions in the Southeastern U.S. Probability of design storm (design return period) not being exceeded during the project life (design period). As an example, if a project life was 5 years, and a storm was not tto be exceeded with a 90% probability, a 50 year design return period storm must be used. Estimating Storage Requirements of the Detention Pond The detention basin is the most widely used measure for controlling peak discharge. It is generally the least expensive and most reliable of the measures that have been considered. It can be designed to fit a wide variety of sites and can accommodate multiple-outlet spillways to meet requirements for multi-frequency control of outflow. Estimating the Effects of Storage (Based on Chapter 6 of TR-55) Hydrologic routing gprocedures can be used to estimate the effect on hydrographs. Both the TR-20 (SCS 1983) and DAMS2 (SCS 1982) computer programs provide accurate analysis methods. WinTR55 also has improved routing. This chapter in TR-55 contains a manual method for quick estimates if the effects of temporary detention on peak discharges. The method is based on average storage and routing effects for many structures. 8
9 Estimating the Effects of Storage (Based on Chapter 6 of TR-55) Estimating the Effects of Storage: Input Requirements The figure is used to estimate storage volume (V s ) required or peak outflow discharge (q o ). The most frequent application is to estimate V s, for which the required inputs are runoff volume (V r ), q o, and peak inflow discharge (q i ). To estimate q o, the required inputs are V r, V s, and q i. Estimating the Effects of Storage: Estimating V s Use worksheet 6a to estimate V s, storage volume required, by the following procedure. 1. Determine q o. Many factors may dictate the selection of peak outflow discharge. The most common is to limit downstream discharges to a desired level, such as predevelopment discharge. Another factor may be that the outflow device has already been selected. Estimating the Effects of Storage: Estimating V s 3. Compute q o /q i and determine V s /V r from figure Q (watershed runoff in inches) is determined from the CN plot using the 24-hr rain depth associated with the design storm. It must be converted to the units in which V s is to be expressed most likely, acre-feet or cubic feet. The most common conversion of Q to V r is expressed in acre-feet: V r = 53.33Q(A m ) 2. Estimate q i by either the graphical peak discharge or tabular hydrograph methods. Do not use peak discharges developed by another procedure. Where V r = runoff volume (acre-ft) Q = runoff (in) A m = drainage area (mi 2 ), and = conversion factor from in-mi 2 to acre-ft. 9
. s r 6.")

10 Solution of the SCS Runoff Equation (from TR-55, Urban Hydrology for Small Watersheds, Soil Conservation Service, U.S. Department of Agriculture): Estimating the Effects of Storage: Estimating V s 5. Use the results of steps 3 to 4 to compute V s : V s V r V V Where V s = storage volume required (acre-ft). s r 6. The stage in the detention ti basin corresponding to V s must be equal to the stage used to generate q o. 1. In most situations a minor modification of the outflow device can be made. If the device has been preselected, repeat the calculations with a modified q o value. Detention Pond Size Example for Single Design Storm A development is being planned in a 75-acre (0.117 mi 2 ) watershed that outlets into an existing concrete-lined channel designed for present conditions. If the channel capacity is exceeded, damages will be substantial. The watershed is in the type II storm distribution region. The present channel capacity, 180 cfs, was established by computing discharge for the 25-year frequency storm by the Graphical Peak Discharge method. The developed-condition peak discharge (q i ) is 360 cfs, and runoff (Q) is 3.4 inches. Since outflow must be held to 180 cfs, a detention basin having that maximum outflow discharge (q o ) will be built at the watershed outlet. How much storage (V s ) will be required to meet the maximum outflow discharge (q o ) of 180 cfs, and what will be the approximate dimensions of a rectangular weir outflow structure? Detention Pond Example Sizing, Single Stage (single design storm objective) Example 6-2, TR-55 How much storage (V s ) will be required to meet the maximum outflow discharge (q o ) of 180 cfs (calculated to be associated with the 25-yr design storm, and what will be the approximate dimensions of a rectangular weir outflow structure? The peak inflow had been determined to be 360 cfs for this event. Figure 6-2 shows how worksheet 6a is used to estimate required storage (V s = 5.9 acre-ft) and maximum stage (E max = ft). The rectangular weir was chosen for its simplicity; however, several types of outlets can meet the outflow device proportion requirement. An outlet device should be proportioned to meet specific objectives. A single-stage device was specified in this example because only one storm was considered. A weir is suitable here because of the low head. The weir crest elevation is ft. Using V s = 5.9 acreft (figure 6-2, step 9) and the elevation-storage curve, the maximum stage (E max ) is ft. 10

 4.")
11 Detention Pond Size Estimation: Example for single design storm General Weir Equation 3 / 2 Q CLH Where C = weir coefficient (see table) L = weir length Detention Pond Size Estimation: Example for single design storm The rectangular weir equation is: Where Q o =3.2L w H w 1.5 q o = peak outflow discharge (cfs) L w = weir crest length (ft) H w = head over weir crest (ft) H w and q o are computed as follows: H w = E max weir crest elevation = = 5.7 ft. Detention Pond Size Estimation: Example Since q o is known to be 180 cfs, solving for L w yields L L w w q0 3.2H 1.5 w ft / sec (5.7 ft) 4.1 ft In summary, the outlet structure is a rectangular weir with crest length of 4.1 ft, H w = 5.7 ft, and q o = 180 cfs corresponding to a V s = 5.9 acre-ft. 11
 must also be met. tthe peak kifl inflow for this event had been determined to be 91 cfs.")
. This flow ratio corresponds to a Vs/Vr ratio of 0.")
12 Example for Multi-Stage Structure (multi-year discharge objectives) (example 6-2, ch 6, TR-55) In addition to the 25-yr design storm objective shown in the above example, an additional limit of 50 cfs (associated with the 2-yr design storm ) must also be met. tthe peak kifl inflow for this event had been determined to be 91 cfs. The smallest event is used to design the lower portions of the pond and is calculated first, the larger storm pond requirements are then added to this, but the volume and outfall discharge for the smaller event are subtracted from the larger event requirements. The q o /q i ratio for the small event is therefore 0.55 (50/91). This flow ratio corresponds to a Vs/Vr ratio of 0.26 TR-66 Fig 6-1 chart for the type II event. The prior runoff volume was determined to be 1.5 watershedinches, or 9.4 acre-ft, and the storage volume (Vs) )is therefore 2.4 acre-ft. The storage-stage diagram on the left shows that this storage volume is met at an elevation of ft. With an datum elevation of 100 ft (the bottom of the pond and the bottom of the lowest weir), the maximum height for the weir crest elevation is therefore 3.6 ft. Using the rectangular weir equation, this corresponds to a weir length of 2.3 ft. The top elevation of the weir (for the larger event) was previously determined to be at 5.7 ft. in order to provide the needed Vs. The first stage weir that is 2.3 ft long with a maximum elevation of 5.7 ft will discharge 100 CFS. Therefore, another 80 CFS must be discharged through a second stage (or another discharge) between the 3.6 and 5.7 ft (a total depth of 2.1 ft). Assuming the second discharge structure is completely separate from the lower one, the weir length can then be calculated with a depth of 2.1 ft and an 80 CFS discharge rate. For a rectangular weir, this corresponds to a weir length of 8.2 ft. In most cases, it is assumed that t these weirs are stacked, but that likely introduces errors (if stacked, the actual discharge will be less than assumed). If the lower discharge is an orifice (or culvert) and the upper discharge is rectangular, then they will be separate and this method can also be used. In all cases, it is a good idea to confirm these initial sizing and discharge device calculations using a routing model. The following example shows how WinTR-55 can be used to evaluate pre- and post-development flows and to evaluate a pond. Unfortunately, WinTR-55 has some limitations by only allowing a single stage outlet device and only has a few outlet devices available. The inflow calculations and associated flow routing also assume open channel flow and not pipe flow, but that is probably OK for a small site having minimal piping. Other models can be used. One inexpensive commercial model that is very flexible is HydroCad, which is based on TR-20 routing technology and can handle many interconnected t ponds, different outlets, and pipe and open channel routing. TR-20 can also be used (USDA source) and is free, but is a DOS program still (WinTR-55 incorporates the TR-20 more accurate routing, but has the limitations mentioned above. SWMM5 (EPA) is free and very flexible and can also be used, with few limitations. 12
 Outlet")


 may be defined")

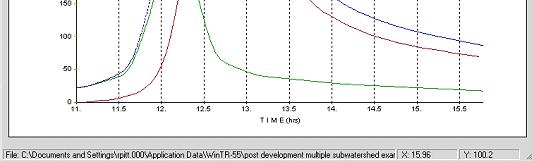
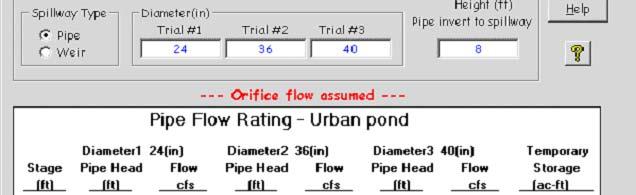
13 WinTR-55 Schematic Example WinTR-55 Structure Data Window Sub-area 2 (Reach Routing) Outlet Sub-area 3 Legend Storage Area Sub-Area Inflow Points Entry, editing and/or viewing of a pond s surface area, structure outlet type and dimensions, and rating can be found on this window. Up to three outlet sizes (trials) may be defined for each structure. If the temporary structure storage or hydraulics require a complex rating, use another method like TR-20 or Sites. Predevelopment flow calculations 13
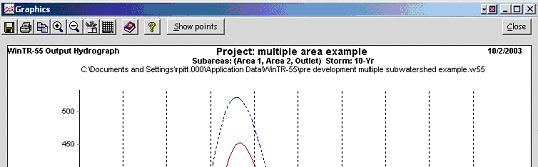
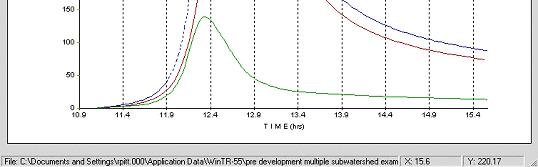
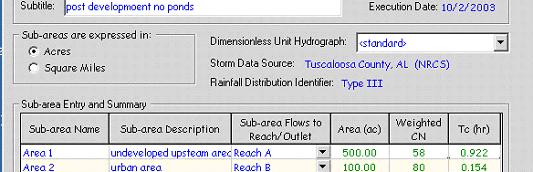
14 Predevelopment hydrographs Post development flow calculations Post development hydrographs with no pond Pond sizing calculations 14
, the pond is assumed to then have vertical side slopes (not a good idea).")


 and storage below the elevations are displayed.")
15 The area is 2 acres at the depth where the discharge begins, and is 3.5 acres in area 6.5 feet above this spillway elevation. If the upper area was not entered (it is an optional value), the pond is assumed to then have vertical side slopes (not a good idea). The Discharge Description is based on the spillway type selected, either a pipe (using the pipe approach previously described), or a weir. If a weir is selected, it can be a broad-crested weir and the weir length entered. If a 0 value is entered for the weir length, the model will assume a 90 o V-notch weir. If a pipe spillway is selected (as in this example), the pipe diameter (in inches) is given, ranging gfrom 6 to 60 inches. When a pipe p is selected, the height from the invert of the discharge end of the pipe to the spillway elevation is also needed for the simplified equation. This height must be at least twice the diameter of the pipe. Up to three pipe diameters (or weir lengths) can be entered. The model will evaluate all three options, making the selection of the choice easier. As the dimensions are entered, the rating curves (flow vs. height) and storage below the elevations are displayed. This is a good indication of the correct spillway size, as the maximum discharge close to the desired pond depth can be observed. In this case, the 40 inch pipe has the desired discharge of 139 cfs at a stage slightly above 4 feet, and well under 10 feet. The 36 inch pipe option would need about 10 feet of stage (greater than planned), while the 24 inch pipe would require even more (more than 20 ft). Therefore, it is expected that the 3rd pipe option, the 40 inch pipe would work best. 15

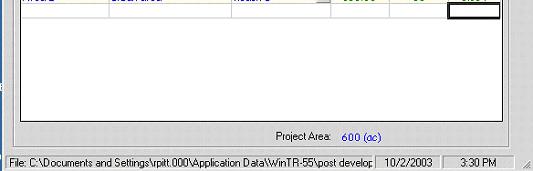
16 The maximum total flow rate is about 450 plus 120 = 570 cfs, compared to a maximum of about 520 cfs without detention. Much more information on detention ponds at: The Design and Use of Detention Facilities for Stormwater Management Using DETPOND: nd/windetpond%20user%20guide%20and%20documen tation.pdf Detention Pond Design and Analysis: ua edu/~rpitt/class/water%20resources%2 0Engineering/WREMainPage.htm Urban Hydrology for Small Watersheds (TR-55): tr55.pdf 16