Plantation water use research in South East South Australia
|
|
|
- Juliana Brooks
- 5 years ago
- Views:
Transcription


1 Plantation water use research in South East South Australia Click to edit Master subtitle style Richard Benyon Tanya Doody CSIRO Forestry and Forest Products
2 Introduction All use of natural resources (eg. land and water) has benefits and costs, whether that use be for primary production (including agriculture and forestry), urban, industrial, nature conservation, recreation. To achieve the right balance or mix of land uses, we need to have a sound understanding of all benefits and costs associated with each use economic, social and environmental. So, we need a good understanding of the various biophysical processes associated with each use.
3 The effect of location and scale Impacts of land use change can vary considerably, depending on the location and scale of change. We need to understand how location and scale affect the sum total of economic, social and environmental benefits. For example, a change at one point in the landscape might appear to have a large impact, but when considered in different locations or over larger scales might be of less consequence. Scale can include point, paddock, property, sub-catchment, catchment and region. We must be wary when knowledge gained at one location or scale is applied at other locations or scales.
4 Plantations and water in South East SA The question of the effects of land use change on water resources has received considerable attention in the South East of South Australia in recent years. Various studies have tried to quantify water use of the main land uses in the region. These studies include un-irrigated pasture and grazing land, irrigated crops and plantations. Most studies have been conducted at the point, or research-plot scale An increase in the area of Tasmanian blue gum (Eucalyptus globulus) plantations in the region is one of a number of land use changes in the past 10 years.
")
5 Recent land use change in the Green Triangle (courtesy of Adam Gerrand)
6 CSIRO tree water use studies Since the mid 1990s, CSIRO Forestry and Forest Products in Mount Gambier, with financial and in-kind assistance from various other organisations (see opening acknowledgements), has been researching water use of tree plantations (radiata pine and blue gum) in the Green Triangle (mostly in SA over karst and sedimentary geology). To date, our aim has been to improve our understanding of factors influencing plantation water use at the point scale.
7 Plantations


8 South East South Australia Facts and figures Upper and lower SE: 2.8 million ha of land 62,000 people Few streams ~1,000,000 ML annual groundwater recharge 720,000 ML for allocation 75,000 ha irrigated Salinity 350 mg/l to 50,000 mg/l Water resources in good order. 2 aquifers (shallow unconfined, deep confined )
 40% inundated each winter pre-european: 1500km")
9 Southeast South Australia Facts and figures 500 to 800 mm mean annual rainfall ~130,000 ha of plantation forest (~100k pine, ~30k blue gum) 40% inundated each winter pre-european: 1500km drains
10 The water balance paradox In the Upper SE, despite low rainfall, there is too much water in the landscape need to remove saline groundwater and reduce salinity. In the Lower SE, despite higher rainfall, there can be insufficient water in the landscape competing uses for good quality groundwater in some locations. Most of the plantations are in the Lower SE.
11 Plantation water use studies Water balance studies can be used reliably to quantify plantation water use and net groundwater recharge and uptake at the point scale in plantations in the South East.
12
 Made up of:")
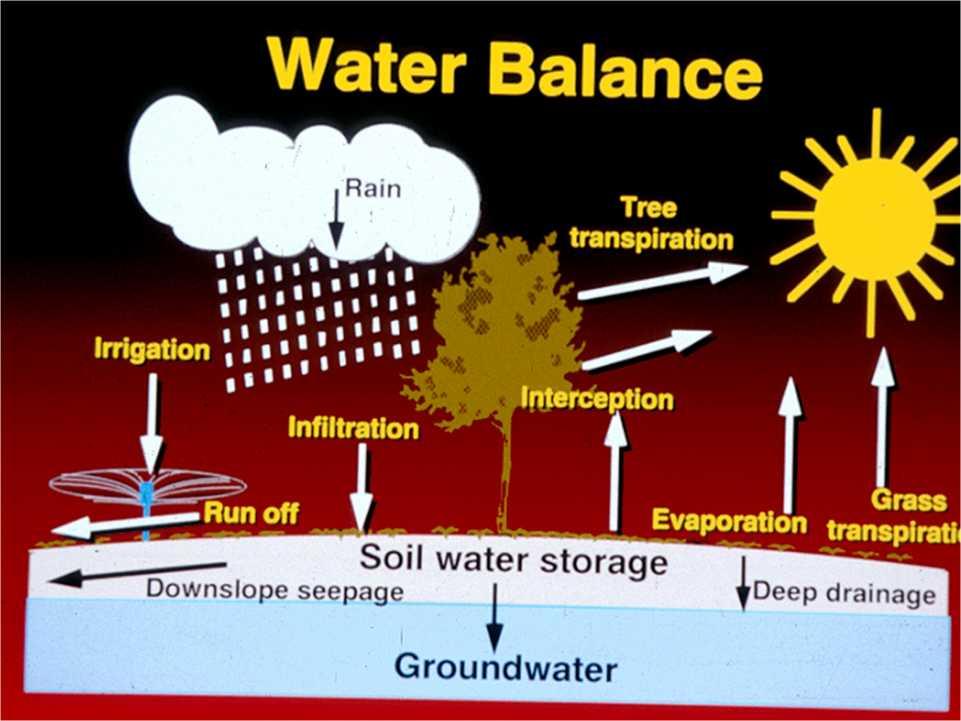
 Soil evaporation (from the")

13 What we measured Water use, or Evapotranspiration (ET) Made up of: Interception (evaporation from wet foliage after rain) Soil evaporation (from the litter layer or soil surface) Transpiration (evaporation of water taken up by plant roots from the soil)
14 Research questions Do plantations use all the rainfall? (is there any groundwater recharge? If so, how much?) Do any plantations take up water directly from the water table? If so, at what locations, how much and what factors influence groundwater up take? What is the relationship between plantation water use and productivity?

")

15 Measuring water use Tree water use (transpiration) Rainfall & climate Interception and soil evaporation

16 Interception 8 collection troughs in each research plot. Volume collected in each container is measured every 2-4 weeks and compared to rainfall.


17 Evaporation Evaporation is measured using at least 5 mini lysimeters in each research plot.
18 Transpiration Six sapflow loggers in each research plot measure tree water use continuously.

19 Soil Water Measured to 3 or 6 m depth in 5 access tubes per plot, using a neutron probe

20 Groundwater level Depth-to-watertable is measured every 2 to 4 weeks in observation wells, using an electric water level sensor.
21 Scale It is important to understand that all our research so far has been in small research plots at the point scale.
22 CSIRO research plots in the Green Triangle, (point-scale measurements) Species Water table (m) Soil type Rainfall (mm) Age (years) Years of data Pine 4 Sand over sandy clay Pine 5 Sand over clay Pine 6 Sand over sandy clay Pine (unfert) 9 Sand over clayey sand Pine (fert) 9 Sand over clayey sand Pine 9 Sand over clay Pine (thin) 9 Sand over clay Pine 16 Sand over clay Pine (unfert) 22 Sand over clay Pine (fert) 22 Sand over clay Blue gum 4 Sand over clay Blue gum (Vic) 7 Clay Blue gum 16 Sand over clayey sand Blue gum (thin) 16 Sand over clayey sand Blue gum (thin) 3 Sand Blue gum 1.5 Sand over clay Blue gum 1.5 Sand over sandy clay Blue gum 2.0 Sand over sandy clay Blue gum 3.0 Sand Blue gum 3.0 Sand over sandy clay Blue gum 10.0 Sand over clayey sand Pasture 1.5 Sand over clay Pasture 21.0 Sand over clayey sand
23
24 Annual water use was highly variable between research plots at different locations 1600 Evapotranspiration (mm year -1 )
25 Annual water balances: two examples watertable 3.4 m 1000 watertable 10.5 m Annual total (mm/year) Rain T E I groundwater use Rain T E I I = interception E= soil evaporation T= transpiration -600
26 Net water balance vs groundwater depth At the point scale 400 Median depth to watertable (m) Net recharge (mm year -1 ) Blue Gum Pasture Pine -1000
27 Annual transpiration in research plots Comparison between plots using and not using groundwater 1200 Transpiration (mm year -1 )
28 Water use and productivity On average, plots using some groundwater had higher productivity Number of plots Mean transpiration (mm/year) Used GW Mean CAI (m 3 /ha/yr) Did not use GW
29 Can growth rate be used as an indicator of tree water use? 1000 Transpiration (mm year -1 ) ?? using groundwater not using groundwater Stem volume increment (m 3 ha -1 year -1 )
30 Key research results so far In seven research plots where depth to water table was greater than about 6 m water use was in balance with rainfall. In one research plot with a water table at 5 m depth and a hardpan layer at 1.2 m, water use was significantly less than rainfall. In eight research plots located where depth to a transmissive aquifer was less than approximately 6 m, in light textured soils with no obvious root impeding layers, water use exceeded annual rainfall by an average of approximately 400 hundred mm year -1. Access to additional water from a water table was associated with higher productivity, on average, however productivity was not always a good indicator of water use.
31 Limitations All the research is in small research plots in plantations established over karst geology areas containing unconfined aquifers with generally a high capacity to transmit water. This situation is unusual in the rest of Australia, outside of South East SA. In other locations, root impeding layers, lower aquifer and soil transmissivity and salinity would all reduce or prevent groundwater uptake even if present at <6 m depth.


32 What have we not undertaken yet? All research has been in plantations post-closed canopy. Water use is probably lower in the first few years of each rotation before the canopy has closed, but this has yet to be quantified. Water use might also be reduced when plantations are thinned (some trees removed to increase growth rates of others). In the Green Triangle, radiata pine plantations are currently thinned 2 to 4 times in each rotation of 27 to 35 years. The next challenge is to extrapolate from small research plots to large plantations?
33 Extrapolation from small research plots In our research plots, groundwater depth was a good indicator of whether a research plot used groundwater, but not how much. 8 out of 9 research plots with a shallow water table used some groundwater (13% to 63% of their total water use). One research plot with an obvious root impeding layer did not use any groundwater. Leaf area index and growth rate were not necessarily good indicators of water use.
34 What does it mean? It is important to understand our research so far has not attempted to determine what proportion of plantations in the region use or do not use groundwater. If significant areas of plantations in the South East are using some groundwater, what implications might this have for watertable levels and PAV s in those areas?
35 For further information Richard Benyon or Tanya Doody CSIRO Forestry and Forest Products PO Box 946, Mount Gambier 5290 Tel: or