Report on the Globeville Landing Outfall (GLO) PM10 and Metals Ambient Air Study
|
|
|
- Conrad Shields
- 5 years ago
- Views:
Transcription

1 Report on the Globeville Landing Outfall (GLO) PM10 and Metals Ambient Air Study Conducted for the City and County of Denver, Department of Environmental Health Airtech Project No Report ID: 6363-August 2017 September 25, 2017
2 City and County of Denver Report ID: 6363-August 2017 Page 1 Table of Contents PROJECT OVERVIEW... 2 Objectives... 2 Project Scope... 2 Contact Information... 2 GLO Site Description... 3 Methodology... 3 Discussion of Results... 4 SUMMARY OF RESULTS... 5 Table 1 Summary of Ambient PM 10 Data... 5 Table 2 Summary of Metals Data... 6 TEST PROCEDURES... 7 Sampling Locations... 7 Methodology... 7 Quality Assurance/Quality Control... 8 APPENDIX Meteorological Data Sample Calculations Sampling Parameters Laboratory Data Calibration and QA/QC Data Sampling Data Sampling Pictures
3 City and County of Denver Report ID: 6363-August 2017 Page 2 Project Overview Objectives Airtech Environmental Services Inc. was contracted by the City and County of Denver to perform an ambient air study at the Globeville Landing Outfall (GLO) site located in Denver, Colorado. The specific objectives of this test program were as follows: Determine the concentration of particulate matter with a nominal diameter of 10 microns or less (PM10) at each of four (4) sampling locations Analyze a fraction of the filters for metals (arsenic and lead) Testing is being performed to meet the requirements of City and County of Denver and the United States Environmental Protection Agency (U.S. EPA). This testing is being conducted in support of visual dust monitoring being performed at the site and is not being conducted to demonstrate compliance with National Ambient Air Quality Standards (NAAQS) or Occupational Safety and Health Administration (OSHA) limits. For relative comparison, the table below shows NAAQS and OSHA limits: Compound Limit Type Limit Arsenic OSHA 8 Hour 10 ug/m 3 Lead OSHA 8 Hour 50 ug/m 3 PM Total OSHA 8 Hour 10,000 ug/m 3 PM Respirable OSHA 8 Hour 5,000 ug/m 3 Lead Ambient NAAQS Rolling Three Month 0.15 ug/m 3 PM 10 Ambient NAAQS 24 Hour 150 ug/m 3 Project Scope Sampling commenced January 1, 2016 and is being conducted every six (6) days for one (1) year. Sampling dates are being conducted on the same dates as CDPHE PM10 sampling. All sampling was performed by Airtech Environmental Services Inc. (Airtech). Analysis of the collected samples was performed by IML Air Science located in Sheridan, Wyoming. Sampling results will be summarized in monthly reports which will continue to be provided on a monthly basis. Contact Information The contact information for each of the principal parties is summarized in the tables on the following page:
4 City and County of Denver Report ID: 6363-August 2017 Page 3 Michael Ogletree Patrick Clark, PE, QSTI City and County of Denver Airtech Environmental Services Inc. 200 W 14th Ave 702 West 48 th Avenue, Unit J Denver, CO Denver, CO Phone: (720) Phone: (303) Michael.Ogletree@denvergov.org pclark@airtechenv.com Jenny Luthi Mary Hininger City and County of Denver IML Air Science 200 W 14th Ave 555 Absaraka Street Denver, CO Sheridan, WY Phone: (720) Phone: (307) Jennifer.Luthi@denvergov.org mhininger@imlinc.com GLO Site Description The site was designated as Operable Unit 2 (OU-2), which includes soils located in the vicinity of the former Omaha and Grant Smelter, of the Vasquez Boulevard and Interstate 70 (VB/I-70) Superfund Site (the Site). The Site was designated as a Superfund site due to the elevated levels of lead and arsenic in the soils from the prior smelting operations. The Site is owned and used by the City and County of Denver (CCoD) as the Globeville Landing Park and the Denver Coliseum, which opened in The CCoD constructed the Denver Stadium and Coliseum circa 1950 which encompassed part of the northeast portion of the former Omaha and Grant smelter facility. The approximately 10-acre Globeville Landing Park is located along the east side of the South Platte River. The park, constructed in the 1970s encompasses part of the southwest portion of the former Omaha and Grant smelter facility. The Coliseum parking lot is also underlain by a landfill that predates the Resource Conservation and Recovery Act (RCRA) of The Globeville Landing Park is underlain by soil mixed with construction debris. The GLO Project includes installation of an open-channel storm water drainage feature through a portion of Operable Unit 2 (OU-2) of the VB/I-70 Superfund Site. As part of the GLO project construction activities, the CCoD is conduct additional air monitoring for PM10, lead, and arsenic at the GLO Project Site. Methodology The sampling of PM10 is being performed using BGI PQ100 air samplers and is being collected on a tared filter of suitable quality to be able to test for metals after the PM10 analysis was complete. In the sampler, air is drawn by a sample pump through a size selective inlet device. The air then passes inside the instrument housing to a Mass Flow Sensor. The mass of PM10 collected with the sampling train is compared to the volume of ambient air sampled to calculate the PM10 concentration. Each sample is being collected over a period of 24 hours. Each sampling event starts at midnight and ends at midnight the following day. Sampling dates are being conducted on the same dates as CDPHE PM10 sampling. A portion of the collected filters are

5 City and County of Denver Report ID: 6363-August 2017 Page 4 additionally being analyzed for lead and arsenic by Inductively Coupled Plasma-Mass Spectrometry (ICP-MS). Discussion of Results The PM10 and metals results of all August sampling can be found in Tables 1 and 2 on Pages 5 and 6. Meteorological data can be found in the Appendix of this report. The data was collected at the I-25 Globeville Site. The August samples were collected during GLO construction activities. The PM10 sampling was conducted in support of visual dust monitoring. Due to site constraints within the Monitoring Boundary, the sampling does not meet the NAAQS testing requirements for monitor placement and quality assurance. All samples collected on 8/23/17 were analyzed for arsenic and lead. Prepared by: Reviewed by: Austin Heitmann Patrick Clark, PE
6 City and County of Denver Report ID: 6363-August 2017 Page 5 Summary of Results Table 1 Summary of Ambient PM10 Data Site Information Site 1 Site 2 Site 3 Site 4 Description Nectar Bee Coliseum Parking Coliseum Grass McDonalds Latitude 39 46'34.00"N 39 46'42.60"N 39 46'41.30"N 39 46'39.10"N Longitude '42.50"W '28.30"W '19.50"W '44.50"W PM 10 Results 8/5/17 (ug/scm) /11/17 (ug/scm) /17/17 (ug/scm) /23/17 (ug/scm) /29/17 (ug/scm) Notes and Observations Sampling on Site 4 ended prematurely on the 8/11/17 and 8/17/17 sampling dates as well as Site 2 on the 8/23/17 sampling dates. This was due to a battery which did not have the nut on the battery leads tightened down completely. This could have occurred due to wind in the field moving the power cable around and losing contact with the battery. While the battery was tested in the shop, under a controlled environment, it showed no issues. The issue has been resolved and no such instances have been experienced since.
7 City and County of Denver Report ID: 6363-August 2017 Page 6 Table 2 Summary of Metals Data Site Information Site 1 Site 2 Site 3 Site 4 Description Nectar Bee Coliseum Parking Coliseum Grass McDonalds Latitude 39 46'34.00"N 39 46'42.60"N 39 46'41.30"N 39 46'39.10"N Longitude '42.50"W '28.30"W '19.50"W '44.50"W Metals Results Arsenic 8/23/17 (ug/scm) < < < < Lead 8/23/17 (ug/scm) Notes and Observations Site 2 did not finish sampling, due to a bad connection on the battery terminals. The issue has since been resolved.

8 City and County of Denver Report ID: 6363-August 2017 Page 7 Test Procedures Sampling Locations Sampling was conducted at the sites indicated below. Pictures of each site can be found on the Appendix of this report. Methodology The sampling of PM10 was performed using BGI PQ100 air samplers. A sample of ambient air was withdrawn through a size selective inlet device and the PM10 collected on a tared filter of suitable quality to be able to test for metals after the PM10 analysis was complete. After passing through the filter, the air then passed inside the instrument housing to a Mass Flow Sensor. The mass of PM10 collected with the sampling train was compared to the volume of ambient air sampled to calculate the PM10 concentration. The sample head consisted of a size selective inlet device which was used to remove any particulate matter greater than 10 microns. The air sample then passes through a downtube and into a 47mm filter holder containing a tared filter. After exiting the filter holder, the air then passed inside the instrument housing to a Mass Flow Sensor to measure the air flow.
9 City and County of Denver Report ID: 6363-August 2017 Page 8 Prior to sampling the filters were allowed to equilibrate for 24 hours or more with the humidity maintained between 30 and 40% Relative Humidity (RH) and the temperature Maintained between 20 o C and 23 o C. The RH and temperature data was logged for 24 hours prior to and during weighing. The filters were weighed to the nearest gram (g) until a constant weight was achieved. The filter assembly was loaded into the sampler and the timer set to begin sampling at the predetermined start time. The sampler operates off a 12 volt battery which allowed for sampling for 24 hours without having to connect the sampler to external power. The signal generated by the Mass Flow Sensor was routed to a microprocessor which determined if the flow was at the set value and adjusted the pump speed to maintain the correct flow rate. The microprocessor turned the instrument on and off at the predetermined times and maintained the flow to a designated pressure and temperature value. The microprocessor stored all parametric information generated during the run period and configured it for presentation on the visual display and downloading to the software provided with the sampler. After sampling, the filter housing was recovered and placed in a labeled anti-static bag. The bag was then shipped to the IML Air Science laboratory located in Sheridan, Wyoming. Filter analysis followed the same procedures used for the tare filter analysis. Metals analysis was conducted by Inductively Coupled Plasma-Mass Spectrometry (ICP- MS). Quality Assurance/Quality Control To insure the collection of high quality data, the following Quality Assurance/Quality Control procedures have been implemented: A field blank was collected for every ten (10) collected PM10 samples. The field blanks were handled and analyzed in the same manner as the regular sampled filters. The Mass Flow Sensors measurement of flow through each analyzer was checked at the start of the program and will be checked again after every five (5) sampling events. The verification flow rate must compare within four (4) percent of the Mass Flow Sensors or the sensor must be calibrated and/or repaired.
10 Appendix Meteorological Data
11 City and County of Denver Meteorological Data - I-25 Globeville Project No Hour RD RH RS TEMP WD WS (MST) deg Percent mph degf deg mph 1:00 AM :00 AM :00 AM :00 AM :00 AM :00 AM :00 AM :00 AM :00 AM :00 AM :00 AM :00 PM :00 PM :00 PM :00 PM :00 PM :00 PM :00 PM :00 PM :00 PM :00 PM :00 PM :00 PM :00 AM
12 City and County of Denver Meteorological Data - I-25 Globeville Project No Hour RD RH RS TEMP WD WS (MST) deg Percent mph degf deg mph 1:00 AM :00 AM :00 AM :00 AM :00 AM :00 AM :00 AM :00 AM :00 AM :00 AM :00 AM :00 PM :00 PM :00 PM :00 PM :00 PM :00 PM :00 PM :00 PM :00 PM :00 PM :00 PM :00 PM :00 AM
13 City and County of Denver Meteorological Data - I-25 Globeville Project No Hour RD RH RS TEMP WD WS (MST) deg Percent mph degf deg mph 1:00 AM :00 AM :00 AM :00 AM :00 AM :00 AM :00 AM :00 AM :00 AM :00 AM :00 AM :00 PM :00 PM :00 PM :00 PM :00 PM :00 PM :00 PM :00 PM :00 PM :00 PM :00 PM :00 PM :00 AM
14 City and County of Denver Meteorological Data - I-25 Globeville Project No Hour RD RH RS TEMP WD WS (MST) deg Percent mph degf deg mph 1:00 AM :00 AM :00 AM :00 AM :00 AM :00 AM :00 AM :00 AM :00 AM :00 AM :00 AM :00 PM :00 PM :00 PM :00 PM :00 PM :00 PM :00 PM :00 PM :00 PM :00 PM :00 PM :00 PM :00 AM
15 City and County of Denver Meteorological Data - I-25 Globeville Project No Hour RD RH RS TEMP WD WS (MST) deg Percent mph degf deg mph 1:00 AM :00 AM :00 AM :00 AM :00 AM :00 AM :00 AM :00 AM :00 AM :00 AM :00 AM :00 PM :00 PM :00 PM :00 PM :00 PM :00 PM :00 PM :00 PM :00 PM :00 PM :00 PM :00 PM :00 AM
16 Sample Calculations
17 Sample Calculations for Site 1 on Below are the calculations that are used for generating the PM10 results. See also the Sampling Parameters section of the Appendix for run by run results with raw data. Volume of Ambient Collected Corrected to Standard Conditions V V V m( std ) m( std ) m( std ) = = ( )( Vm )( Pb ) ( Tm + 273) ( )( )( 637) ( ) = 20.7scm where: Vm(std) = volume of air collected at standard conditions (scm) Vm = volume of air sampled at meter conditions (m 3 ) Pb = barometric pressure (mm Hg) Tm = average air temperature ( o C) = ratio of standard temperature over standard pressure ( o K/mm Hg) 273 = conversion ( o C to o K) PM10 Concentration, ug/scm C = ( M )( 1,000,000) V m, std ( )( 1,000,000) C = 20.2 C = 80.6ug / scm where: C = PM10 concentration (ug/scm) M = PM10 catch (g) Vm(std) = volume of gas collected at standard conditions (scm) 1,000,000 = conversion factor (ug/g)
18 Sampling Parameters
19 City and County of Denver PM 10 Sampling Parameters Airtech Project No PM 10 and Metals Parameters Site 1 Site 2 Site 3 Site 4 Start Date 8/5/17 8/5/17 8/5/17 8/5/17 Stop Date 8/6/17 8/6/17 8/6/17 8/6/17 Start Time 0:00 0:00 0:00 0:00 Stop Time 0:00 0:00 0:00 0:00 Description Nectar Bee Coliseum Parking Coliseum Grass McDonalds Latitude 39 46'34.00"N 39 46'42.60"N 39 46'41.30"N 39 46'39.10"N Longitude '42.50"W '28.30"W '19.50"W '44.50"W Actual Total M 3 (acm) Average Temperature ( C) Average Pressure (mmhg) Standard Total M 3 (scm) Filter ID P P P P Filter Tare Weight (g) Filter Final Weight (g) Filter Weight Gain (g) PM 10 Results PM 10 Concentration (µg/scm) Notes and Observations None
20 City and County of Denver PM 10 Sampling Parameters Airtech Project No PM 10 and Metals Parameters Site 1 Site 2 Site 3 Site 4 Start Date 8/11/17 8/11/17 8/11/17 8/11/17 Stop Date 8/12/17 8/12/17 8/12/17 8/11/17 Start Time 0:00 0:00 0:00 0:00 Stop Time 0:00 0:00 0:00 6:12 Description Nectar Bee Coliseum Parking Coliseum Grass McDonalds Latitude 39 46'34.00"N 39 46'42.60"N 39 46'41.30"N 39 46'39.10"N Longitude '42.50"W '28.30"W '19.50"W '44.50"W Actual Total M 3 (acm) Average Temperature ( C) Average Pressure (mmhg) Standard Total M 3 (scm) Filter ID P P P P Filter Tare Weight (g) Filter Final Weight (g) Filter Weight Gain (g) PM 10 Results PM 10 Concentration (µg/scm) Notes and Observations The battery wasn't dead but sampler 4 shut off prematurely, not sure why.
21 City and County of Denver PM 10 Sampling Parameters Airtech Project No PM 10 and Metals Parameters Site 1 Site 2 Site 3 Site 4 Start Date 8/17/17 8/17/17 8/17/17 8/17/17 Stop Date 8/18/17 8/18/17 8/18/17 8/17/17 Start Time 0:00 0:00 0:00 0:00 Stop Time 0:00 0:00 0:00 4:13 Description Nectar Bee Coliseum Parking Coliseum Grass McDonalds Latitude 39 46'34.00"N 39 46'42.60"N 39 46'41.30"N 39 46'39.10"N Longitude '42.50"W '28.30"W '19.50"W '44.50"W Actual Total M 3 (acm) Average Temperature ( C) Average Pressure (mmhg) Standard Total M 3 (scm) Filter ID P P P P Filter Tare Weight (g) Filter Final Weight (g) Filter Weight Gain (g) PM 10 Results PM 10 Concentration (µg/scm) Notes and Observations Sampler stopped early again will test sampler & battery.
22 City and County of Denver PM 10 Sampling Parameters Airtech Project No PM 10 and Metals Parameters Site 1 Site 2 Site 3 Site 4 Start Date 8/23/17 8/23/17 8/23/17 8/23/17 Stop Date 8/24/17 8/23/17 8/24/17 8/24/17 Start Time 0:00 0:00 0:00 0:00 Stop Time 0:00 20:35 0:00 0:00 Description Nectar Bee Coliseum Parking Coliseum Grass McDonalds Latitude 39 46'34.00"N 39 46'42.60"N 39 46'41.30"N 39 46'39.10"N Longitude '42.50"W '28.30"W '19.50"W '44.50"W Actual Total M 3 (acm) Average Temperature ( C) Average Pressure (mmhg) Standard Total M 3 (scm) Filter ID P P P P Filter Tare Weight (g) Filter Final Weight (g) Filter Weight Gain (g) Arsenic Collected (ng) <50 <50 <50 <50 Lead Collected (ng) PM 10 Results PM 10 Concentration (µg/scm) Arsenic Concentration (µg/scm) < < < < Lead Concentration (µg/scm) Notes and Observations Battery appears to be failing, Site 2 did not finish sampling.
23 City and County of Denver PM 10 Sampling Parameters Airtech Project No PM 10 and Metals Parameters Site 1 Site 2 Site 3 Site 4 Start Date 8/1/17 8/1/17 8/1/17 8/1/17 Stop Date 8/2/17 8/2/17 8/2/17 8/2/17 Start Time 0:00 0:00 0:00 0:00 Stop Time 0:00 0:00 0:00 0:00 Description Nectar Bee Coliseum Parking Coliseum Grass McDonalds Latitude 39 46'34.00"N 39 46'42.60"N 39 46'41.30"N 39 46'39.10"N Longitude '42.50"W '28.30"W '19.50"W '44.50"W Actual Total M 3 (acm) Average Temperature ( C) Average Pressure (mmhg) Standard Total M 3 (scm) Filter ID P P P P Filter Tare Weight (g) Filter Final Weight (g) Filter Weight Gain (g) PM 10 Results PM 10 Concentration (µg/scm) Notes and Observations None
24 Laboratory Data
25 IML Air Science Particulate Matter Gravimetric Analysis Results Airtech-Denver Network: Airtech Environmental Services Inc. Tare Exposed Maximum Exposed Mass Sample Analysis Analysis Transportation Tare Gross Net ID Date Date Temperature ( C) (mg) (mg) (mg) Exposed Comments P /17/17 09/08/ P /17/17 09/08/ P /17/17 09/08/ P /17/17 09/08/ P /17/17 09/08/ P /17/17 09/08/ P /17/17 09/08/ P /17/17 09/08/ P /31/17 09/08/ P /31/17 09/08/ P /31/17 09/08/ P /31/17 09/08/ P /31/17 09/08/ P /31/17 09/08/ P /31/17 09/08/ P /31/17 09/08/ P /14/17 09/08/ P /14/17 09/08/ P /14/17 09/08/ P /14/17 09/08/ P /17/17 09/08/ P /31/17 09/08/

26
27
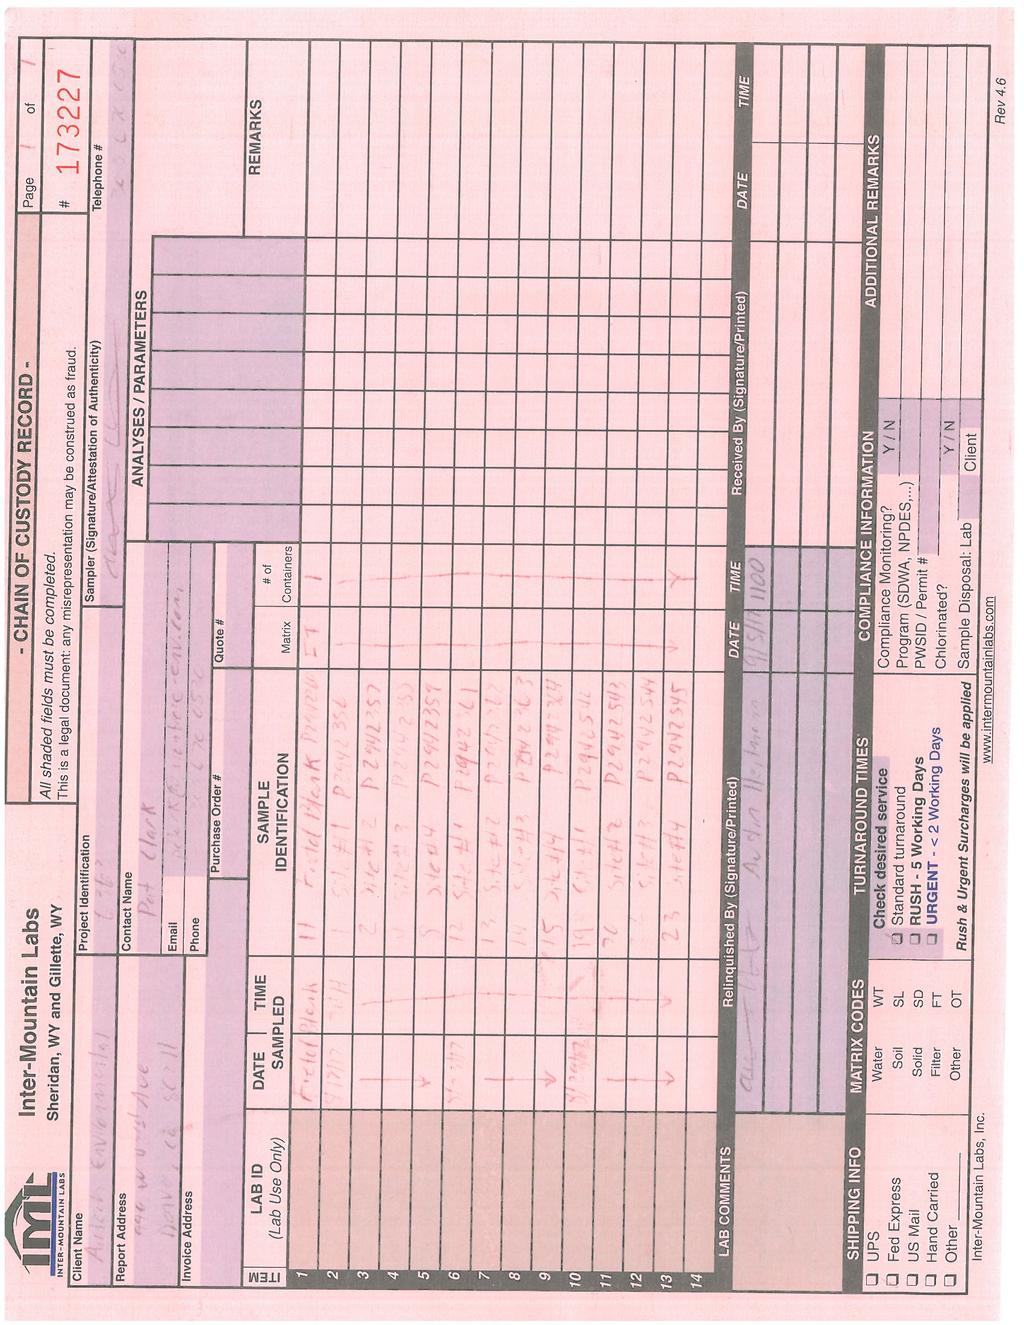
28 Inter-Mountain Labs 1673 Terra Avenue, Sheridan, Wyoming ph: (307) Your Environmental Monitoring Partner Date: 9/22/2017 CLIENT: Airtech Environmental Project: 6363 Lab Order: S CASE NARRATIVE Report ID: S Samples 12 Site #1 P , 13 Site #2 P , 14 Site #3 P and 15 Site #4 P were received on September 7, All samples were received and analyzed within the EPA recommended holding times, except those noted below in this case narrative. Samples were analyzed using the methods outlined in the following references: "Standard Methods For The Examination of Water and Wastewater", approved method versions Test Methods for Evaluating Solid Waste, Physical/Chemical Methods, SW-846, 3rd Edition 40 CFR Parts 136 and CFR Part 50, Appendices B, J, L, and O Methods indicated in the Methods Update Rule published in the Federal Register Friday, May 18, 2012 ASTM approved and recognized standards All Quality Control parameters met the acceptance criteria defined by EPA and Inter-Mountain Laboratories except as indicated in this case narrative. Reviewed by: John Jacobs, Project Manager Page 1 of 1
29 Inter-Mountain Labs 1673 Terra Avenue, Sheridan, Wyoming ph: (307) Sample Analysis Report Your Environmental Monitoring Partner CLIENT: Airtech Environmental 990 West 43rd Ave Denver, CO Project: 6363 Lab ID: S Client Sample ID: 12 Site #1 P Date Reported: 9/22/2017 Report ID: S Work Order: S Collection Date: 8/23/2017 Date Received: 9/7/2017 9:50:00 AM Sampler: AH Matrix: airfilter COC: Analyses Result RL Qual Units Date Analyzed/Init Method Field Actual Volume m³ 08/23/ Field IO-3.5 Teflon Filters Arsenic ND 50 ng/filter 09/13/ MS IO-3.5 Lead ng/filter 09/13/ MS IO-3.5 Filter Metals Concentration Arsenic ND µg/m³ 09/22/ JJ Calculation Lead µg/m³ 09/22/ JJ Calculation These results apply only to the samples tested. RL - Reporting Limit Qualifiers: B Analyte detected in the associated Method Blank C Calculated Value E Value above quantitation range G Analyzed at IML Gillette laboratory H Holding times for preparation or analysis exceeded J Analyte detected below quantitation limits L Analyzed by another laboratory M Value exceeds Monthly Ave or MCL or is less than LCL ND Not Detected at the Reporting Limit O Outside the Range of Dilutions S Spike Recovery outside accepted recovery limits X Matrix Effect Reviewed by: John Jacobs, Project Manager Page 1 of 4
30 Inter-Mountain Labs 1673 Terra Avenue, Sheridan, Wyoming ph: (307) Sample Analysis Report Your Environmental Monitoring Partner CLIENT: Airtech Environmental 990 West 43rd Ave Denver, CO Project: 6363 Lab ID: S Client Sample ID: 13 Site #2 P Date Reported: 9/22/2017 Report ID: S Work Order: S Collection Date: 8/23/2017 Date Received: 9/7/2017 9:50:00 AM Sampler: AH Matrix: airfilter COC: Analyses Result RL Qual Units Date Analyzed/Init Method Field Actual Volume m³ 08/23/ Field IO-3.5 Teflon Filters Arsenic ND 50 ng/filter 09/13/ MS IO-3.5 Lead ng/filter 09/13/ MS IO-3.5 Filter Metals Concentration Arsenic ND µg/m³ 09/22/ JJ Calculation Lead µg/m³ 09/22/ JJ Calculation These results apply only to the samples tested. RL - Reporting Limit Qualifiers: B Analyte detected in the associated Method Blank C Calculated Value E Value above quantitation range G Analyzed at IML Gillette laboratory H Holding times for preparation or analysis exceeded J Analyte detected below quantitation limits L Analyzed by another laboratory M Value exceeds Monthly Ave or MCL or is less than LCL ND Not Detected at the Reporting Limit O Outside the Range of Dilutions S Spike Recovery outside accepted recovery limits X Matrix Effect Reviewed by: John Jacobs, Project Manager Page 2 of 4
31 Inter-Mountain Labs 1673 Terra Avenue, Sheridan, Wyoming ph: (307) Sample Analysis Report Your Environmental Monitoring Partner CLIENT: Airtech Environmental 990 West 43rd Ave Denver, CO Project: 6363 Lab ID: S Client Sample ID: 14 Site #3 P Date Reported: 9/22/2017 Report ID: S Work Order: S Collection Date: 8/23/2017 Date Received: 9/7/2017 9:50:00 AM Sampler: AH Matrix: airfilter COC: Analyses Result RL Qual Units Date Analyzed/Init Method Field Actual Volume m³ 08/23/ Field IO-3.5 Teflon Filters Arsenic ND 50 ng/filter 09/13/ MS IO-3.5 Lead ng/filter 09/13/ MS IO-3.5 Filter Metals Concentration Arsenic ND µg/m³ 09/22/ JJ Calculation Lead µg/m³ 09/22/ JJ Calculation These results apply only to the samples tested. RL - Reporting Limit Qualifiers: B Analyte detected in the associated Method Blank C Calculated Value E Value above quantitation range G Analyzed at IML Gillette laboratory H Holding times for preparation or analysis exceeded J Analyte detected below quantitation limits L Analyzed by another laboratory M Value exceeds Monthly Ave or MCL or is less than LCL ND Not Detected at the Reporting Limit O Outside the Range of Dilutions S Spike Recovery outside accepted recovery limits X Matrix Effect Reviewed by: John Jacobs, Project Manager Page 3 of 4
32 Inter-Mountain Labs 1673 Terra Avenue, Sheridan, Wyoming ph: (307) Sample Analysis Report Your Environmental Monitoring Partner CLIENT: Airtech Environmental 990 West 43rd Ave Denver, CO Project: 6363 Lab ID: S Client Sample ID: 15 Site #4 P Date Reported: 9/22/2017 Report ID: S Work Order: S Collection Date: 8/23/2017 Date Received: 9/7/2017 9:50:00 AM Sampler: AH Matrix: airfilter COC: Analyses Result RL Qual Units Date Analyzed/Init Method Field Actual Volume m³ 08/23/ Field IO-3.5 Teflon Filters Arsenic ND 50 ng/filter 09/13/ MS IO-3.5 Lead ng/filter 09/13/ MS IO-3.5 Filter Metals Concentration Arsenic ND µg/m³ 09/22/ JJ Calculation Lead µg/m³ 09/22/ JJ Calculation These results apply only to the samples tested. RL - Reporting Limit Qualifiers: B Analyte detected in the associated Method Blank C Calculated Value E Value above quantitation range G Analyzed at IML Gillette laboratory H Holding times for preparation or analysis exceeded J Analyte detected below quantitation limits L Analyzed by another laboratory M Value exceeds Monthly Ave or MCL or is less than LCL ND Not Detected at the Reporting Limit O Outside the Range of Dilutions S Spike Recovery outside accepted recovery limits X Matrix Effect Reviewed by: John Jacobs, Project Manager Page 4 of 4

33
34
35 Calibration and QA/QC Data
36 IML Air Science Micro-Gravimetric Lab Blank Analysis Results Airtech Environmental Services Inc. August 4, September 8, 2017 Exposure Mass Blank Analysis Tare Gross Net ID Date (mg) (mg) (mg) /08/ /08/
37 IML Air Science Micro-Gravimetric Replicate Analysis Results Airtech Environmental Services Inc. August 4, September 8, 2017 Mass Filter Analysis Analysis Original Replicate Net ID Type Date (mg) (mg) (mg) P Tare 08/14/ P Tare 08/14/ P Tare 07/31/ P Tare 07/17/ P Gross 09/08/
38 IML Air Science Micro-Gravimetric Equilibration Times Airtech Environmental Services Inc. August 4, September 8, 2017 Tare Gross Filter Equilibration Equilibration ID (hh:mm) (hh:mm) P :19 25:01 P :19 25:01 P :08 25:03 P :09 25:03 P :14 25:06 P :12 24:55 P :14 24:58 P :08 25:03 P :10 25:05 P :14 25:06 P :13 24:56 P :15 25:00 P :18 25:01 P :20 25:02 P :07 25:02 P :07 25:02 P :15 25:06 P :12 24:56 P :13 24:56 P :13 24:57 P :14 24:57 P :14 24:58
39 SampleID Site LabID Tare Equilibration DateTime (MST) Tare Analysis DateTime (MST) Tare Mean 24hr. Temp ( C) Tare Standard Deviation of Temp Tare Mean 24 hr. Relative Humidity (%) Tare Standard Deviation of RH Date Received Exposed (MST) Exposed Equilibration Time Exposed Analysis (MST) Time (MST) P Airtech-Denver 2 07/14/ :30 07/17/ : /07/ /07/ :24 09/08/ : P Airtech-Denver 2 07/14/ :30 07/17/ : /07/ /07/ :24 09/08/ : P Airtech-Denver 2 07/14/ :30 07/17/ : /07/ /07/ :24 09/08/ : P Airtech-Denver 2 07/14/ :30 07/17/ : /07/ /07/ :24 09/08/ : P Airtech-Denver 2 07/14/ :30 07/17/ : /07/ /07/ :24 09/08/ : P Airtech-Denver 2 07/14/ :30 07/17/ : /07/ /07/ :24 09/08/ : P Airtech-Denver 2 07/14/ :30 07/17/ : /07/ /07/ :24 09/08/ : P Airtech-Denver 2 07/14/ :30 07/17/ : /07/ /07/ :24 09/08/ : P Airtech-Denver 2 07/28/ :25 07/31/ : /07/ /07/ :24 09/08/ : P Airtech-Denver 2 07/28/ :25 07/31/ : /07/ /07/ :24 09/08/ : P Airtech-Denver 2 07/28/ :25 07/31/ : /07/ /07/ :24 09/08/ : P Airtech-Denver 2 07/28/ :25 07/31/ : /07/ /07/ :24 09/08/ : P Airtech-Denver 2 07/28/ :25 07/31/ : /07/ /07/ :24 09/08/ : P Airtech-Denver 2 07/28/ :25 07/31/ : /07/ /07/ :24 09/08/ : P Airtech-Denver 2 07/28/ :25 07/31/ : /07/ /07/ :24 09/08/ : P Airtech-Denver 2 07/28/ :25 07/31/ : /07/ /07/ :24 09/08/ : P Airtech-Denver 2 08/11/ :55 08/14/ : /07/ /07/ :24 09/08/ : P Airtech-Denver 2 08/11/ :55 08/14/ : /07/ /07/ :24 09/08/ : P Airtech-Denver 2 08/11/ :55 08/14/ : /07/ /07/ :24 09/08/ : P Airtech-Denver 2 08/11/ :55 08/14/ : /07/ /07/ :24 09/08/ : P Airtech-Denver 2 07/14/ :30 07/17/ : /07/ /07/ :24 09/08/ : P Airtech-Denver 2 07/28/ :25 07/31/ : /07/ /07/ :24 09/08/ : Lab Blank 2 07/14/ :30 07/17/ : /07/ :24 09/08/ : Lab Blank 2 07/28/ :25 07/31/ : /07/ :24 09/08/ : Exposed Mean 24hr. Temp ( C) Exposed Standard Deviation of Temp Exposed Mean 24hr. Relative Humidity (%) Exposed Standard Deviation of RH Tare & Exposed Temp Difference Tare & Exposed Humidity Difference Receipt Temp Upon Arrival ( C) Tare Mass (mg) Exposed Mass (mg) Net Mass (mg) Comments
40 PQ100 Ambient Air Particulate Sampler QA/QC % diff. = [(deltacal -sampler)/deltacal ]x100 Site # Date 8/11/2017 8/11/2017 8/11/2017 8/11/2017 Time 13:55 14:10 14:20 13:45 Flow Rate (LPM) Sampler: DeltaCal : % Difference: Allowed % Diff.: 4% 4% 4% 4% Pass X X X X Fail Ambient Temp. (C) Sampler: DeltaCal : Difference (C): Allowed Diff. (C): Pass X X X X Fail Barometric Pressure (mmhg) Sampler: DeltaCal : Difference (mmhg): Allowed Diff. (mmhg): Pass X X X X Fail deltacal S/N:152905
41 Sampling Data
42
43
44
45
46
47
48
49
50
51
52
53
54
55
56
57
58
59
60
61
62 Sampling Pictures

63 Location: Site 1 GPS Coordinate: Lat: 39 46'34.00"N Long: '42.50"W

64 Location: Site 2 GPS Coordinate: Lat: 39 46'42.60"N Long: '28.30"W

65 Location: Site 3 GPS Coordinate: Lat: 39 46'41.30"N Long: '19.50"W

66 Location: Site 4 GPS Coordinate: Lat: 39 46'39.10"N Long: '44.50"W