ASSESSMENT OF DRINKING GROUND WATER QUALITY AT MOGA, PUNJAB (INDIA) : AN OVERALL APPROACH
|
|
|
- Darren Webb
- 5 years ago
- Views:
Transcription
1 ASSESSMENT OF DRINKING GROUND WATER QUALITY AT MOGA, PUNJAB (INDIA) : AN OVERALL APPROACH Sunita Mittal* 1 and Sangeeta Sharma 2 1. Lala Lajpat Rai Institute of Engineering and Technology, Moga, Punjab (INDIA) 2. SBS College of Engineering and Technology, Ferozepur (INDIA) Received April 12, 2008 Accepted September 3, 2008 ABSTRACT Quality of water refers to number of physical, chemical and biological characteristics. Overall quality can be assessed mathematically by water quality index which is calculated by assigning certain weightage to important water quality parameters. The present study was conducted to assess the drinking water quality at Moga, Punjab (India) as this area lies in central Punjab where consumption of fertilizers and pesticides is the highest in the state. It was found that the major physico-chemical parameters of drinking groundwater were within the permissible limits. But certain parameters such as total dissolved solids, electrical conductivity, total hardness and magnesium content were above the WHO permissible limits at almost all the places in Moga city. Out of the total ten sampling sites, overall quality of water in terms of water quality index was found to be moderately to severely polluted at about six water sites. The water quality index was suitably modified by excluding the certain duplicating parameters. Key Words : Water quality index, Biodegradable pesticides, Effluents, Turbidity INTRODUCTION The term water quality is intimately related to water pollution. Water quality refers to physical, chemical and biological characteristics of water. The physical characteristics include the temperature, turbidity, clarity, colour and similar qualities. Chemical water characteristics include the presence of organic and inorganic substances in water. Biological characteristics of water include identity and impact of organisms * Author for correspondence which are present in water. These characteristics of water are formed not only during its penetration through the atmosphere, soil and rocks but also during its contact with the vegetation canopy and cultivation practices. Man through a variety of activities and modern technologies is dramatically changing the characteristics of groundwater systems. Various activities like intense agriculture, power generation, chemical and other industries are potential sources of groundwater contamination. The most important types of groundwater contamination are urban pollution due to seepage of municipal landfills, septic tank 129
2 effluents and drainage water, industrial pollution due to seepage of effluents, agricultural pollution due to excessive use of fertilizers and pesticides. Microbial contamination of ground water is due to the presence of biodegradable organic matter in wastewater discharges from domestic and industrial effluents. The wide range of contamination sources is one of many factors contributing to the complexity of groundwater quality and its assessment 1. Punjab is basically an agriculture dominant state, where intensity of cultivating crops in a year is quite high. This state stands 3 rd after Andhra Pradesh and Utter Pradesh in the total consumption of pesticides. Also the consumption of plant nutrients is highest (158.9 kg/ha) in this part of country. Much of the irrigation is dependent on groundwater resources. Out of the total 138 blocks of Punjab, 84 blocks are categorized as over exploited as far as groundwater resources are concerned. Most of these blocks are in central plains of the state. Central Groundwater Authority has notified 6 areas of the state for registration of groundwater abstraction structures 2,3,4. Out of the six areas notified by the Central groundwater Authority, two lie in this district. The present study has been confined to the City Moga of Punjab for assessing the groundwater quality for drinking purposes. The main objectives of the study are to determine the different physico-chemical parameters of drinking water samples collected from representative sites of the city and to find the overall quality in terms of water quality index. Lot of work has been done to assess the different quality parameters like physical, chemical and biological characteristics of the water obtained from different sources like rivers, lakes, groundwater sources, industries etc. Mariappan et al 5 (2004) analysed the physico-chemical characteristics of ground water quality in and around Sivakasi town. On the basis of water quality index, it was found that among the 20 samples, 12 samples were slightly polluted, 6 samples were slightly to moderately polluted and two samples were moderately polluted. The parameters EC, TDS, sodium, chloride, sulphate and sulphide contents were found to be high in all the samples and most of them were above permissible limits and were responsible for pollution in and around Sivakasi. Sinha and Saxena 6 assessed the drinking water quality at Hasanpur, J.P. Nagar by measuring certain physicochemical characteristics. Water quality index was calculated by giving the standard weightage to different parameters. They found that the drinking water at almost all the sites was found to be severely polluted. Only at few sites, it was moderately polluted. They opined that the water quality management was urgently required in the catchment area of the study. MATERIAL AND METHODS In the Punjab state, Moga city was selected as study area. The map of district Moga is shown in Fig. 1. The study area i.e. Moga city is situated on Ludhiana - Ferozepur road. The sites for collection of water samples were selected through the length and breadth of the Moga city. The sites were so chosen that the local sources of contamination like sewage, effluents, standing water etc. might not interfere directly with the water sites. Groundwater samples were mainly collected from Municipal tubewells. The depth of these tubewells varied from 400 to 450 feet. Groundwater samples were collected by running the tubewells for about minutes to ensure that standing water in the pipes have been taken out and normal running water has started coming out. The water samples were collected in 2 litre PET (poly ethylene terephthalate) bottles after 130
3 Water sampling site Fig. 1 : Study area of Moga City, Punjab (India) thoroughly rinsing with the same water. Temperature of the water was noted with the help of an ordinary thermometer at the site itself. For the other quality parameters, samples were immediately transferred to the laboratory and were analysed within 48 hours. Analysis of Water Samples Analysis of water samples in terms of various physico-chemical quality parameters was made. The analysis was done at the Chemistry Laboratory of the Department of Applied Sciences of Lala Lajpat Rai Institute of Engineering and Technology, Moga (Punjab) and SBS College of Engineering and Technology, Ferozepur. The main quality parameters determined were ph Value, Turbidity, Electrical Conductivity, Total Alkalinity, Total Acidity, Free Carbon Dioxide, Total Solids, Total Dissolved Solids, Dissolved Oxygen, Biological Oxygen Demand, Chemical Oxygen Demand, Total Hardness, Calcium, Magnesium, Chlorides, Total phosphates and Nitrates. These parameters were determined using the standard procedure as outlined by American Public Health Association 7 and as described in laboratory manual on Water and Waste Water Testing 8,9. Tiwari and Mishra 10 considered the different physico-chemical and biological water quality parameters for the calculation of water quality index (WQI). Quality rating of different parameters was calculated by using the following equation Vo Vi Qi V V Where V o = Observed value of parameter V s = Standard value (Table 1) V i = Ideal value V i for ph and dissolved oxygen should be taken as 7.0 and 14.6 respectively. For all other parameters, it should be taken as zero. Unit weight (w i ) for various parameters is inversely proportional to the recommended standard (S i ) for the corresponding parameter. w i = K/ S i s i 131
 Water quality is judged by the value of WQI using the Table 2.")
.")

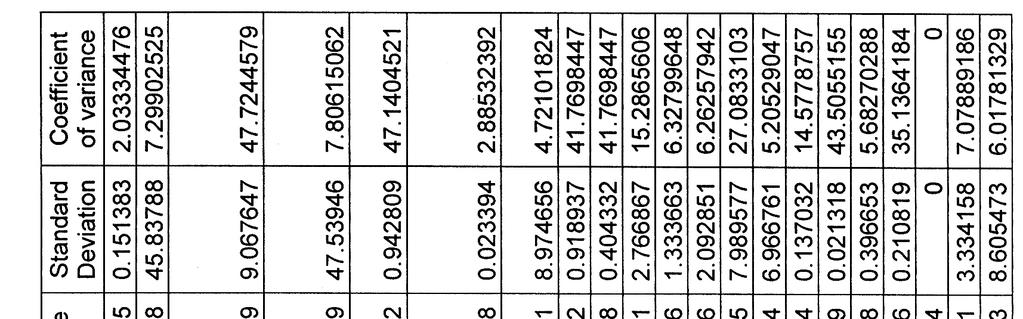
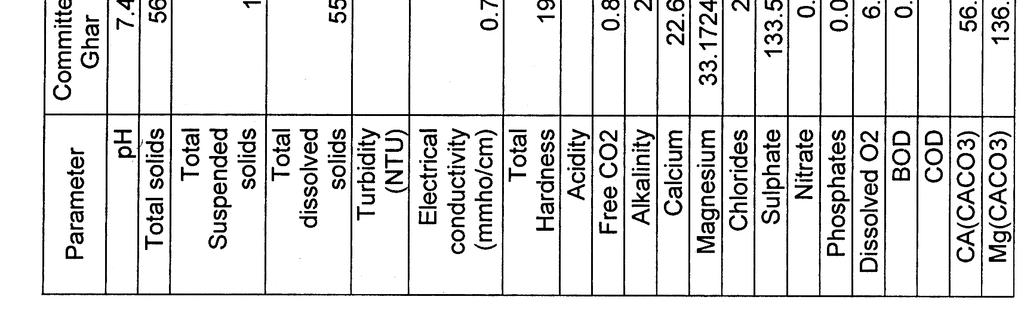
4 Where K = Constant i n w i i 1 K 1 1 i n [ 1/ i 1 Sub indices (SI) I = (Q i ) wi The overall WQI is calculated by taking geometric mean of these sub indices. WQI i n i 1 SI i S i = i ] n i 1 ( Q ) Water quality is judged by the value of WQI using the Table 2. RESULTS AND DISCUSSION Data related to various physico-chemical parameters of water samples collected from various representative sites is presented in i wi calcium, chlorides, sulphates, nitrates, DO and BOD were within the permissible limits as set by WHO (Table 1). The Total dissolved solids (TDS) and Total suspended solids (TS) in all the water samples were well above the permissible limits of 500 mg/l. This shows the presence of some inorganic and organic salts in the drinking water of Moga. As there is positive correlation between electrical conductivity (EC) and TDS, EC limits were also higher than the permissible limits of mmho/ cm. The values of total hardness as CaCO 3 ranged from 179 mg/l to 204 mg/l, well above the WHO permissible limits of 100 mg/l. This shows that the water of Moga is quite hard. As far as calcium concentration is concerned, it was well below the WHO permissible limit of 75 mg/l, but the concentration of magnesium was slightly Committee Ghar B us S tand Dosanjh Road G odhew ala Bhim N agar Civil Hospital Zira Road Amritsar Road Geeta Colony Shahidi Park W ater Quality Index Fig. 2 : Water Quality Index (By Tiwari Fig. 3 : Modified Water Quality Index at et al) at different places in Moga, different places in Moga, Punjab, (India) Punjab, (India) Table 3. Most of the parameters such as ph, above the WHO permissible limit of 30 total suspended solids, turbidity, free CO 2, mg/l. Table 1 : World Health Organization (WHO) standards for drinking water quality (maximum permissible limits) 132
5 Parameter ph value (8.0) Turbidity, NTU 5.00 Electrical Conductivity, mmhos/cm Total alkalinity Total solids Total dissolved solids Dissolved oxygen (minimum) 5.00 Biological Oxygen Demand 6.00 Chemical Oxygen Demand Total Hardness (CaCO 3 scale) Calcium 100 Magnesium Free CO Chloride Nitrates (as NaNO 3 ) 45 Total Phosphates 0.1 WHO Standard All the values in above table are in mg/l except for ph, turbidity, electrical conductivity. Table 2 : Quality rating of water on the basis of WQI (by Tiwari and Mishra, 1985) Range Quality <50 Fit for human consumption Moderately polluted Excessively polluted >100 Severely polluted Water Quality Index The water quality index (WQI) gives overall quality of water on the basis of large number of physico-chemical characteristics of water. The values of WQI of water samples collected from different areas of Moga are presented graphically in Fig. 2. From this figure, it is clear that the water quality of two areas namely Gita Colony and Shahidi Park is fit for drinking purposes as WQI value is below 50. For the Bus stand area also, water quality was fit for drinking as WQI value was At places such as Committee Ghar, Bhim Nagar and Amritsar Road, the water was moderately polluted as the WQI values remained below 80 but above 50. But the areas such as Dosanjh Road, Godhewala, Civil Hospital and Zira Road were excessively polluted as their water quality index ranged from 80 and
6 134
7 As clear from the various physico-chemical properties, water quality was mainly polluted due to TDS, TS, electrical conductivity, total hardness and magnesium content. All these parameters were included for calculating the WQI. But the parameters such as TDS, TS and electrical conductivity are positively correlated as discussed earlier. Similarly total hardness, calcium and magnesium are also positively correlated. When taking these parameters individually for calculation of WQI, weightage is given to each of them, which helped in increasing the value of WQI i.e. decreasing the water quality. So it is better, if only one parameter from TDS, TS and electrical conductivity and one from total hardness, calcium and magnesium content is taken for calculation of WQI. This modification is discussed in next section. A new water quality index was calculated by excluding certain duplicating parameters as discussed above. The values of modified WQI are presented graphically in Figure 3. From the figure, it is quite clear that out of total 10 sampling sites, six were having WQI below 50 indicating that the water quality is good and fit for drinking purposes. In the remaining 4 sampling sites, WQI value ranged between 50 and 80. It indicates that the water quality was slightly inferior and water was slightly polluted. CONCLUSION 1. The majority of the physico-chemical parameters of drinking groundwater at different places in Moga were within the permissible limits. 2. The parameters such as total solids, total dissolved solids, total hardness, electrical conductivity and magnesium content for almost all the water samples collected from different places were above the permissible limits. 3. There was wide variation in the overall quality of water as indicated by the values of water quality index. For certain areas such as Gita Colony and Shahidi Park, WQI was below 40 indicating very good water quality for drinking where as for other areas such as Zira Road, Dosanjh Road and Godhewala, WQI approached 100, indicating polluted water. 4. The water quality index was modified so that the duplicating parameters can be excluded. There is positive relationship among total solid, total dissolved solids and electrical conductivity. Similarly total hardness, calcium and magnesium content could be replaced by just one parameter in place of three. The modified water quality index gave better results, as its values were lower indicating better quality. But the trend in variation of the WQI values was similar. ACKNOWLEDGEMENT The Authors are thankful to the Principals of LLRIET Moga (India) and SBSCET, Ferozepur (India) for allowing to use the facilities in the Chemistry laboratories. REFERENCES 1. Agarwal S.K., Water Pollution. A.P.H. Publishing Corporation, New Delhi (2005). 2. Anonymous, Some Critical Issues on Groundwater in India, A Report by Centre for Water Policy, 86-D, AD Block, Shalimar Bagh, Delhi (2005). 3. Anonymous, Areas Notified for Ground Water Regulation, Central Ground Water Authority, Available: ity_area.htm (2007) 135
8 4. Anonymous, Groundwater resources of Punjab, Available: punjabsewa. gov.in/citizen-services (2007) 5. Mariappan V. and others, Analysis of physico-chemical characteristics of ground water quality and quality index in and around Sivakasi town, in Water Pollution by Arvind Kumar published by A.P.H Publishing Corporation, N.Delhi. (2004) 6. Sinha D.K. and Saxena R., Assessment of drinking water quality at Hasanpur, J.P. Nagar : A Mathematical Approach. Indian J. Env. Prot., 26(2),163-68, (2006). 7. Anonymous, Standard Methods for the Exam of Water and Wastewater, American Public Health Association publication, 4 th Edition. (1995) 8. Mathur R.P., Water and Waste Water Testing (laboratory manual) published by Nem Chand and Bros Roorkee , (1999) 9. Anonymous, Operational manual for water quality testing laboratories, Nation Drinking Water Mission, Department of Rural Development, Government of India. (1990) 10. Tiwari T.N. and Mishra M.A., preliminary assessment of water quality index of major Indian rivers, Indian J. Env. Prot., 5(4), , (1985). INSTRUCTIONS FROM PUBLISHERS It is a condition for publication that the authors must give an undertaking in the writing at the time of submission of papers that the manuscripts (research papers) submitted to JERAD have not been published and have not been submitted for publishing elsewhere, manuscripts are their original work. Furthermore, it should also be noted that the manuscript will not be returned in any case, whether accepted or rejected. Acceptance of research article will be communicated to authors in due course of time. 136