Programs to Resolve Agricultural Water Quality Issues the Kiwi Perspective. Tom Cochrane University of Canterbury, New Zealand
|
|
|
- Winifred Little
- 5 years ago
- Views:
Transcription
1 Programs to Resolve Agricultural Water Quality Issues the Kiwi Perspective Tom Cochrane University of Canterbury, New Zealand
2 Outline Background on New Zealand (NZ) Water quality issues in NZ Monitoring Legislation Programs Further research

3 Where is New Zealand?

4

5 All Blacks Rugby world cup champions

6 Sailing successes or near successes

7 Land of the Lord of the Rings / Hobbit (middle earth)


8


")
9 Lots of sheep and kiwi s (mostly the fruit kind)


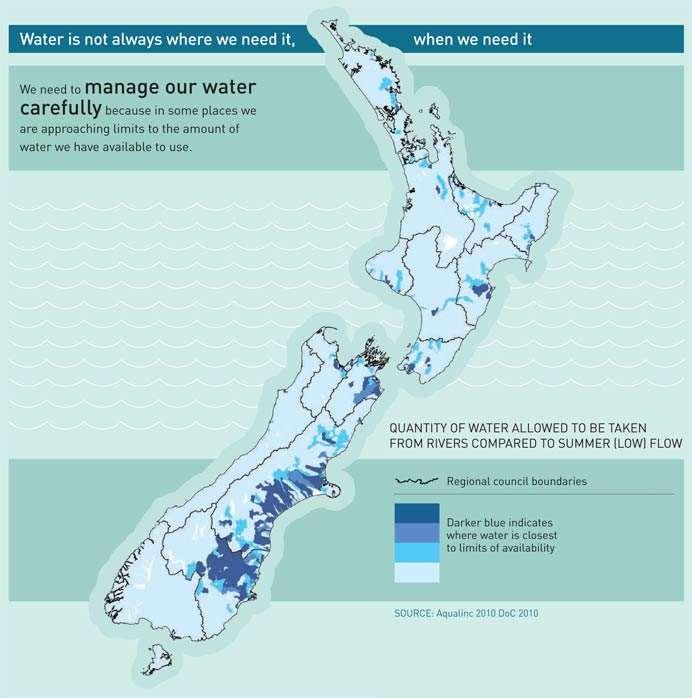
10 Lots of water
11 Agriculture in New Zealand Largest dairy and sheep meat exporter in the world. Major global supplier of beef, wool, kiwifruit, apples and seafood. New Zealand-grown produce feeds over 40 million people, with 7,500 animal products and 3,800 dairy products going to 100 countries every month.

12 NZ productivity Pasture irrigation
13 Dairying in New Zealand 1. Pastoral farming 2. No government subsidies 3. Technological innovation 4. Value chain efficiency New Zealand agri-technology solutions, such as herd improvement, software, pasture mapping and management are being integrated into on-farm practices, maximising increases in productivity and profitability.

14 Water quality issues? Source: Ministry for the Environment, NZ.
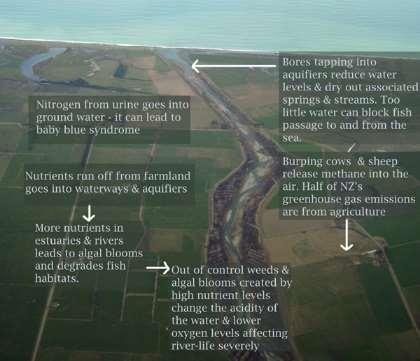
15 Potential consequences??
16 Monitoring Water quality
 Physico - chemical variables: dissolved oxygen, temperature, ph, conductivity Optical variables: Visual clarity, turbidity, coloured dissolved organic matter Nutrients: Total and dissolved")
17 National River Water Quality Network (NRWQN) reliable scientific information on many important physical, chemical, and biological characteristics of a selection of the nation s river waters (since 1989) Physico - chemical variables: dissolved oxygen, temperature, ph, conductivity Optical variables: Visual clarity, turbidity, coloured dissolved organic matter Nutrients: Total and dissolved forms of nitrogen and phosphorus Microbial Indicator: E. coli (since 2005). measure several biological indicators of water quality, specifically macroinvertebrates and periphyton. Dissolved oxygen, temperature and visual clarity are collected directly while in the field.

18
19 Integrated catchment management a way of thinking about community interactions Outreach Community Expectations Governance Research knowledge ICM Government Policy Consulting
20 Legislation

21 The RMA (Resource management Act). managing the use, development and protection of natural and physical resources in a way, or at a rate which enables people and communities to provide for their social, economic, and cultural wellbeing and for their health and safety while- (a) Sustaining the potential of natural and physical resources (excluding minerals) to meet the reasonably foreseeable needs of future generations; and (b) Safeguarding the life-supporting capacity of air, water, soil, and ecosystem; and (c) Avoiding, remedying or mitigating any adverse effects of activities on the environment
22 Dairying and Clean Streams Accord (2003) Dairying and Clean Streams Accord (the Accord) set targets to: exclude 90% of dairy cows from waterways by 2012; ensure that 90% of regular stock crossings over waterways are by bridge or culvert by 2012; achieve 100% compliance with effluent discharge regulations by 2003; ensure that all dairy farms have systems in place to manage nutrient inputs and outputs by 2007; and protect 50% of regionally significant wetlands by 2005 and 90% by 2007
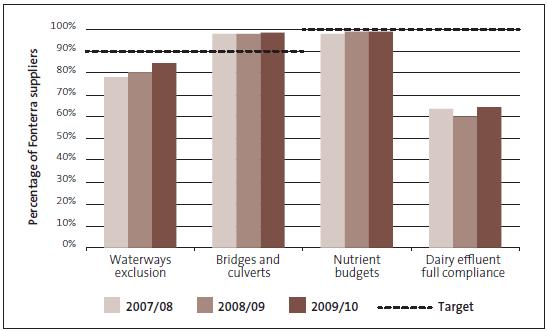
23 Achievement of targets
24 Cleaning up and protecting fresh water In 2010, the Government introduced regulations that require 98 per cent of water taken directly from its source to be metered by This will help councils more accurately account for the amount of water in use or available in their region. Penalties under the RMA have doubled for anyone taking, damming or diverting water or discharging contaminants if it is not allowed by the regional council s plan. In 2011, the Government introduced a National Policy Statement for Freshwater Management (NPS-FM) to require regions to maintain or improve water quality. The NPS-FM was updated in 2014 to require regional councils to account for all water takes and sources of contaminants. It sets national minimum acceptable standards of water quality for ecosystem and human health. Water conservation orders can be used to protect a waterway s water quality, amenity values, or significant natural characteristics and habitats.

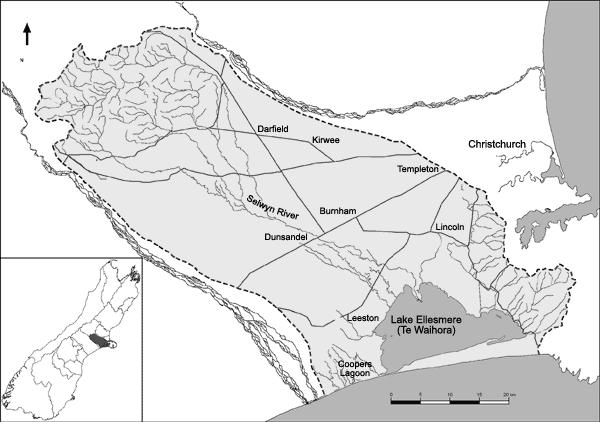
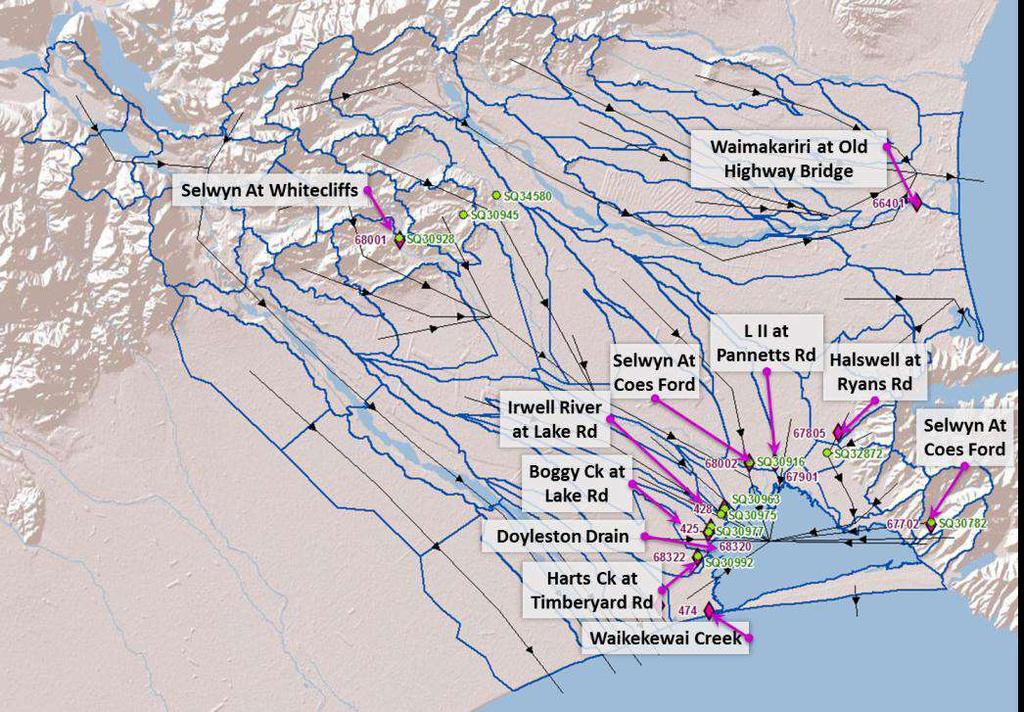
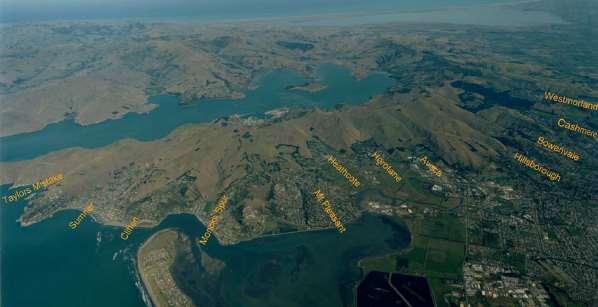
25 Example program: Lake Ellesmere / Te Waihora To resolve agricultural water quality issues
26
27

28 Lake Ellesmere / Te Waihora
29 Major modelling initiatives to address water quality issues Groundwater Nutrient budgeting Irrigation scheduling Other sediment sources

30 Groundwater flows
31 Groundwater modelling

32

33 OVERSEER - Nutrient Budgets OVERSEER is a software application that supports farmers and growers to make informed strategic management decisions about their nutrient use onfarm to improve performance and reduce losses to the environment.


34 Irrigation scheduling Optimizing water applications
35 Shading to reduce weed growth Photo courtesy CAREX University of Canterbury

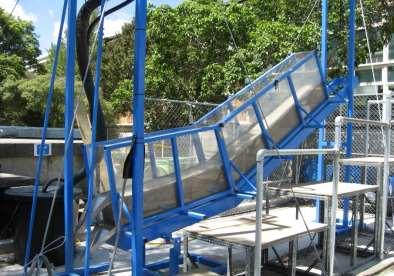
36 Sand wand - sediment remover Photo courtesy CAREX University of Canterbury
37 Other sediment/nutrient sources
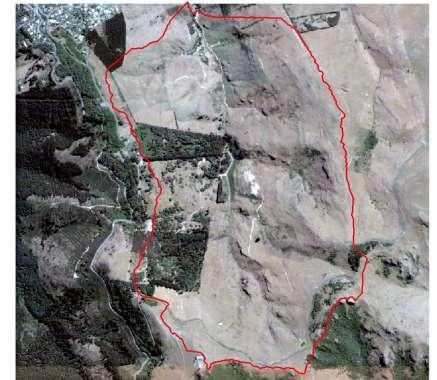

38 Understanding steep watershed sediment yields


39 Monitoring sediment discharge " $ $ 10 9 ²" Rain and stream gauge stations $ 8 # $ $ $ $ $ 3 $ 2 $ 1 # Turbidity sensor $ Soil moisture sensors Study area Channel network Meters

40 Landslide predictions Impacts on channel network landslide and soil redistribution prediction: Disturbed area Failure depth estimation

41 Combined landslide and erosion predictions Erosion modelling WEPP SLIP pre and post landslide


42 Nonpoint Source Pollution and Aquatic Ecosystem Restoration Modelling Effects of Agricultural Land Use on Water Quality in High Country Tussock Grassland Catchments Evaluation of the Effectiveness of New Zealand Water Resources and Aquatic Ecosystem Restoration Programmes
43 Example program: Rural Urban interface Hayton s stream

44 Hayton s Stream, Rural - urban interface

45 Sampling Sites
46 Nitrogen cycle in water Conc. Time (or distance downstream) Characterize the composition of nitrogen in terms of: DON: Dissolved Organic Nitrogen PON: Particulate Organic Nitrogen ( >0.45 µm) NOx-N; Oxidized Nitrogen NH 4 -N: Ammoniacal Nitrogen
47 NOx-N Concentration (mg/l) NOx-N along Haytons Stream Baseflow Stormflow Site number Site number ANZECC trigger value = mg/l
48 TN concentration (mg/l) TN along Haytons Stream Baseflow 40 Nitrogen composition (mg/l) PON DON NOx-N 20 NH4-N Site number
49 TN concentration (mg/l) TN along Haytons Stream Nitrogen composition (mg/l) Stormflow PON 40 DON NOx-N NH4-N Site number
50 Lessons learnt Organic nitrogen stormflow ; inorganic during baseflow 90% had NOx-N higher than guidelines; 35% NH4-N higher than toxic levels The wetland s role to control nitrogen and ph is important

51 Over all challenges Further research needed in understanding In-channel nutrient and sediment processes as affected by seepage and drainage conditions Spatial and temporal changes in nutrient compounds Effectiveness of treatment systems and ecosystem restoration initiatives

52 Questions?