Ag In Uncertain Times
|
|
|
- Derrick Quinn
- 5 years ago
- Views:
Transcription


1 Ag In Uncertain Times AAEA Extension Section Webinar Inflated Expectations, Unfulfilled Mandates, and Cost-Efficient Feedstock Systems for Cellulosic Biofuels What s a Farmer to do? Brought to you by the AAEA Extension Section and the Western Extension Committee. Technology hosted by Montana State University.


2 Ag In Uncertain Times Jeff Tranel Webinar Implementation Team Duane Griffith Ramiro Lobo John Hewlett Trent Teegerstrom Bob Craven John Nelson & Jon Newkirk A project of the Western Extension Committee and many others.

3 Our emcee for today is: John Hewlett Farm/ranch Management Specialist University of Wyoming
4 Today s Speakers Dr. Francis Epplin Dept. of Agricultural Economics Oklahoma State University Dr. Cole Gustafson Dept. of Agribusiness and Applied Economics North Dakota State University

5 Using the Question and Answer (Q & A) To ask a question, click inside this box and type your question. Window When done typing, click this button to send the question.
6 Not a member of AAEA or the AAEA Extension Section? Consider joining today at Want to learn more about the Extension Section? Check out
7 The Full Screen button toggles between using your entire screen or viewing the presentation and the Q & A Chat Window. Try It!
8 Questions For Audience. Please respond to the poll questions as they appear on the screen.
9 Inflated Expectations, Unfulfilled Mandates, and Cost-Efficient Feedstock Systems for Cellulosic Biofuels Francis Epplin Department of Agricultural Economics Oklahoma State University AAEA Extension Section Webinar 11 am Central April 20, 2011
10 Energy Corn Ethanol Cellulosic Ethanol Drop-In Fuels What is a farmer to do? Issues
11 Energy U.S. Crude Oil Use 19.1 million barrels per day in 2010
 Accounts for about 38% of U.S. Energy Use")
12 How Much is 19.1 Million Barrels of Crude Oil? Daily U.S. use (2010) Accounts for about 38% of U.S. Energy Use

13 BP Deepwater Horizon Macondo Spilled crude oil for 87 days April 20 July 15, 2010 Estimated 4.9 million barrels spilled How much was leaked relative to U.S. use? Equivalent to 6 hours of U.S. use
14 Energy Issues 19.1 Million Barrels / day 6 hours (2010 Gulf Oil Spill) Corn Ethanol Cellulosic Ethanol Drop-In Fuels What is a farmer to do?
15 Why corn ethanol? Historical context --- To address the excess capacity problem in U.S. agriculture
16 Corn Ethanol billion gallons of ethanol from grain Contained gross energy equivalent to 9 days of U.S. crude oil use Diesel tractors, combines, and trucks don t use ethanol blends
17 Corn Ethanol 2010 corn crop billion bu If every bu had been converted to ethanol it would contain gross energy equivalent to 24 days (6.6%) of U.S. crude oil use
18 Energy Issues 19.1 Million Barrels / day 6 hours (2010 Gulf Oil Spill) Corn Ethanol 9 days (2010) Cellulosic Ethanol Drop-In Fuels What is a farmer to do?
19 Cellulosic Ethanol 1910 Standard Alcohol Company built a cellulosic ethanol plant in South Carolina to process waste wood from a lumber mill, sold to DuPont who operated it until after WW I. (Source: Sherrard, E.C. and F. W. Kressman Review of Processes in the United States Prior to Wold War II. Industrial & Engineering Chemistry 37:5-8.) 1940s During WW II a cellulosic ethanol plant was funded by the Government as an insurance plant, in case of grain shortage. Economics was a secondary consideration during wartime
20 The Promise of Cellulosic Ethanol Convert waste to fuel Some early proponents projected feedstock cost to be close to zero. Some projected a tipping fee; expected that owners of waste would be willing to pay for someone to use it.
21 The Promise of Cellulosic Ethanol (one example) Science Lynd et al. (1991) hypothesized that by the year 2000, technology would be developed enabling the production of cellulosic ethanol for a wholesale selling price of $0.60 per gallon (1985 $) ($1.22 in 2010 dollars).
22 U.S. Energy Independence and Security Act of 2007 (EISA) Renewable Fuel Standards 2 RFS2 Mandated use of biofuels these mandates are conditional on production or production capacity
23 U.S. Energy Independence and Security Act of 2007 (EISA) Why mandates? Experts proclaimed it was doable Means to ensure a market by requiring existing system to use biofuels if produced Guaranteed market was expected to facilitate investment in biorefineries

24 EISA RFS2 Mandates Source:
25 U.S. Energy Independence and Security Act of 2007 (EISA) Cellulosic ethanol mandates ,000,000 gallons ,000,000 gallons
26 Unfulfilled Mandate Cellulosic Ethanol 2010 mandate 100,000,000 gallons EPA reduced to 6,500,000 gallons 2011 mandate 250,000,000 gallons EPA reduced to 6,600,000 gallons
27 RFS2 Mandates for Cellulosic Ethanol Cellulosic Ethanol (million gal) Original Mandate Revised Mandate Year
28 Failure to Meet Cellulosic Ethanol Mandate Why? Conversion cost targets were not achieved Best of several competing technologies for conversion remains to be determined
29 Cost Kazi et al. (2010) Evaluated Eight Alternatives for Producing Cellulosic Ethanol Lowest Cost Production System Estimated Cost - $5.13 / gallon gasoline equivalent Kazi, Fortman, Anex (Iowa State); Hsu, Aden, Dutta (NREL); Kothandaraman (ConocoPhillips) (Fuel )
30 Failure to Meet Cellulosic Ethanol Mandate Why? More costly to produce than anticipated Blend wall
31 Blend Wall 2010 U.S. used billion gallons of gasoline and blends that contained 13.2 billion gallons of ethanol When blends were limited to 10%, mandated levels of corn ethanol approached limit flex fuel and 2001 and newer vehicles may use E15 if a source can be located
32 Reasons to Move Beyond Ethanol Ethanol is not an ideal liquid fuel substitute in a country with infrastructure and vehicles designed to use gasoline, diesel, and jet fuel. Less energy dense Mixes with water Can t be moved practically through U.S. pipeline system Requires splash blending or blender pumps Has higher vapor pressure Cost?
33 Reasons to Move Beyond Ethanol Other potential drop-in biofuels produced from cellulosic feedstock may be more economical
34 Energy Issues 19.1 Million Barrels / day 6 hours (2010 Gulf Oil Spill) Corn Ethanol 9 days (2010) Cellulosic Ethanol Unfulfilled expectations Drop-In Fuels What is a farmer to do?
35 Drop-In Biofuels The ideal drop-in invisible to the operator meet fuel performance requirements of existing engines require no change to the current stock of engines could be mixed or alternated with petroleum fuels (wouldn t encounter a blend wall) require no change to the infrastructure be economically competitive
36 Example Drop-In Biofuel fast pyrolysis of cellulosic biomass to bio-oil upgrading of the bio-oil to naphtha and diesel range fuels. Wright et al. (2010) estimate production cost of $2.11 per gallon of gasoline equivalent for the n th plant (Of course this estimate may be as overly optimistic as the 1991 estimate of cellulosic ethanol production cost of $1.22.)
37 Potential Feedstocks for Drop-In Biofuels Implications for agriculture if technology bypasses cellulosic ethanol? Crop residues and perennial grasses are also potential feedstocks for drop-in biofuels
38 Potential Feedstocks Municipal solid waste Forest residue Sugarcane bagasse Crop residue (corn stover, wheat straw) Dedicated energy crops Perennial grasses (switchgrass, miscanthus) Energy sorghum Energy cane
39 Potential Feedstocks If the technology can use any of the feedstocks, expect entrepreneurs to locate plants near what they consider to be an inexpensive source of feedstock The least-cost source will be used first

40 Quantity of Feedstock Required for a 2,000 tons per day Biorefinery 350 days of operation per year 700,000 tons of biomass per year 17 dry tons per truck 118 trucks per day 24 hours per day 4.9 trucks per hour
41 Biorefineries For 16 billion gallons per year tons/day plants 5 trucks / hour each tons/day plants 10 trucks / hour each

42 EPA Projections of Cellulosic Biorefineries to Fulfill RFS2 Mandates One projection
43 Challenge for Biorefineries Highly coordinated harvest system Efficient system to provide a flow of biomass throughout the year from thousands of acres
44 Feedstock Flow Management 5-10 trucks/hour/plant Harvest Storage Transportation Most efficient system may differ depending on feedstock Crop residue Perennial grass
45 Contracts for Feedstock Most efficient contracting system may differ depending on feedstock Crop residue Perennial grass
46 Energy 19.1 Million Barrels / day 6 hours Corn Ethanol 9 days Cellulosic Ethanol Unfulfilled expectations Drop-In Fuels Hope What is a farmer to do? Issues
47 What is a farmer to do? Wait until a contract is offered Evaluate alternatives Request assistance from local and state Cooperative Extension Service Prior to signing a contract, prior to investing in specialized equipment, and prior to establishing a perennial grass, consider the potential for biorefinery bankruptcy
48 Energy 19.1 Million Barrels / day 6 hours Corn Ethanol 9 days Cellulosic Ethanol Unfulfilled expectations Drop-In Fuels Hope What is a farmer to do? Relax and farm Issues
49 Challenges Economically viable conversion system Profitable business model Energy is a commodity The least-cost source will be used first In the absence of policy incentives (subsidies, carbon taxes, mandates) extremely difficult to compete with fossil fuels on cost
50 Energy 19.1 Million Barrels / day 6 hours Corn Ethanol 9 days Cellulosic Ethanol Unfulfilled expectations Drop-In Fuels Hope What is a farmer to do? Relax and farm Summary

51 Acknowledgements Oklahoma Agricultural Experiment Station USDA/NIFA Oklahoma Bioenergy Center Sun Grant Initiative Biobased Products and Energy Center at Oklahoma State University
52
53 Economics of Wheat/Corn Stover Collection, Dakota Spirit AgEnergy AAEA Extension Section Webinar Dr. Cole Gustafson Dr. Thein Maung Mr. David Saxowsky Ms. Tanja Miljkovic Dr. John Nowatzki April 20, 2011


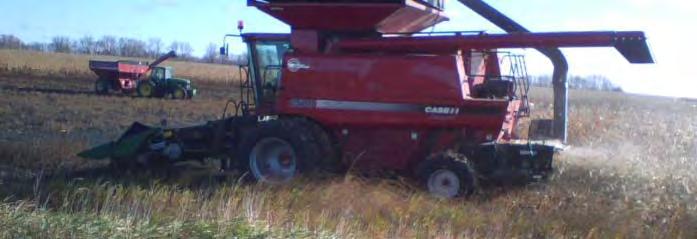
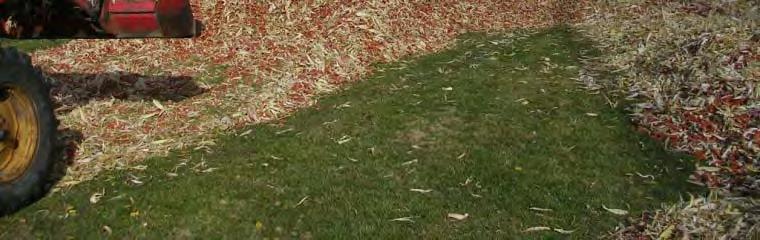
54 Dakota Spirit Ag Energy Wheat straw biorefinery Complement 99mw CHP Is wheat straw collection feasible?
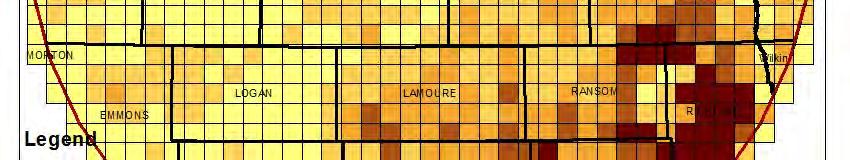
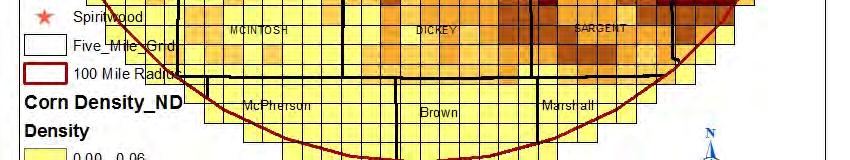
55
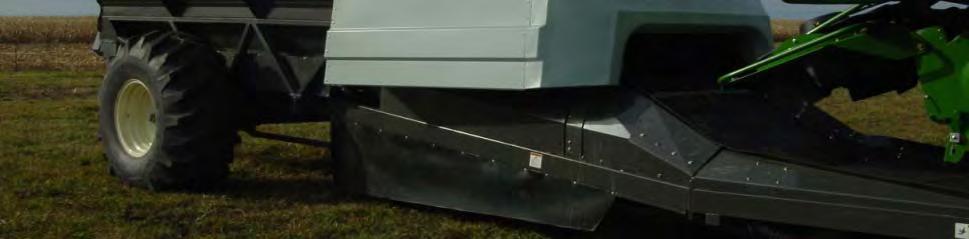
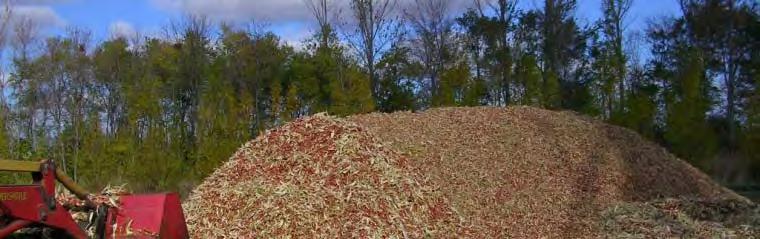
56
57 Core Questions How much wheat stover is available Are farmers willing to provide What are logistics? i
58
59
60 USDA Baseline Forecast, 2010
61

62


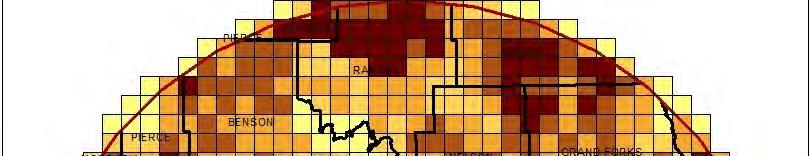
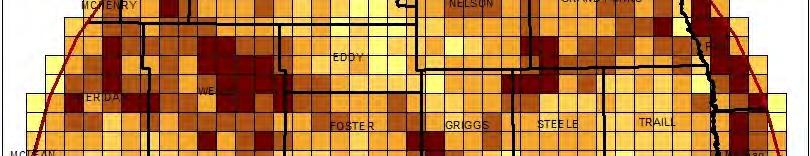
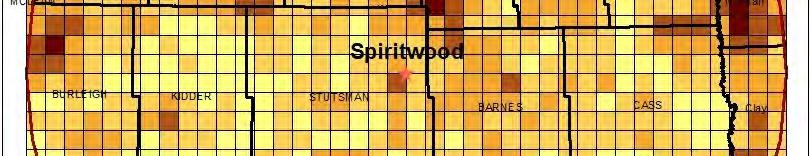
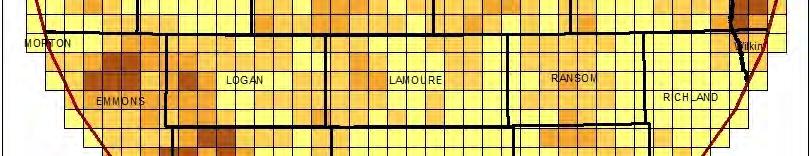
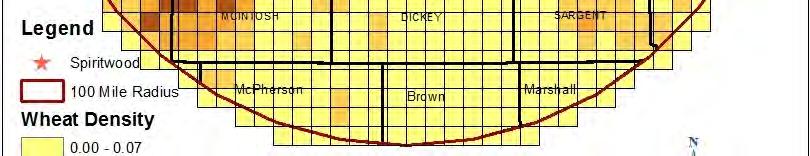
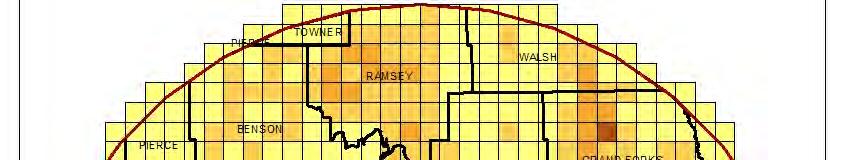
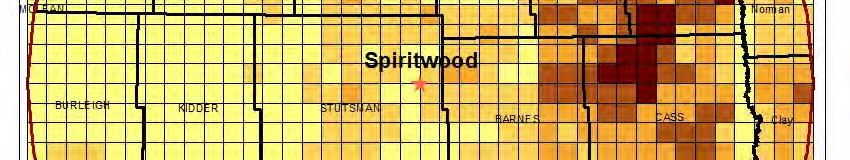
63 Top three counties with highest production of wheat Top three counties with highest production of corn
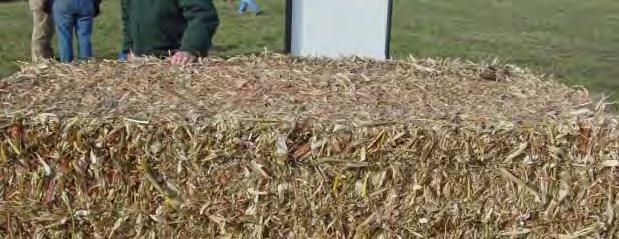
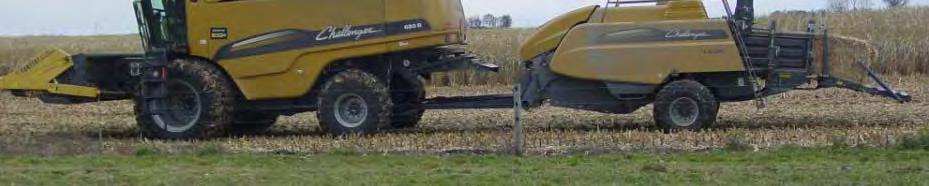
64 Potential Wheat Straw Supply 116million 1.16 tons (bone dry) 10% moisture Plant height hih34.6 Combine height 7.6 Producers are willing to supply Adequate time to harvest
65 25% 25 Mile Radius 50 Mile Radius 75 Mile Radius 100 Mile Radius State/ County Total (ton) Ton per Acre Total (ton) Ton per Acre Total (ton) Ton per Acre Total (ton) Ton per Acre ND Barnes 22, , , , Benson 22, , Burleigh 2, , Cass 9, , , Dickey 13, , Eddy 12, , , Emmons , Foster 6, , , , Grand Forks 28, , Griggs 6, , , , Kidder 4, , , La Moure 20, , , Logan 3, , , McHenry 1, McIntosh 10, , Nelson 6, , , Pierce 14, Ramsey 11, , Ransom 2, , , Richland 1, , Sargent 5, , Sheridan 1, , Steele 19, , , Stutsman 29, , , , Towner 9, Traill 25, , Walsh 48, Wells 11, , , ND Total 63, , , ,041,
66 0.8 Progression of Wheat Straw Tillage ent of Field ds Tilled Perc Weeks After Harvest
67 Farm Focus Group Table 2.7. Reasons Why Participants Do Not Collect More Straw Reason Percent Response Number of Participants Too distant to haul 0.00% 0 No market 38.89% 7 Environmental concern 11.11% 2 Fertility loss 50.00% 00% 9 Loss of wildlife habitat 0.00% 0 No time 0.00% 0 Total % 18
68 Farm Focus Group Table Most Important Factor in Decision to Sell Straw Contract Factor Percent Response Number of Participants Price 93.33% 14 Quality discounts 0.00% 0 Delivery time 0.00% 0 Distance to haul 0.00% 0 Storage payment 0.00% 0 Other factor 6.67% 67% 1 Total % 15
69 Farm Focus Group Tbl Table Pi Price of Wheat Straw Participants i t Willing to Accept Participant Number Wheat Straw ($/ton) Average 30.67
70 Farm Focus Group Table Preference for Handling Straw Preference Percent Response Number of Participants Just bale and leave in field 0.00% 00% 0 Bale and stack at road 0.00% 0 Bale, stack, and store 0.00% 0 Bale, haul part way to Spiritwood 12.50% 2 Bale, haul to Spiritwood 0.00% 0 Just sell straw 81.25% 13 Not interested at all 6.25% 1 Total % 16
71 Potential Constraints 1) Rotary Combines 2) Tenant vs. Land Owner 3) USDA/NRCS
72 Stover Harvest to Maintain Carbon Continuous Corn Corn Soybean Rotation Grain Stover Plow Chisel/ Plow Chisel/ Yield No Till No Till Bu/ac t/ac t/ac t/ac t/ac t/ac , Johnso on 2006 Source e: PRX 20


73 Questions? (701)


74 Today s Speakers Dr. Francis Epplin Dept. of Agricultural Economics Oklahoma State University Dr. Cole Gustafson Dept. of Agribusiness and Applied Economics North Dakota State University
75 Not a member of AAEA or the AAEA Extension Section? Consider joining today at Want to learn more about the Extension Section? Check out
76 What area or topic of today s seminar would you like to see covered in future webinars? Use the Q & A Chat
77 MORE For more information, speaker slide sets and to access the recorded version of this webinar, visit the AAEA Extension Section website at: Last Slide