Barnett Shale Revisited: Plan for Exposure Assessment of Emissions from Unconventional Oil and Gas Development and Production
|
|
|
- Wilfrid Peters
- 5 years ago
- Views:
Transcription


1 Barnett Shale Revisited: Plan for Exposure Assessment of Emissions from Unconventional Oil and Gas Development and Production Tiffany Bredfeldt, Ph.D. Senior Toxicologist, Toxicology Division

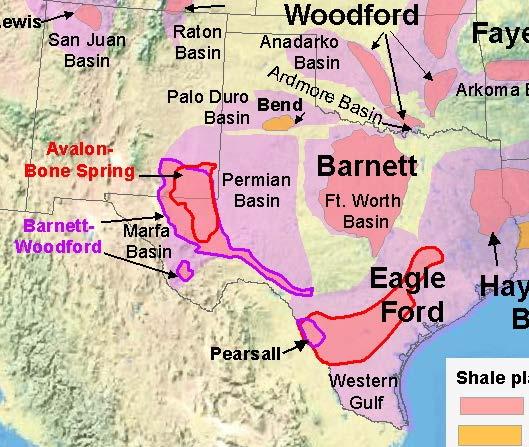
2 Background Information Over the past decade horizontal drilling and hydraulic fracturing technology developed rapidly Barnett Shale Formation was the first field to be developed, as the technology was primarily developed there The Barnett Shale Formation and other formations in Texas are among the largest in the world Exponential growth near heavily populated, urban areas has lead to increased public concern regarding impacts on human health and welfare
3

4

5 Problem Formulation and Risk Management Many unknowns were present during the rapid development in the Barnett Shale Area The agency employed many techniques to characterize risk: IR Camera and helicopter flyovers Emissions inventories Mobile monitoring trips Field investigations Fixed-site monitors

6 Helicopter Mounted IR Camera: Source Detection/Identification Flyovers were conducted in 2007 and 2010 The 2010 flyover resulted in images of over 5,000 individual storage tanks and identified 88 sources of significant hydrocarbon emissions. Flyovers conducted 3-4 times per year


7 Helicopter Mounted IR Camera: Source Detection/Identification


8 Problem Formulation and Risk Management In addition to efforts by the agency, the TCEQ also worked in collaboration with the public to address concerns: Reduced response time to complaints to 12 hours Gave citizens canisters to collect samples when they observed odors or health effects Worked with citizens to select monitoring sites Hosted open house and public meetings
9 Process of Collecting Data Characterizing Exposure Hand held equipment often used to scan possible sources of emissions Analysis 1. Toxic Vapor Analyzers (TVA) surveys measured total volatile organic compounds (VOCs) up to 450 ppm 2. Infrared (IR) gas imaging camera surveys at oil and natural gas sources 3. Collection of air samples (grab samples or 30 min canister) Collection of air samples (grab samples or 30 min canister) Sample analyzed by gas chromatography followed by mass spectrometry (GCMS) Can be considered worst-case scenario Field investigators also recorded additional details which are integral to understanding exposure scenario
10 Approximately 6300 samples were collected in the Barnett Shale area Includes field blanks, duplicates, controls, etc. ~1600 samples were 30 min, grab, or stationary canister Samples were collected by field investigators in the region, by staff from the central office, and by citizens Additional parameters were collected to better characterize each sample Additional samples have also been collected in Eagle Ford Shale area
11 Additional data to characterize samples Location sample was collected Who collected the sample (region/monitoring team/citizen) Reason sample was collected (complaint/investigation/follow-up) Possible emissions sources Distance sample was taken from source Meteorological conditions Site-specific observations (health effects/odors) These additional detail allow for a much more comprehensive understanding of emissions and the potential for human exposures
 were sited in the area These monitors provide information")

12 In addition to short-term samples collected by canisters, fixed site monitors (canister and auto GC) were sited in the area These monitors provide information regarding long-term exposure They are also useful to provide information about background levels of chemicals in the area before and after oil and gas production and development

13
14 What We Have Found Short-term samples for carbonyls, NO x, and sulfur compounds have not detected chemicals at shortterm levels of concern. Less than 5% of VOC canister samples had a short-term, health- or odor-based AMCV exceedance. VOCs detected above an odor-based AMCV*: Isobutane, Isopentane, Isoprene, 2-Methylpentane, m & p-xylene, n-pentane, n- Propylbenzene, p-diethylbenzene, Styrene, Cyclohexane, Methylcyclohexane VOCs detected above a short-term, health-based AMCV*: Benzene, Carbon Disulfide, 1,2-Dibromoethane, Isobutane, Isoprene, Methylcyclopentane, 2-Methylpentane, n-butane, n-heptane, n-octane Citizen complaints odor and irritation
15 What We Have Found Nearly all of the issues documented arose from human or mechanical failures. These items were quickly remedied and could have been avoided through increased diligence on the part of the operator. Corrective actions amounted to little more than replacing worn gaskets, closing open hatches, and repairing stuck valves.
16 Future Directions Evaluation of trends within the data used to characterize individual samples Do these data have relationships with measured chemical concentrations? Are there trends with certain sources? Do observations vary when complaints were made? When citizens collect samples? How do the observations of short-term data relate to long-term trends?
17 Questions? Tiffany Bredfeldt Website: Problem Formulation and Risk Management Pub:


18 Problem Formulation and Risk Management