Shambala Festival CREATIVE GREEN REPORT 2017
|
|
|
- Erik Smith
- 5 years ago
- Views:
Transcription


1 Shambala Festival CREATIVE GREEN REPORT 2017


2 Shambala Festival CREATIVE GREEN KEY RESULTS 2017 Environmental assessment of: TOTAL POINTS 82 / 100 COMMITMENT 40 / 40 UNDERSTANDING 25 / 25 IMPROVEMENT 17 / COMMITMENT to the environment Policy Action plan Procurement policy Communication and engagement with key stakeholders Staff roles and responsibilities Creative programming Integration with core organisational development 25 UNDERSTANDING of the following environmental impacts 17 IMPROVEMENT towards reducing environmental impacts RELATIVE REDUCTION ENERGY EMISSIONS WATER WASTE Current vs previous year Current vs baseline year
3

4 CREATIVE GREEN HIGHLIGHTS COMMITMENT to the environment 100% renewable energy used onsite from biofuel, solar and wind. Environmental policy and Green Action Plan which scope environmental ambitions, key impact areas, goals and future actions. Sustainability integrated as part of core organisational strategy, with recognised job roles and responsibilities. Continued display of strong engagement with audiences and artists on environmental issues e.g. Green Riders; Guide for Artists; Bring a Cup campaign etc. Audience, artist, and supplier travel miles are now balanced through Energy Revolution to invest in green energy projects. Strong engagement with suppliers and traders on environmental issues e.g. annual Inspirational Trader Awards; Mandatory Trader Day; Food Traders Guide etc. Commitment to a meat-free festival following positive feedback from audiences. Work and engagement with professional and local community on environmental issues e.g. project with Invisible Dust to provide environmental workshops at schools; active engagement and leadership within Powerful Thinking and Festival Vision Creative content produced with environmental themes e.g. The Garden o' Feeden programmed around food sustainability. UNDERSTANDING of the following environmental impacts Environmental impact data used to set targets for energy, waste, recycling rates and audience travel which are include in Shambala's Green Action Plan. Site wide generator monitoring with additional monitoring and analysis of energy use for 40 catering outlets individually to help devise a pay per use model for charging. In depth understanding of water usage with waste water monitored from all daily collections and water supplies tested throughout. Comprehensive waste monitoring with annual report detailing methodologies, observations, results and plans for Detailed monitoring of audience and business travel and audience opting to offset miles is being quantified.

5 ABOUT CERTIFICATION CREATIVE GREEN Creative Green is more than a certification scheme - it s an international community of pioneering creative and cultural organisations, recognised for their ambition and action on environmental sustainability. With over 250 certificates awarded since its launch in 2009, Creative Green remains the only environmental certification designed specifically for the creative and cultural sector. Creative Green offers venues, museums, galleries, festivals and offices a transparent, methodical and inspiring framework for achieving environmental best practice, as well as a forum for recognition and celebration. It supports organisations environmental impact reductions through its three strands: Commitment, Understanding and Improvement. Points are accrued within each strand and a one to five star certification is awarded based on the total number gained. The methodology of Creative Green follows best practice and international standards for measurement, reporting and reduction of environmental impacts and it has been designed in partnership with arts, cultural and entertainment organisations. The continuing emphasis on carbon emissions reductions align the Creative Green community to the ambitions of the Paris Agreement, reached at COP21 in 2015, to keep global temperatures well below 2 degrees of warming. ASSESSMENT AREAS COMMITMENT Environmental policy and action plan Integration of environmental sustainability in broader business mission, strategy or planning Environmental responsibilities Environmental procurement and sourcing Stakeholder communications and engagement UNDERSTANDING Breadth and depth of understanding of environmental impacts Extent to which environmental data is used inform action and track progress in reducing impacts IMPROVEMENT Quantifiable reductions in direct environmental impacts, i.e. impacts over which an organisation has direct control such as energy use and waste generation, both total relative impacts Actions to address indirect enviromental impacts, i.e. impacts over which an event has limited or no direct control, such as audience travel

6 RESULTS IN FULL
7 ENVIRONMENTAL COMMITMENT 40 / 40 ASSESSMENT AREAS POINTS AVAILABLE POINTS AWARDED Policy, strategy & responsibilities Procurement 5 5 Communication and engagement Total Points HIGHLIGHTS 100% renewable energy used onsite from biofuel, solar and wind. Environmental policy and Green Action Plan which scope environmental ambitions, key impact areas, goals and future actions. Sustainability integrated as part of core organisational strategy, with recognised job roles and responsibilities. Continued display of strong engagement with audiences and artists on environmental issues e.g. Green Riders; Guide for Artists; Bring a Cup campaign etc. Audience, artist, and supplier travel miles are now balanced through Energy Revolution to invest in green energy projects. Strong engagement with suppliers and traders on environmental issues e.g. annual Inspirational Trader Awards; Mandatory Trader Day; Food Traders Guide etc. Commitment to a meat-free festival following positive feedback from audiences. Work and engagement with professional and local community on environmental issues e.g. project with Invisible Dust to provide environmental workshops at schools; active engagement and leadership within Powerful Thinking and Festival Vision Creative content produced with environmental themes e.g. The Garden o' Feeden programmed around food sustainability. RECOMMENDATIONS Align with the Paris Agreement and the Sustainable Development Goals (SDGs) in Shambala's environmental policy. Continue undertaking due diligence on sourcing of biofuel, to ensure this is from sustainable sources, and exploring alternative power sourcing options where relevant. Continue rolling out the Bring a Cup campaign and explore opportunities to extend to other sources of plastic waste, e.g. audience campaign to encourage audiences to bring less of their own single-use plastic products to site. Continue audience, artist, and supplier communications around balancing travel miles through Energy Revolution, setting % targets for take-up within each group. Reconsider plans to provide guidelines for contractors to improve their sustainability practices and produce a guide similar to event manager checklist. Consider carbon offseting via Energy Revolution the carbon footprint of the festival. Consider signing up to Season for Change 2018.
8 ENVIRONMENTAL UNDERSTANDING 25 / 25 ASSESSMENT AREAS POINTS AVAILABLE POINTS SCORED Submission of energy, water, waste, transport, production 4 4 Attitudinal insights 4 4 In-depth understanding of energy, water and waste 8 8 Monitoring of other impact 3 3 Use of data for setting targets and Key Performance Indicators in policy and action plans 4 4 Evaluation of learning and outcomes 2 2 Total Points HIGHLIGHTS Environmental impact data used to set targets for energy, waste, recycling rates and audience travel which are include in Shambala's Green Action Plan. Site wide generator monitoring with additional monitoring and analysis of energy use for 40 catering outlets individually to help devise a pay per use model for charging. In depth understanding of water usage with waste water monitored from all daily collections and water supplies tested throughout. Comprehensive waste monitoring with annual report detailing methodologies, observations, results and plans for Detailed monitoring of audience and business travel and audience opting to offset miles is being quantified. RECOMMENDATIONS Continue to use environmental impact data to set meaningful KPIs for all major environmental impacts and include these in Shambala's Green Action Plan. Continue the work you have done to monitor the energy use of individual traders increasing the number of traders monitored. Assess the benefits of continuing to use Grist's MRF to analyse waste next year. Explore the possibility of undertaking a waste audit in partnership with food traders and catering, to gain a better understanding of food waste and how this might be diverted. Provide details on Shambala's travel offsetting with Energy Revolution, including figures for miles offset for audiences, artists, suppliers and business travel. Investigate the possibility of undertaking an ecological impact assessment to better understand species on site and whether any measures could be put in place to minimise disturbance to them.

9

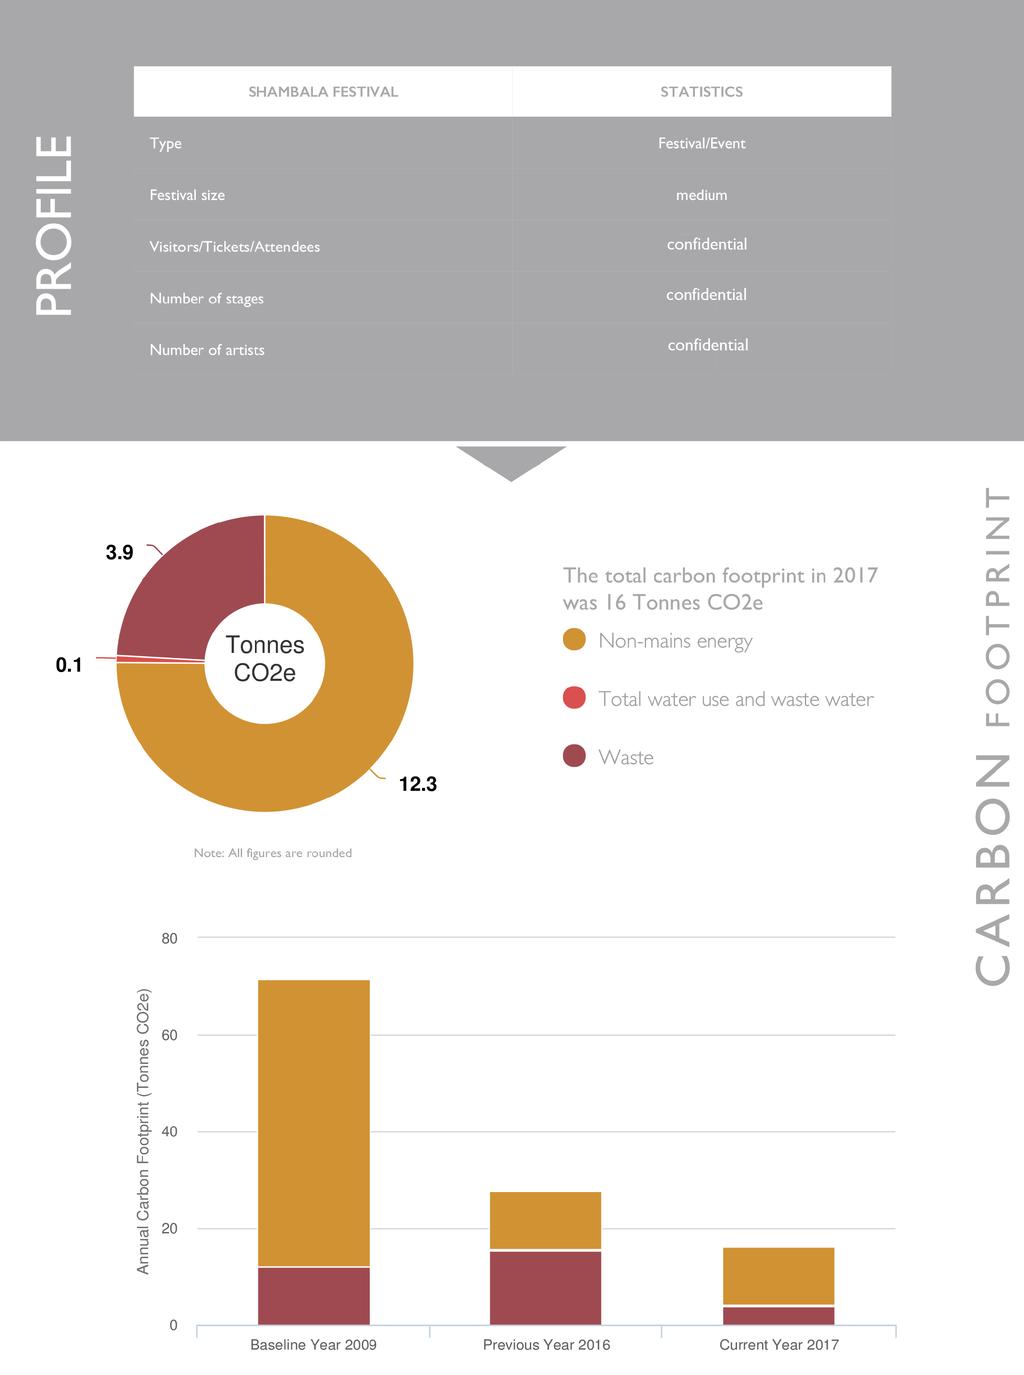
10 Note: two additional points have been awarded for Shambala's commitment to monitoring, reducing and offsetting both business and audience travel. ENVIRONMENTAL IMPROVEMENT RECOMMENDATIONS Total Carbon Footprint The functionality of the online report currently excludes audience travel figures from the final footprint. Shambala's total 2017 footprint is: Highlights Next Steps Total footprint: tonnes CO2e. Audience travel: tonnes CO2e. Energy use and energy use related emissions stable between 2016 and 2017 with absolute figures rising 2% and 3% respectively. Furthermore, energy use related emissions have reduced by 79% between 2009 and 2017 while energy related emissions per audience day reduced by 88%. Waste-to-landfill reduced by 80% from 2016 while waste-to-recycling increased by 64%. Exceptionally hot weather during 2017's festival resulted in increases in both water use and related waste water removals from site. Continue developing better understanding of trader energy use and use findings to further develop pay-by-use incentive plans. Continue working with power contractors to ensure generator and power monitoring data is used to manage and improve energy efficiency from year to year. Investigate further the feasibility/benefits of switching the main stage to LED lighting rigs. Explore alternative transportation methods for staff, crew, and artists on-site and for transit to site; such as electric bicycles, electric buggies, and electric or hybrid car companies. Continue to investigate paper cup recycling and aim to improve recovery rates. Investigate the increases audience travel in 2017 against the previous year.
11 ENERGY USE ENERGY USE UNIT BASELINE YEAR 2009 PREVIOUS YEAR 2016 YEAR 2017 % CHANGE VS PREVIOUS % CHANGE VS BASELINE Energy use (non-mains) -- absolute litres 23,904 24,503 25,119 2 % 5 % Energy use (non-mains) -- relative litres per Audience day % -41 % Diesel litres 16, No data No data Concession diesel litres 5, No data No data Biodiesel litres ,611 17,207 3 % No data Bottled gas litres 2,519 7,892 7,912 0 % 214 % 30k Energy consumption (litres) 25k 20k 15k 10k 5k 0k Baseline Year 2009 Previous Year 2016 Current Year 2017 Diesel Concession diesel Biodiesel Bottled gas

12 ENERGY USE Energy consumption (litres per audience day) Baseline Year 2009 Previous Year 2016 Current Year 2017
13 ENERGY USE RELATED EMISSIONS ENERGY RELATED EMISSIONS UNIT BASELINE YEAR 2009 PREVIOUS YEAR 2016 YEAR 2017 % CHANGE VS PREVIOUS % CHANGE VS BASELINE Energy use emissions (all sources) - absolute kg CO2e 59,436 12,206 12,247 0 % -79 % Energy use emissions (all sources) - relative kg CO2e per Audience day % -88 % Diesel kg CO2e 42, No data No data Concession diesel kg CO2e 13, No data No data Biodiesel kg CO2e % No data Bottled gas kg CO2e 3,784 11,878 11,907 0 % 214 % 70k Energy use emissions (kg CO2e) 60k 50k 40k 30k 20k 10k 0k Baseline Year 2009 Previous Year 2016 Current Year 2017 Diesel Concession diesel Biodiesel Bottled gas

14 ENERGY USE RELATED EMISSIONS Energy use emissions (kg CO2e per audience day) Baseline Year 2009 Previous Year 2016 Current Year 2017

15 WATER USE WATER USE UNIT BASELINE YEAR 2009 PREVIOUS YEAR 2016 YEAR 2017 % CHANGE VS PREVIOUS % CHANGE VS BASELINE Total water use and waste water m % 45 % Relative water use and waste water litres per Audience day % -19 % Water use m % 45 % Waste water m No data No data 400 Water use (m3) Baseline Year 2009 Previous Year 2016 Current Year 2017 Water use Waste water
16 WATER USE Water use (litres per audience day) Baseline Year 2009 Previous Year 2016 Current Year 2017
17 WASTE GENERATION WASTE UNIT BASELINE YEAR 2009 PREVIOUS YEAR 2016 YEAR 2017 % CHANGE VS PREVIOUS % CHANGE VS BASELINE Waste generation - absolute tonnes % 15 % Waste generation - relative kg per Audience day % -35 % Landfill waste tonnes % -83 % Energy from waste tonnes % No data Recycling tonnes % 161 % Composting tonnes % 85 % 100 Waste (tonnes) Baseline Year 2009 Previous Year 2016 Current Year 2017 Landfill Energy from waste Recycling Composting
18 WASTE GENERATION Waste (kg per audience day) Baseline Year 2009 Previous Year 2016 Current Year 2017

 - Photo")
19 Somerset House, New Wing, Strand, London, WC2R ILA +44 (0) #creativegreen Matthew Plummer-Fernandez, Peak Simulator (2015) - Photo Chris Foster - Abandon Normal Devices