LEAST COST ENERGY SUPPLY Model For A Multiple Scenario Analysis Of Northern Africa
|
|
|
- Charlene McCormick
- 5 years ago
- Views:
Transcription


1 LEAST COST ENERGY SUPPLY Model For A Multiple Scenario Analysis Of Northern Africa International Energy Workshop June 6th 2015 Oliver Broad Research Analyst Energy Modelling KTH division of Energy Systems Analysis broad@kth.se


2 CONTEXT OF THE PROJECT Background High level of natural ressources High levels of Renewable resources A long-term vision is needed to make optimal use of available domestic resources Tools have been developed to support African member countries IRENA to accelerate Africa s development 2
3 CONTEXT OF THE PROJECT The Focus Least-cost energy system modelling Appropriate tool to explore investment decisions Reach optimal energy mix & long term transition pathways with high RE Framework Northern Africa Energy Model Assess power sector investment needs Fuel economic development Public domain data What potential to offset the use of Natural gas with RE to what benefit for the region? 3
4 MESSAGE MODELLING FRAMEWORK Key Characteristics Model for Energy Supply System Alternatives and their General Environmental impacts Medium- to longterm timeframe Energy system (as opposed to power system) Optimisation (as opposed to simulation or accounting frameworks) Linear and Mixed Integer Dynamic (as opposed to static, i.e., snap shots of time) Bottom Up (as opposed to top-down, e.g., CGE, econometric or input-output models). Optimisation objective function The discounted sum of Investment cost (minus salvage costs) Fixed & Variable operation and maintenance costs Fuel costs Any additional penalty costs defined for the limits, bounds and constraints on relations 4
5 MESSAGE MODELLING FRAMEWORK Characteristics Bottom up model technology intensive Each technology can be characterised by (multiple) inputs and outputs Seasonal variation in capacity Efficiency varying with time Costs varying with time Limits on production Capacity build-up constraints Market penetration constraints Emission control Demands & load regions Defined exogenously 5
6 THE MODEL General Characteristics Model of North African states Timeframe 2010 to 2050; reporting to 2030 Technology Data Capacity data & Techno economic parameters IRENA SPLAT modelling databases Demand Industrial Rural Urban & commercial levels African Energy Outlook (AEO) 2040 calibrated to 2010 data Load regions Hourly data for Morocco & Egypt 6
7 THE MODEL The reference energy system Each country is one node Transmission lines link each node Existing & planned ICA, WB & MED Natrual gas is traded between nodes and to Europe Includes around 200 techologies 7
8 THE MODEL Scenario Development Frozen future (FF) Local gas price (incl. subsidies) No improvement in technology performance No gas sale on international market Carbon mitigated valued at 25 USD/t Progressive technology (PT) builds on (FF) Renewable Energy Technology (RET) capital costs improve Local gas prices are maintained: no opportunity cost of other fuel uses Diversification and environmental investments (DIVE) Adopts progressive environmental economics Netback pricing of Natural Gas RET development continues, the region actively diversifies its generation portfolio. Includes futures with a range of CO 2 mitigation incentives from 25-50USD/t 8


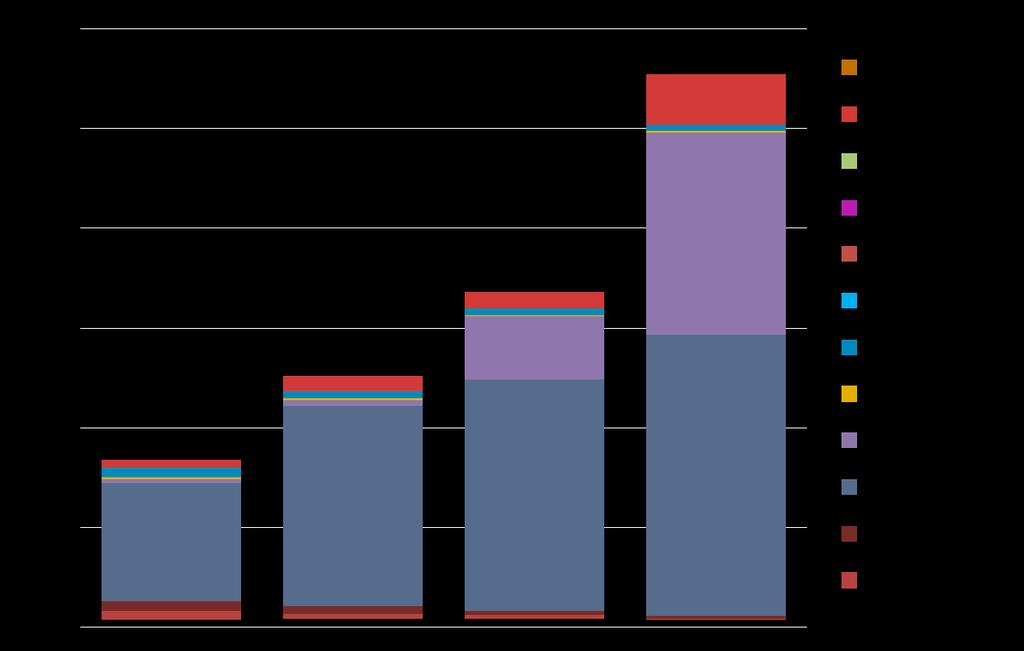
9 RESULTS Regional Capacity FF PT DIVE 9
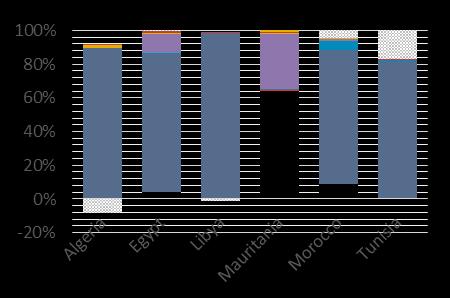

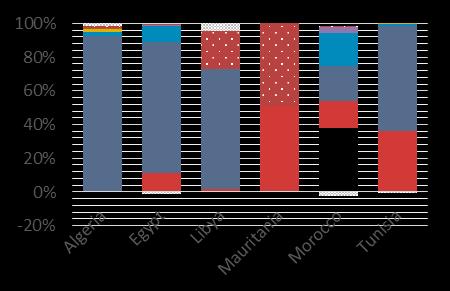
10 RESULTS Generation FF PT DIVE

11 RESULTS CO2 mitigation & Costs Potential revenue from NG increases with higher RE penetration Netback pricing Increases the cost competitiveness of RET Offsets higher annualised system costs by the sale of NG Has a potential to help mitigate CO2 emissions 11
12 CONCLUSION Food for thought So far the analysis shows that Offseting natural gas & fossil fuel use with RET in NA is possible and can be economically sound Potential benefits Economic for NA & Energy security for EU And further steps would include Further load region detail regional peak shift Including the natural gas network in the analysis Improve elements of cost data Constraints associated with intermittency 12
13 THANK YOU FOR YOUR ATTENTION