Sprinkler precipitation rates the key to controlling irrigation runoff
|
|
|
- Rafe Tucker
- 5 years ago
- Views:
Transcription


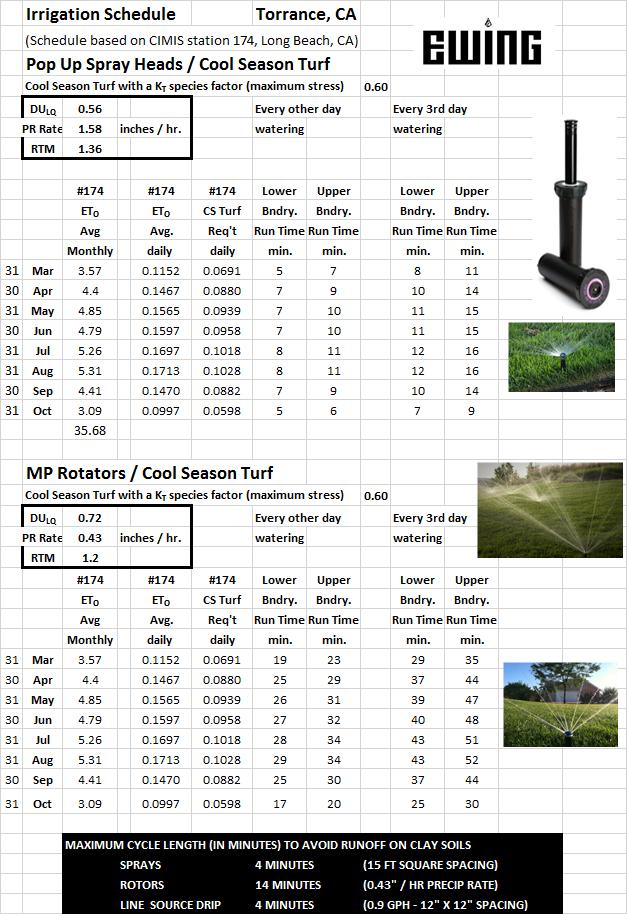
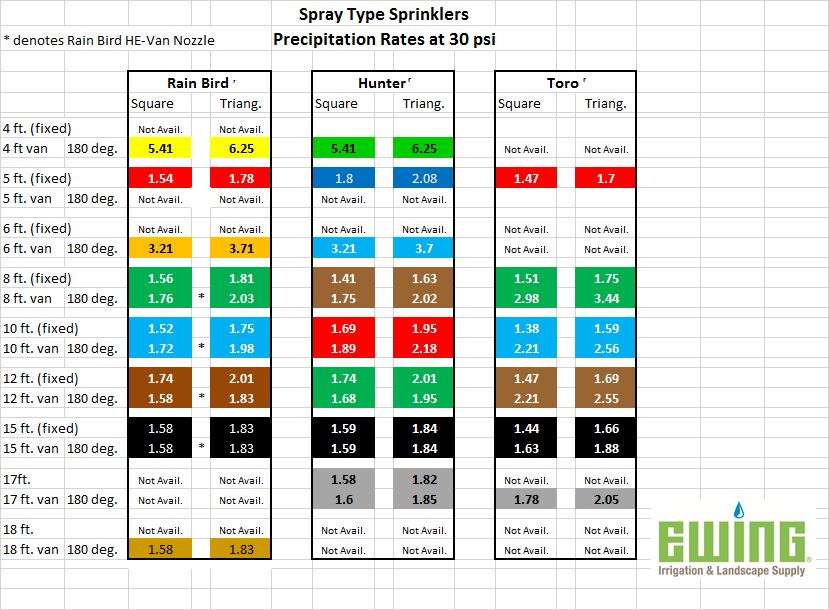
1 Redondo Beach Irrigation Systems Management September 22nd, 2016 Sprinkler precipitation rates the key to controlling irrigation runoff Spray nozzles have a high precipitation rate that frequently results in irrigation runoff. The precipitation rate will vary with pressure and spacing. At 30 psi and spaced in a square pattern the precipitation rate is 1.58 per hour. The triangular pattern has slightly higher precipitation rates due to the tighter row spacing of 13 ft. at ft. 15 ft / hr. 15 ft. 15 ft. Verify the working water pressure at the spray nozzle to be a minimum of 30 psi. In the case of the 15 Series nozzle, any pressure less than 30 psi requires a closer spacing than 15 ft. If the sprinklers are operating at psi and spaced at 15 ft there will be serious coverage (uniformity) problems. Measure water pressure as the circuit operates at the first and last sprinkler on the circuit. Verify spacing to be no greater than the radius. Sprinklers should be spaced in a square or triangular pattern with consistent spacing between heads. Test working water pressure at the first and last sprinkler with a pressure tee and gauge. Verify spacing between heads with a tape measure. At 30 psi spray heads should be spaced at no greater than their series, i.e 15 series at 15 ft, 12 series at 12 ft, etc. 1

 that can be achieved with a particular nozzle at varying pressures.")


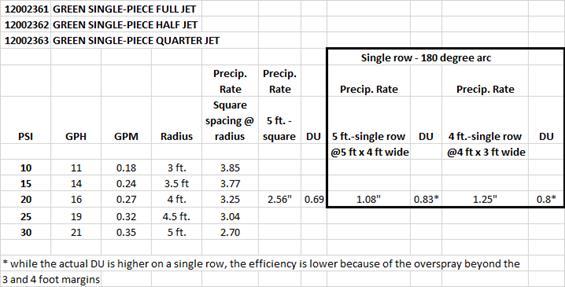
2 Rotor sprinklers rotate a single or multiple streams to achieve coverage. In general, the end of the stream from one sprinkler should hit right at the base of the adjacent sprinkler. The pressure requirement at the nozzle is dependent on the spacing and the nozzle installed in the sprinkler. Performance charts indicate a radius(spacing interval) that can be achieved with a particular nozzle at varying pressures. Generally, these sprinklers have a higher pressure requirement than spray nozzles. As a consequence low nozzle pressure is a common problem. Pressure, along with spacing must be verified in the field. Precipitation rate data may only be relied upon when pressure, nozzle, and spacing agree with nozzle performance data. These sprinklers have lower precipitation rates than sprays and therefore can be run for longer periods before runoff occurs. These charts represent precipitation rates at half circle or 180 degree setting. For full circle operation divide the chart values by 2! The pitot tube and pressure gauge are used to measure nozzle pressure which is evaluated against nozzle performance charts 2


3 Suggested maximum run times on clay soil before runoff occurs (on flat surfaces) infiltration rate " / hr spray spray spray rotors rotors rotors rotors rotor 1.6" / hr 1.8" / hr 2" / hr 0.25"/hr 0.35" / hr 0.45"/hr 0.55"/hr 0.65"/hr 4 min 4 min 4 min 24 min 17 min 13 min 11 min 9 min Suggested maximum run times on clay loam soil before runoff occurs (on flat surfaces) infiltration rate " / hr spray spray spray rotors rotors rotors rotors rotor 1.6" / hr 1.8" / hr 2" / hr 0.25"/hr 0.35" / hr 0.45"/hr 0.55"/hr 0.65"/hr 6 min 5 min 4 min 38 min 27 min 21 min 17 min 14 min Low head drainage occurs in lateral sprinkler piping after the irrigation valve has shut down. When heavy clay soils are being irrigated, multiple cycles (usually 6-8) must occur every day that irrigation takes place. This necessary cycling process introduces the problem of low head drainage. This problem may be resolved with addition of check valves which may be retrofitted into the base of spray head bodies. 3


4 It is not unusual to find irrigation valves with spray and rotor type sprinklers plumbed together. This is never acceptable and should be corrected because of the different precipitation rates of the two types! While low pressure at spray nozzles is frequently encountered, it is not unusual to find spray systems with excessive pressure. When pressure exceeds 45 psi, the sprinkler body should have a pressure regulating feature. This feature, like the anti-drain check valve, may be retrofitted into an existing spray body without digging up the sprinkler When sprinkler inlet pressures exceed 75 psi a regulator must be installed at the valve or backflow prevention device location. Spray heads operating at 90 psi. This problem was corrected with the addition of a regulator feature on the valve. Internal pressure regulating device is designed for inlet pressures between 45 and 75 psi Same circuit operating at 30 psi! 4

. These factors are nearly impossible for the landscape manager to evaluate in the field.")
. There are nearly 200 of these stations throughout the state.")

5 Managing the Irrigation Controller in a Drought The amount of irrigation water applied to the landscape varies with the type of plant material and the precipitation rate of the sprinklers. The environmental factors that drive plant water use are temperature, wind, solar radiation, humidity, and ground temperature and collectively they generate a number known as Evapotranspiration (ET). These factors are nearly impossible for the landscape manager to evaluate in the field. The State of California manages a network of computerized weather stations linked to a free website in a program known as CIMIS (California Irrigation Management Information System). There are nearly 200 of these stations throughout the state. They provide the landscape manager with a number that represents the inches of water plants generally need in a month, week, or day. The number available from the local weather station is known as ETO or reference ET. There are many regions of the state that lack a local weather station. In these instances tables are available providing monthly averages in the Water Efficient Landscape Ordinance (WELO) which is also available on line. Water Efficient Landscape Ordinance (WELO) 5

6 Every plant has a different water requirement relative to ETO based upon the landscape coefficient or KL. The primary factor that drives that landscape coefficient is the species factor. Our biggest concern in the drought is the water requirement for turfgrass as it consumes the bulk of the landscape water. The plant water requirement ETL is obtained for any period by multiplying the ETO x KL. In a traditional year cool season turfgrass such as fescue, Kentucky Bluegrass, or rye have a species factor of 70 percent or In a drought we reduce this species factor and in turn the landscape coefficient (KL) to 60 percent or This follows guidelines developed by turfgrass experts at the University of California at Davis and Riverside. August ET L in a traditional year ET O (5.31 ) x K L (0.70 for cs turf) = 3.72 / month August ET L in a drought year ET O (5.31 ) x K L (0.60 for cs turf) = 3.19 / month The water savings associated with this recommendation will save 0.53 in the peak month of August which is a 14% reduction in water use! The development of an irrigation schedule is based on the average daily ETL (plant water requirement) In the month of August, in Long Beach, we have an ETL of The objective is to establish an average daily ETL which in this case is per day (4.46 / 31 = ). The replacement for every 3rd day watering for turf in a typical August is inches (3 x 0.102). If we were watering on a flat clay surface the infiltration rate or maximum intake rate of the soil before runoff is 0.08 inches per hour. It would be necessary to have 4 cycles or start times (4x 0.08 = 0.32). We can schedule this on a single program of the irrigation controller as most controllers have 4 start times per program. 6
 dictates the maximum amount of water applied to be 0.08 before runoff. Some sprinklers such as rotors and drip apply water more slowly and can have longer run times.")
. We can accomplish this on one program because this controller features 4 cycle starts per program.")
 / PR (precipitation rate) x 60 (constant).")
7 On Thursday and Saturday the turf water requirement is Regardless of the type of sprinkler, the soil infiltration or intake rate of 0.08 for clay (in this case) dictates the maximum amount of water applied to be 0.08 before runoff. Some sprinklers such as rotors and drip apply water more slowly and can have longer run times. Spray type sprinklers have a much higher precipitation rate so their run times to reach runoff are shorter. The sprinkler does not dictate the number of repeats rather it is the soil type! So the number of cycles required is 3 (0.204 /0.08 = 2.55 so we round up to 3). We can accomplish this on one program because this controller features 4 cycle starts per program. The next step in scheduling is to determine the run time in minutes required for Thursday and Saturday. We use a simple run time formula RT = ETL (turf water requirement) / PR (precipitation rate) x 60 (constant). In this example the sprinkler is a 15 ft spray spaced square at 30 psi with a precipitation rate of 1.58 / hr. Recall the Thursday/Saturday ETL so the run time is as follows ETL (0.204) / PR (1.58) x 60 = 8 minutes. The problem is that the number is not divisible by 3 cycles, so we ll round up to a number that can be divided by 3 which is 9. On Program A we ll water 3 minutes per cycle x 3 starts = 9 minutes. 7
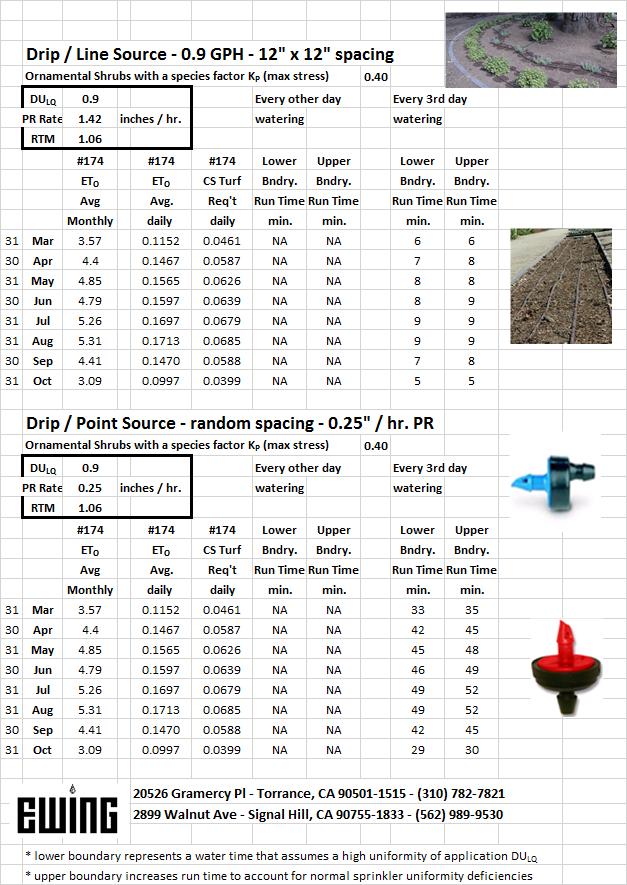
8 We ve completed the schedule for station 1 for the spray heads on the turf for Thursday and Saturday. The irrigation water that we had to apply (0.204 ) requires 3 repeats and utilizes the A program. The water requirement for Thursday and Saturday morning replaces 2 days of turf water use or inches of water. Since the water requirement is different on Tuesday,0.306 (3 day replacement), as opposed to on Thursday and Saturday, we ll have a different run time so a different program is required. We first must determine the number of cycles required to avoid runoff. The intake rate is 0.08 per hour and the goal is inches so we will need 4 cycles (0.304 /0.08 = 3.8). Since the controller has 4 starts per program, we can achieve this programming on program B. The run time for Tuesday is RT = ETL / PR x 60 (0.306 / 1.58 x 60) = 12 min. On the B program there will be 4 start times with 3 min cycles to achieve 12 minutes of total run time. We have utilized programs A, B, and for the turf stations. The drip and shrub stations may be assigned to water on the C program and may water less frequently than the A or B programs The previous special program addresses the water needs of the plant material on the designated day schedule of three days per week. Some water purveyor s may already have landscape water conservation programs in place that allow watering two times per week which would require a controller with more start times and programs The previous schedule is what is known as a lower boundary of watering time which does not reflect typical spray irrigation systems which have problems with uniform coverage and often have poor distribution uniformity 8


9 A landscape water audit would reveal the distribution uniformity DULQ of the system and once this is known we can develop a scheduling or system multiplier. The spray system we audited for this example had a DULO of 56 percent or A scheduling or run time multiplier indicates how much we will have to increase the lower boundary run times to deliver adequate water to the drier parts of the irrigation circuit. The run time or scheduling multiplier for 56 percent is The Tuesday run time on the lower boundary was 12 minutes or four 3 minute cycles. (Recall, that we bumped the 11 minutes up to 12!) The 12 minute run time would be increased 1.36 times to compensate for poor uniformity which is 16 minutes. The upper boundary of run time for Tuesday is 4 cycles of 4 minutes. One important feature of more modern controllers is the percentage or seasonal adjust key or +/- key. It allows adjustment of an entire program by percentages. Heavy clay soils and spray heads render this a meaningless feature. Imagine that there is a 3 minute run time that needs a 10% reduction. The controller times in 1 minute increments so the % key only works for 33% changes (3 minutes reduced to 2 minutes is a 33% change). The only options we have with these short run times is to eliminate a start time or decrease a run time. This is exactly why rotors, with their lower precipitation rates, and longer run times are a better option than sprays. If the rotor station was set for four 10 minute cycles a 90% adjust would reduce the run time to 9 minutes! Ultimately we need to be very creative in dealing with drought conditions where reduced watering days may be imposed by cities or water agencies. There are many limitations to controller programming when this occurs and they are acutely felt during a drought. Another serious limitation in the more arid regions of the state is the limitation of the water meter to apply water in three days that would normally be applied in 4 to 7 days per week! 9
10 Spray Circuit - Audit Run Time (4 minutes) Driest 6 catches psi gpm cfm Total Avg. psi (total divided by 6) DU LQ dry 6 Total of 24 catch readings avg of 24 avg.(total divided by 24) DU LQ PR = 3.66 x V avg t r x 16.5 PR Rotating Stream Circuit - Audit Run Time (10 minutes) psi Driest 6 catches gpm cfm Total Avg. DU LQ dry 6 psi (total divided by 6) avg of 24 Total of 24 catch readings DU LQ avg.(total divided by 24) PR = 3.66 x V avg t r x 16.5 PR 10 16

11 Estimating Irregularly shaped Areas Measurement A B C D E F G H I J K L M N O P EMITTER FLOW (TIME TO FILL 2" CAP) TOTAL AVG/16 EMITTER TYPE GPH FILL TIME SQ. FT POINT SOURCE SECONDS METER POINT SOURCE MIN 52 SECONDS FLOW LINE SOURCE MIN 2 SECONDS CFM LINE SOURCE MIN 4 SECONDS POINT SOURCE MIN 45 SECONDS PR Rate LINE SOURCE MIN 26 SECONDS 17 11


12 The water meter is an important management tool during the drought. As a landscape professional you can provide a very important service for your customers by monitoring their water use. If you are performing landscape maintenance at a site, then you are visiting it on a weekly basis and it will take just a few minutes to provide this service. Your primary objective in this regard is to look for leaks. Open the valve meter box when you arrive for maintenance and watch the meter for a few moments. There is a low flow indicator on the meter. If the meter is not dedicated to the landscape there may be a flow of potable to the residence or building. Try to check for leaks when no one is present in the building. If the irrigation system is off and no one is home the low flow indicator should not be moving. Observe it for a few seconds to see if it is turning. It may not be turning, but there still may be a leak. Note the position of the needle and the reading on the total flow which looks like a car s odometer. Check this before you leave the site to see if there has been any flow during your maintenance period. Calculate the flow of the leak per hour and multiply by 8,760 (hours per year to determine the amount of water loss per year. At each maintenance visit check the low flow indicator and the position of the needle and total flow to determine if there is a slow leak. Take a digital image with your phone camera to document any leaks as well as the meter number. This is a great low cost service that you can provide to your customers during the drought! The water meter is usually located between the curb and the backflow prevention device. Most commercial sites have dedicated landscape meters but this is not always the case. Meters record water volume in gallons or cubic feet, but most water agencies provide meters that record in cubic feet. A cubic foot of water is 7.48 gallons and is a 12 x12 x12 cube. Customers are billed in what is known as ccf s or hundred cubic foot units of 748 gallons. 12
 represents a flow of one cubic foot or 7.")

13 Each full revolution of the dial on commercial meters (1 ½ and larger) represents a flow of ten cubic feet or 74.8 gallons Each full revolution of the dial on a residential meter (5/8, 3,4 and 1 ) represents a flow of one cubic foot or 7.48 gallons The water meter limits the amount of water that can be delivered to the site. Most irrigation systems were designed with the expectation that they would apply water anywhere from three to seven days per week. Take the system that in non-drought years was able to water six days per week and nine hours per day in the month of July. This is a total watering time of 3,240 minutes (6 x 9 x 60). Let s assume this is a 2 meter providing 50 gallons per minute. Under these conditions the meter could provide up to 162,000 gallons per week. (This 50 gpm flow is an average as some stations such as drip have far less flow and others such as large turf rotors have more) Now, transition to a drought where watering is allowed two days per week for a maximum of thirty hours per week. The amount of water that could be delivered to the site would be 90,000 gallons (1,800 minutes x 50 = 90,000. Given this shortfall it is likely the site manager will have to set priorities on landscape watering and it is possible that some areas of the landscape may not survive. Invest the landscape water in large trees and shrubs which have the greatest value in the landscape! 13
14 14
15 15
16 16
17 17
18 18