Bioenergy in Danube Region
|
|
|
- Elvin Moody
- 5 years ago
- Views:
Transcription

1 Bioenergy in Danube Region Manjola Banja IET, Renewables and Energy Efficiency Unit September 2014 Kiev, Ukraine Serving society Stimulating innovation Supporting legislation
 2011 Pillars and Priority")

2 EU Danube Region Strategy Launched in June (EUSDR) 2011 Pillars and Priority Areas Country Participation Bioenergy Nexus Source:
3 Danube Bioenergy Nexus Address the challenges and opportunities of bioenergy in the Danube Region Biomass mobilization: present and future role of the Danube River. Statistical assessment of Bioenergy status & Progress in Danube Countries Assessment of agricultural crop residues availability Local use of Biomass feedstock for biogas and bio-heat Public support schemes & Funding mechanisms for bioenergy The initiative will bring together National institutions (including research institutions) International partners ( including the International Bioenergy Task 43 on Biomass feedstock for energy markets) EU Initiatives such as for example the JRC Enlargement/Integration/Neighbourdhood Programme or Horizon
4 Bioenergy Nexus Cluster: Priorities Mapping potential of the Danube Region as concerns the development of bioenergy; Assessment of relevant technological options; Assessment of the impacts of bioenergy development on agriculture; Assessment of the impacts of bioenergy development on climate change and vice versa; Assessment of the impacts of bioenergy development on soil quality; Assessment of the impacts of bioenergy development on biodiversity 4
5 Bioenergy Nexus: Relevance RES Directive 29/2009 Mandatory 2020 target for EU28: 20% share of Renewable Energy Sources in Consumption Individual mandatory targets for the Member States Fixed trajectory "Burden share" possible Biofuels for transport Sustainability Certification Land Use Change Assessment GHG accounting Other Renewables National Renewable Energy Action Plans Bi-annual progress reports

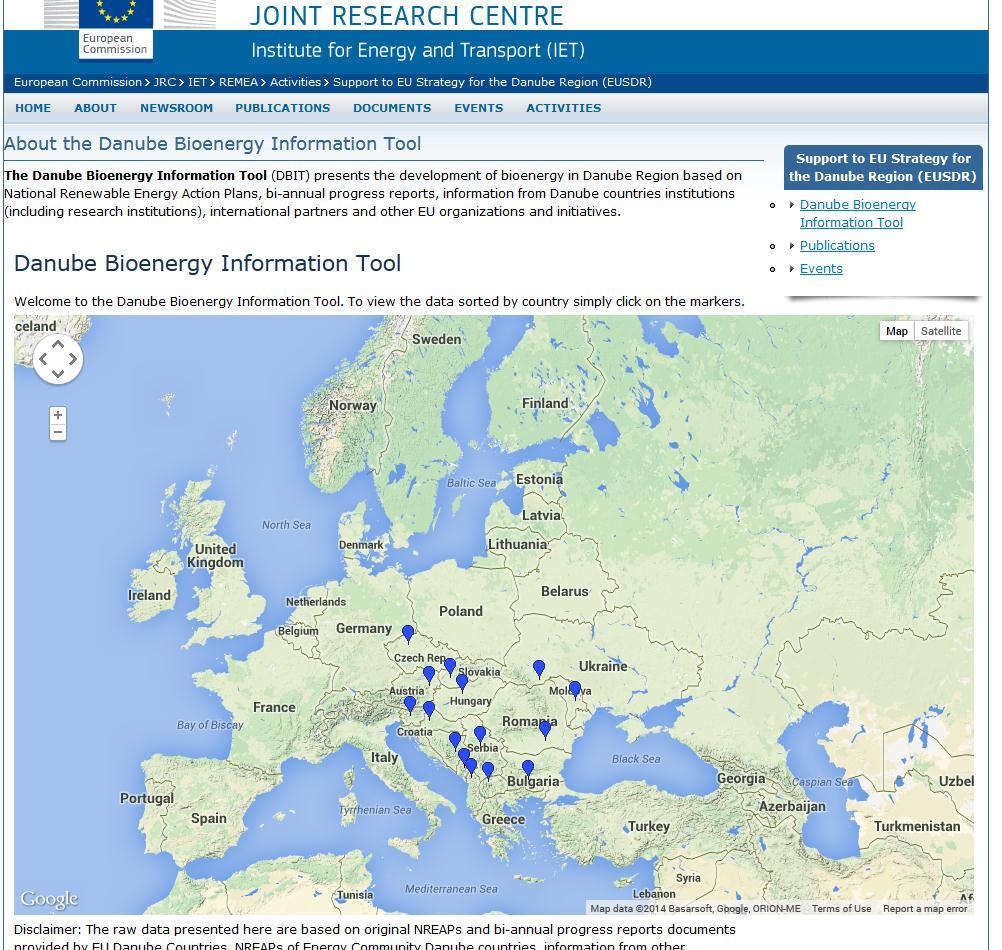
6 Bioenergy deployment in the Danube Region ( ) 9 EU Member States AT, BG, HR, CZ, DE, HU, RO, SK and SI 7 non-eu countries UA, MD, RS, BiH, AL, ME and the Former Yugoslavian Republic of Macedonia Sectors - Heating/Cooling - Electricity - Transport Biomass supply - Forest - Agriculture - Waste 6
7 National RES share in Gross Final Energy Consumption in EU-DC's % EU 28 RES share target for BG CZ DE HR HU AT RO SI SK target Source: EU-DC's bi-annual progress reports and NREAPs 7
8 Renewables in EU-DC's In 2012 total RES in EU-DC's: 2059 PJ or 31% of EU 28 total RES 14 GJ/capita DE 54% of total RES in EU-DC's AT 43.4 GJ/capita Biofuels 8,4% Hydropower 15,8% Geothermal 0,6% Solar 7,0% Biofuels 12,5% Hydropower 13,2% Geothermal 2,2% Solar 8,4% Biomass 56,2% Wind 10,0% Heat pumps 2,0% Biomass 45,4% Heat pumps 2,7% Wind 15,6% Source: EU-DC's bi-annual progress reports and NREAPs 8


9 GHG emission savings in EU-DC's due to RES In 2012: 14 tco2/capita GHG emission savings 243 Mt CO2 eq GHG emission savings or 38% of GHG emission savings in EU 28 65% - electricity sector 31.5% - heating/cooling sector 3.5% - transport sector Source: EU-DC's bi-annual progress reports DE 60% of total GHG emission savings in EU-DC's AT 3.5 tco2 eq GHG emission savings per capita 9


10 Current status of bioenergy in EU-DC's In 2012 bioenergy covered 64.6% of total RES in EU Danube Countries Total bioenergy in EU-DC's: 1317 PJ (31452 ktoe), ~ 9 GJ/capita Decreased by 1.4% between 2010 and 2012 DE contribute with 52% in total EU-DC's bioenergy AT 24.4 GJ/capita Source: EU-DC's bi-annual progress reports 10
11 2012 bioenergy EU-DC's deviation from NREAP ktoe % CZ used less bioenergy comparing to NREAP - Except AT all EU-DC's used less biofuels comparing to NREAP -10 BG CZ DE HU AT RO SI SK HR 800 Bioelectricity Bioheat Biofuels Source: EU-DC's bi-annual progress reports and NREAPs BG CZ DE HR HU AT RO SI SK
12 PJ Current status of bioenergy in EU-DC's (cont). In 2012 Bioheat: PJ or 73.2% of total bioenergy in EU-DC's Decrease by 3.0% in Bioelectricity: PJ or 13.9% of total bioenergy in EU-DC's Increased by 7.9% in Biofuels: PJ or 12.9% of total bioenergy in EU-DC's Decreased by 0.7% in Source: EU-DC's bi-annual progress reports Bioheat Bioelectricity Biofuels
13 Current status of biomass categories in EU-DC's In 2012: Biomass PJ or 87% of total bioenergy in EU-DC's Solid biomass: Biogas: Bioliquids: Source: EU-DC's bi-annual progress reports 976 PJ 85% of total biomass use in EU-DC's 74% of total bioenergy in EU-DC's decreased by 3.8% in PJ 14.2% of total biomass use in EU-DC's 12.3% of total bioenergy in EU-DC's increased by 32.2% in PJ 0.8% of total biomass use in EU-DC's 0.6% of total bioenergy in EU-DC's decreased by 80.8% in
 96.")

14 Biomass supply in EU-DC's in 2012 Total biomass supply ( E + H/C + Tr) PJ 94.4% domestic (1324 PJ) 96.5% used for E + H/C (1355 PJ) DE 56% of total biomass supply in EU-DC's 5,3% 0,3% 94,4% domestic imported from EU imported from non-eu Source: EU-DC's bi-annual progress reports and NREAPs


15 Domestic biomass supply in EU-DC's 22% increase between 2010 and PJ, 21% 67.7 PJ, 5% 58.2 PJ, 4% Forestry: 18.3% increase Agriculture: 5.2% increase Waste: 55.2% increase PJ, 70% Forestry Agriculture Waste Other Source: EU-DC's bi-annual progress reports Other includes: energy crops, common arable crops for biofuels

16 Bioenergy in EU-DC's in 2020 In 2020 bioenergy is expected to amount to 1661 PJ or 58% of total RES in EU-DC's The expected growth: 344 PJ DE 53% in contribution to ED-DC's bioenergy Total Bioenergy [PJ] Growth to 2020 plan 344 PJ Bioenergy 2012, PJ Source: EU-DC's NREAPs 16
17 Expected growth of bioenergy in EU-DC's ( ) Growth to In 2020: Bioheat: 63.4% of total bioenergy in EU-DC's Expected growth: +9.4% (+90 PJ) Bioelectricity: Expected growth: Biofuels: Expected growth: 15.0% of total bioenergy in EU-DC's +36.4% (+66.5 PJ) 21.6% of total bioenergy in EU-DC's +110% ( PJ) Bioheat Bioelectricity Biofuels Source: EU-DC's bi-annual progress reports and NREAPs PJ 17
18 Expected growth of biomass categories in EU-DC's ( ) growth to In 2020: biomass 1313 PJ or 78.4% of total bioenergy Solid biomass: Expected growth: Biogas: Expected growth: Bioliquids: Expected growth: PJ or 82.2% of total biomass +10.6% ( PJ) PJ or 15% of total biomass +21.5% (+35 PJ) PJ or 2.8% of total biomass +358% ( PJ) Solid biomass Biogas Bioliquids PJ
19 2020 domestic biomass supply in EU-DC's In 2020: Domestic biomass: 1789 PJ Forestry: 980 PJ or 54.8% Agriculture: 680 PJ or 38.0% Waste: 129 PJ or 7.2% 19
20 Expected growth of domestic biomass supply in EU-DC's ( ) growth to Total domestic biomass: PJ (+36%) Forestry: + 55 PJ (+5.9%) Agriculture: +416 PJ (+152.4%) Waste: PJ (92.2%) Source: EU-DC's bi-annual progress reports and NREAPs PJ Forestry Agriculture Waste 20

21 National RES share in Gross Final Energy Consumption in non EU-DC's 2009 and targets for % % % % % % % % Source: Energy Community Up to now only MD and RS have submitted the NREAPs 31.2% % % % % %
22 2020 bioenergy in non EU-DC's Ukraine In 2020, it is expected that 53.8 % (4 592 ktoe) of the total renewable energy will be bioenergy; Moldova In 2020, it is expected that bioenergy will amount to ktoe or 86.8% of total renewable energy; Serbia In 2020 Serbia will use ktoe bioenergy or 57.7% of total renewable energy; 22
23 Expected bioenergy in non EU-DC's The Former Yugoslavian Republic of Macedonia In 2020 will use 288 ktoe bioenergy or 55.8% of total renewable energy; Albania In 2020, biomass in the electricity sector is expected to generate 16 ktoe equal to 2.1% of total renewable electricity expected to be produced. Transport sector is expected to use in ktoe of bioenergy. 23
24 Challenges. We need common data for ALL Danube Region Countries We need regional data on bioenergy for ALL Danube Region Countries We need economic data on: Energy Prices Fuel Electricity Heating Energy (Coal, Oil, Wood ) Agricultural data: Products, Yields Water Consumption Economic Value Environmental Constraints
25 25
26 Thank you on your attention! 26