HYDRO ONE AND FIRST NATIONS ENGAGEMENT SESSION. February 9 th & 10 th, 2017
|
|
|
- Crystal Austin
- 5 years ago
- Views:
Transcription
1 HYDRO ONE AND FIRST NATIONS ENGAGEMENT SESSION February 9 th & 10 th, 2017
2 DISCLAIMERS In this presentation, all amounts are in Canadian dollars, unless otherwise indicated. Any graphs, tables or other information in this presentation demonstrating the historical performance of the Company or any other entity contained in this presentation are intended only to illustrate past performance of such entitles and are not necessarily indicative of future performance of Hydro One. In this presentation, Hydro One refers to Hydro One Limited and its subsidiaries and other investments, taken together as a whole. Forward-Looking Information This presentation contains forward-looking information within the meaning of applicable Canadian securities laws. Forward-looking information in this presentation is based on current expectations, estimates, forecasts and projections about Hydro One s business and the industry in which Hydro One operates and includes beliefs of and assumptions made by management. Such statements include, but are not limited to: statements related to project costs; statements related to continued consolidation of the electric utility market; statements related to dividends, including expectations regarding the ability of continued rate base expansion through capital investments to drive growth in dividends; statements regarding future equity issuances; expectations regarding funding for planned capital investments; statements related to rate applications and models; statements regarding rate base and cash flows; and statements regarding productivity improvements. Words such as aim, could, would, expect, anticipate, intend, attempt, may, plan, will, believe, seek, estimate, goal, target, and variations of such words and similar expressions are intended to identify such forward-looking information. These statements are not guarantees of future performance and involve assumptions and risks and uncertainties that are difficult to predict. Therefore, actual outcomes and results may differ materially from what is expressed, implied or forecasted in such forward-looking information. Hydro One does not intend, and it disclaims any obligation to update any forwardlooking information, except as required by law. The forward-looking information in this presentation is based on a variety of factors and assumptions, as described in the financial statements and management s discussion and analysis. Actual results may differ materially from those predicted by such forward-looking information. While Hydro One does not know what impact any of these differences may have, Hydro One s business, results of operations and financial condition may be materially adversely affected if any such differences occur. Factors that could cause actual results or outcomes to differ materially from the results expressed or implied by forward-looking information are described in the financial statements and management s discussion and analysis. Non-GAAP Measures Hydro One prepares and presents its financial statements in accordance with U.S. GAAP. Funds from Operations or FFO and Adjusted Earnings Per Share are not recognized measures under U.S. GAAP and do not have standardized meanings prescribed by U.S. GAAP. These are therefore unlikely to be comparable to similar measures presented by other companies. Funds from Operations should not be considered in isolation nor as a substitute for analysis of Hydro One s financial information reported under U.S. GAAP. Funds from Operations or FFO is defined as net cash from operating activities, adjusted for the following: (i) changes in non-cash balances related to operations, (ii) dividends paid on preferred shares, and (iii) non-controlling interest distributions. Management believes that these measures will be helpful as a supplemental measure of the Company s operating cash flows and earnings. For more information, see Non-GAAP Measures in Hydro One s 2016 full year MD&A. TSX: H
3 Thursday, February 9th Agenda Hydro One and First Nations Engagement Session Thursday, February 9, :30 a.m. - 4:30 p.m. Session Objectives: We would like to come together to share mutual aspirations and hear from you about the issues that matter to your community. We will also be pleased to share our current thinking and solicit feedback on the application for Distribution Rates and the distribution system plan that we are preparing for submission to the Ontario Energy Board Item Speaker Start Time Duration Welcome Introduction to Today s Session Introduction of First Nations Elder (Andrew Wesley) Prayer from Elder Phil Goulais & Elder 8:30am 30 mins Introductory Remarks Hydro One's Commitment to First Nations (including recent success stories) Mayo Schmidt 9:00am 30 mins Individual Introductions Introduction of each Chief or Delegate Open Discussion "What would you like to get out of today's session?" Phil Goulais 9:30am 60 mins BREAK 10:30am 15 mins Customer Service Customer Vision, Strategy, & Key Initiatives Faciliated Dialogue: Exercise at each table. "What does great Customer Service mean to you" Ferio Pugliese 10:45am 90 mins NETWORKING LUNCH 12:15pm 45 mins Distribution Rate Filing ( ) Key Findings from Customer Consultation Revenue Requirement and Distribution Rate Profile Cost Allocation Methodology, Rate Design Oded Hubert & Henry Andre 1:00pm 90 mins BREAK 2:30pm 15 mins System Investments Education about why the power goes out Reliability statistics on FN communities (either a few sample communities or in aggregiate) Investments in the Dx Rate Filing which will help to improve reliability (i.e. worst feeder) Greg Kiraly 2:45pm 60 mins Wrap Up Feedback Protocol for Future Discussions Phil Goulais 3:45pm 30 mins
4 Friday, Feb 10th Agenda Hydro One and First Nations Engagement Session Friday February 10, :30 a.m. - 4:30 p.m. Session Objectives: We would like to come together to share mutual aspirations and hear from you about the issues that matter to your community. We will also be pleased to share our current thinking and solicit feedback on the application for Distribution Rates and the distribution system plan that we are preparing for submission to the Ontario Energy Board Item Speaker Start Time Duration Welcome Introduction to Today s Session Introduction of First Nations Elder (Andrew Wesley) Prayer from Elder Phil Goulais & Elder 8:30am 30 mins Individual Introductions Introduction of each Chief or Delegate Open Discussion "What would you like to get out of today's session?" Phil Goulais 9:00am 60 mins BREAK 10:00am 15 mins Customer Service Customer Vision, Strategy, & Key Initiatives Faciliated Dialogue: Exercise at each table. "What does great Customer Service mean to you" Ferio Pugliese 10:15am 60 mins CEO Remarks Hydro One's Commitment to First Nations (including recent success stories) Mayo Schmidt 11:30am 30 mins NETWORKING LUNCH 12:00pm 30 mins System Investments Education about why the power goes out Reliability statistics on FN communities (either a few sample communities or in aggregiate) Investments in the Dx Rate Filing which will help to improve reliability (i.e. worst feeder) Greg Kiraly 2:45pm 60 mins BREAK 2:30pm 15 mins Distribution Rate Filing ( ) Key Findings from Customer Consultation Revenue Requirement and Distribution Rate Profile Cost Allocation Methodology, Rate Design Oded Hubert & Henry Andre 1:00pm 90 mins Wrap Up Feedback Protocol for Future Discussions Phil Goulais 3:45pm 30 mins
5 CUSTOMER SERVICE Ferio Pugliese Executive Vice President, Customer Care and Corporate Affairs Hydro One and First Nations Engagement Session February 9 and 10,


6 2 Customer Service Vision We are easy to do business with We are there when customers need us We are always connected

7 3 We Are Easy To Do Business With Education Advocacy Responsiveness
8 4 We Are There When Customers Need Us Local presence In- Community Sessions First Nations Engagement Face-to-Face Interactions Province- Wide Responding in ways you prefer Program Enrollment


9 5 We Are Always Connected ebill Notifications & High Usage Alerts New Website Redesigned Bill


10 6 Our Commitment to You Be present where we can Listen and advocate on your behalf Partner and respond
11 FIRST NATIONS RELIABILITY PERFORMANCE OVERVIEW Greg Kiraly and Mike Penstone Hydro One and First Nations Engagement Session February 9 & 10,
12 Today s Presentation Customer Engagement Initiative Reliability to First Nations Communities Managing Costs 2
13 Customer Engagement Initiative Occurred in Q A 3 rd party facilitated the initiative Input received from 300 First Nations Customers 3
14 Customer Engagement Results Focus of this presentation 34% 4
15 Customer Engagement Results Part 1: 34% 5
16 Generation Customer Distribution Lines - Feeders Generating Station Step-Up Transformer Transmission Lines Step-down Transmission Stations Distribution Stations Customer (First Nation Communities) Transmission System: ~490 Transmission Lines, ~340 Transmission Stations, 29,000 km of Transmission Lines Distribution System: ~3200 Distribution Lines, ~1000 Distribution Stations, 130,000 km of Distribution Lines First Nation Communities: Supplied from 55 Transmission Lines and from 89 Distribution Lines 6
17 Transmission System Distribution Lines - Feeders Generating Station Step-Up Transformer Transmission Lines Step-down Transmission Stations Distribution Stations Customer (First Nation Communities) Transmission System: ~490 Transmission Lines, ~340 Transmission Stations, 29,000 km of Transmission Lines Distribution System: ~3200 Distribution Lines, ~1000 Distribution Stations, 130,000 km of Distribution Lines First Nation Communities: Supplied from 55 Transmission Lines and from 89 Distribution Lines 7
18 Tx System Primary Causes of Interruptions: (~67% occurs from Weather & Equipment Failures) Power outage causes ( ) Equipment failure Weather 49% 18% Majority of failures have occurred on Lines assets (Insulators, Wood Poles, Conductor, etc) Adverse weather (freezing rain, ice, lightning) Environment 15% Occasionally, Hydro One experiences tornados, forest fires, major environmental events Animal/vehicle or Tree Contacts Configuration Unconfirmed causes 14% 2% 1% Animal contacts with Hydro One s equipment and off-corridor tree-felling events Issues relating to the configuration of the system at the time of the event. Sometimes Hydro One crews can t determine the exact cause of an outage. 8
 2015 Performance Trend Increasing duration of interruptions Increasing frequency of interruptions")
19 First Nations: Transmission Connections Northern Region (mostly Single-CCT) Southern Region (mostly Multi-CCT) 2015 Performance Trend Increasing duration of interruptions Increasing frequency of interruptions STABLE 9
20 Transmission Connections Performance: By Geographic Region (First Nations Only) Transmission System - Northern Sub-System (2016 YE Performance) Tx Reliability Index # of Transmission Connections Duration of Interruptions (interruption minutes/ Tx Connection) Frequency of Interruptions (# of interruptions /Tx Connection) 1 First Nations (68.4) 4.48 Transmission System - Southern Sub-System (2016 YE Performance) Tx Reliability Index # of Transmission Connections Duration of Interruptions (interruption minutes /Tx Connection) Frequency of Interruptions (# of interruptions /Tx Connection) First Nations Two lines account for 58% of total interruption minutes for entire year 10
21 How is Hydro One maintaining Reliability in the Transmission System? Increasing Capital Investments (Lines) Leveraging Technology (Distance-to- Fault) Reducing Planned Outages (Bundling Work) 11

22 Distribution System Distribution Lines - Feeders Generating Station Step-Up Transformer Transmission Lines Step-down Transmission Stations Distribution Stations Customer (First Nation Communities) Transmission System: ~490 Transmission Lines, ~340 Transmission Stations, 29,000 km of Transmission Lines Distribution System: ~3200 Distribution Lines, ~1000 Distribution Stations, 130,000 km of Distribution Lines First Nation Communities: Supplied from 55 Transmission Lines and from 89 Distribution Lines 12
 Power outage causes (2013-2015) Tree damage 24% Equipment failure")


23 Dx System Primary Causes of Interruptions: (~50% occurs from Tree Contacts & Equipment Failures) Power outage causes ( ) Tree damage 24% Equipment failure 24% Unconfirmed causes 19% Scheduled outages 16% Transmission Outage12% Animal or vehicle 5% damage to equipment Trees fall on lines during storms. Poles, transformers, lines failures can cause an outage. Sometimes Hydro One crews can t determine the exact cause of an outage. Occasionally, Hydro One needs to schedule power outages to safely replace or update equipment. Issues relating to the larger grid, like damage to transmission lines. Animal contacts with Hydro One s equipment and car accidents that damage poles. 13
24 First Nations: Distribution Connections Northern Region Southern Region 14
25 Dx Performance: By Customer Segmentation (& First Nations Only) Distribution System - Overall (2016 YE Performance) Distribution System Reliability Index Interruption Hours/Customer (SAIDI) # of Interruptions/Customer (SAIFI) Hydro One First Nations Note: Includes Force Majeure and Loss of Supply (i.e. interruptions due to Transmission events) Distribution System - Rural (2016 YE Performance) Distribution System Reliability Index Distribution System - Urban (2016 YE Performance) Distribution System Reliability Index Interruption Hours/Customer (SAIDI) Interruption Hours/Customer (SAIDI) # of Interruptions/Customer (SAIFI) Hydro One First Nations # of Interruptions/Customer (SAIFI) Hydro One First Nations Mostly Rural Mostly Rural 1 First Nations results are for 2015 year. When available, 2016 numbers will be inserted. Only a small portion of First Nations are in an Urban area (<10% estimated) 15


26 How is Hydro One maintaining Reliability in the Distribution System? Reducing the number of outages per year Shortening the length of power outages Renewal program Replace equipment that s affecting reliability Tree trimming Targeting tree trimming in areas with high tree contacts Smart Grid Adding more protective devices & remote control to reduce chance of outages Improved Outage Response Detects outages, limits size, dispatches repair crews Monitoring and control Use technology that lets Hydro One remotely respond to outages 16
27 Customer Engagement Results Part 2: 17
28 Controlling Costs: Pacing Expenditures Vegetation Management Move-to-Mobile 18
29 Questions & Answers 19
30 HYDRO ONE S DISTRIBUTION RATES APPLICATION ( ) Oded Hubert Vice President Regulatory Affairs Hydro One and First Nations Engagement Session February 9 and 10,
31 Hydro One Limited (Hydro One) Hydro One is Ontario s largest electricity delivery company We are owned 70% by the province of Ontario and 30% by public shareholders We have three businesses: Transmission; Distribution; and Telecommunications 2

32 Hydro One s Role in the Ontario Electricity System Transmission Distribution Generation Transmission System Distribution System Industrial, Residential, Commercial 3
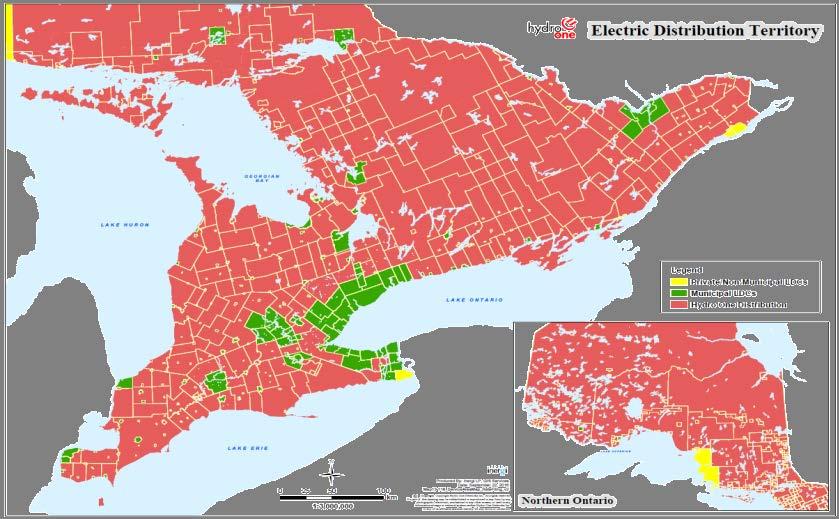
33 Distribution System Map 4
34 5 Distribution System Stats Service Territory Customers Distributed Generation Stations Circuit Length Rural Service Area - 960,123 sq. km Urban Service Area sq. km 1.3 million residential and business customers as well as 55 local distribution companies Approximately 13,400 small, mid-size and large embedded generators connected to Hydro One's distribution network, including approximately 12,600 generators with capacities of up to 10 kw and 1,600 generators pending connection Approximately 1,000 distribution and regulating stations 123,000 kilometres of primary low voltage distribution lines

35 6 Breakdown of Electricity Costs to Customers Sales Tax 5% Regulatory Charges 3% Line Losses 4% Total Electric Bill Hydro One s Portion of Customer Electric Bill Local Electric Distribution Charges Generation Related Charges Transmission Charges

36 7 How Distribution Charges are Spent by Hydro One Hydro One receives a distribution charge which pays for a broad range of distribution system costs:
37 8 How Distribution Rates are Set Electricity distribution rates are set by the Ontario Energy Board (OEB), an independent public agency. The OEB sets rates following a public hearing based on evidence. Hydro One will be applying to the OEB to set our distribution rates for the period in March 2017.

38 Objectives of the OEB 1. Protect the interests of consumers 2. Promote economic efficiency and cost effectiveness maintain a financially viable electricity industry 3. Promote conservation & demand management 4. Facilitate the smart grid 5. Promote generation from renewable energy sources: consistent with the policies of Government; and expansion or reinforcement of transmission and distribution systems. 9


39 10 Stages of an Application 3-4 months Preliminary Matters 2-3 months Issues & Discovery 2-4 weeks Hearing 2-4 months Decision & Approval Usually takes 8 12 months

40 11 Balancing Key Considerations Customer Needs & Preferences Rate Impact Asset Needs
41 Hydro One s Application Our proposal is focused on addressing customer needs and preferences including: Keeping Costs Low Keep costs as low as possible is customers top priority Maintain Reliable Service Maintaining reliable electricity service is consistently second priority to cost Large Customers Large customers are more concerned with reliability and capacity Manage Rate Impacts Willingness to accept a rate increase to improve service level is limited 12
42 13 Service Enhancements Hydro One Will Deliver Hydro One s overall business plan was optimized such that asset condition and reliability will not deteriorate

43 Proposed Distribution Rate Increases And Total Bill Impact 14
44 15 Main Areas of Hydro One Rate Increases Cost Drivers Operations, Maintenance and Administration Capital Related (e.g., poles, wires and transformers) -0.1% 0.5% 0.5% 1.2% 0.5% 2.0% 2.9% 2.6% 3.3% 2.5% Taxes 0.7% 0.2% 0.1% 0.4% 0.1% Load Impact 2.0% -0.2% -0.7% -2.5% -0.6% Other Revenue and Rate Riders 1.1% 0.0% 0.0% -0.1% 0.0% Total 5.7% 3.4% 2.5% 2.4% 2.4%
45 16 Additional Cost from Declining Electricity Use (Load Impact) The cost of distribution services is spread out among all Hydro One customers based on total electricity consumption. Total electricity consumption has been decreasing since rates were last set, so the cost of serving each individual customer will increase by 2% in This is a one-time adjustment and will not lead to increases in
46 17 On-Reserve First Nations Electricity Customers Minister of Energy asked the OEB to examine and provide advice for an appropriate electricity rate or rate assistance program Hydro One has been supportive of this initiative and has provided input to the OEB January 1, 2017 OEB submitted its report to the Minister of Energy and now waiting for next steps to be announced.
47 Questions & Answers 18
48 19 THANK YOU FOR ATTENDING!