Overview of Wastewater & Water Treatment Markets in Canada
|
|
|
- Sheryl Parsons
- 5 years ago
- Views:
Transcription

1 Overview of Wastewater & Water Treatment Markets in Canada Canada Forum IFAT-Entsorga 2014 May 7, 2014 Munich, Germany Dana M. Hicks President & CEO Huber Technology, Inc.
2 Recent Canadian Experiences Honorary Canadian Consul in Charlotte, NC for 6+ Years ( ) representing Canada in the Carolinas. Traveled extensively in Canada on business & vacations ON, QC, NB, NS, PE, NFL, SK, AB, BC Led business development trade mission of 15 Carolinas companies to Toronto and Montreal in Saskatchewan gov t industry familiarization program to Regina, Saskatoon, and various industrial sites Alberta gov t energy program to Edmonton and tours of oil sands production sites for HonCons Quebec German Water Partnership technology delegation to Montreal, Trois Rivieres, and Quebec City.
3 Canada Basics North American country consisting of ten provinces and three territories. Extends from the Atlantic Ocean in the east to the Pacific Ocean in the west & the Arctic Ocean. Second-largest country by total area. 3,855,000 sq. miles / 9,985,000 km². Canada s border with the United States to the south is longest in the world miles / 6417 km. Border to the northwest with Alaska is 1538 miles/ 2475 km.
4 Canadian Population 35,163,000 total population in Canada s population tripled from 11 million in mid-1940s to over 35 million in Growth fueled largely by immigration. 90% of Canadian population lives within 100 miles of Canada USA border. Population Projections Year Population Change ,468, % ,127, % ,120, %
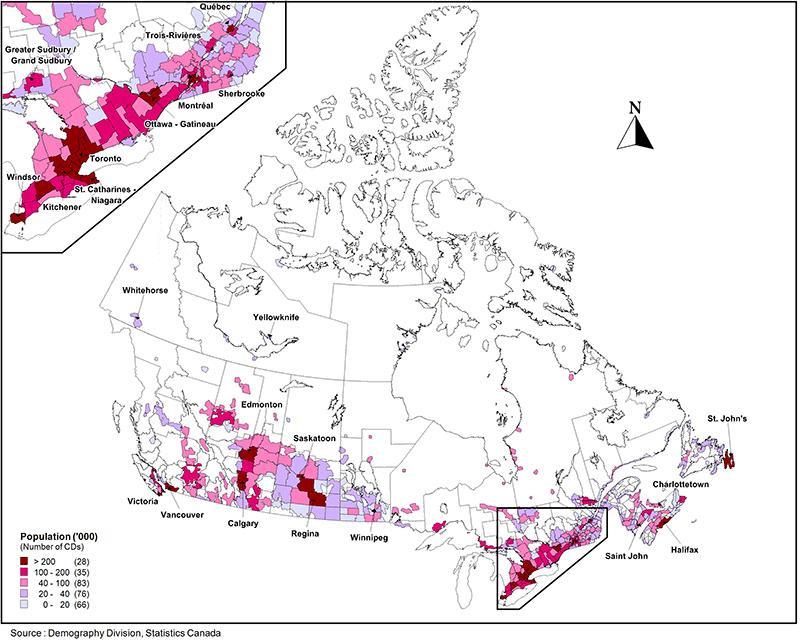
5 Population Distribution

6 Population Distribution
7 Population by Province Rank Province/Territory Abbreviation Population (2011) % of national population 1 Ontario ON 12,851, % 2 Quebec QC 7,903, % 3 British Columbia BC 4,400, % 4 Alberta AB 3,645, % 5 Manitoba MB 1,208, % 6 Saskatchewan SK 1,033, % 7 Nova Scotia NS 921, % 8 New Brunswick NB 751, % 9 Newfoundland and Labrador NL 514, % 10 Prince Edward Island PE 140, % 11 Northwest Territories NT 41, % 12 Yukon YT 33, %
8 Population by Province
9 Wastewater Infrastructure Over 3700 WWTPs in Canada. (CWWA estimate). 950 WWTPs offer less than secondary treatment. Over 150,000 km of sewer pipe installed in Canada (CWWA estimate). Over 90% of Canadians in communities over 1000 people have connections to sewer systems.
10 Canadian WWTPs by Treatment Type Percent population with No treatment Percent population with Secondary treatment Percent population with Septic systems or Haulage Percent population with Primary treatment Percent population with Tertiary treatment Source: Environment Canada. Municipal Wastewater Treatment Indicator. April 2012.
11 Wastewater Infrastructure Investment Canadian government estimates C$13 billion investment in modernization over next 30 years. Canadian Water & Wastewater Association (CWWA) estimates investment to be C$24 billion. Includes replacement/modernization of existing Includes maintenance & repairs Does not include new WWTPs 1 out of every 4 (25%) WWTPs need upgrades to comply with 2012 Systems Effluent Regulations. WWTPs with rated flow over 100 m³/day must have 2 stage process - mechanical & biological - by 2020.


12 Where is the short-term demand? AWI Tracker: Tracked Projects by state/province $ $ $ $ Canadian provinces are in the top 10 for tracked projects. $ $ $ $ $ $- Source: American Water Intelligence
13 Wastewater Regulation in Canada There are laws, regulations and guidelines at the federal, provincial and territorial levels that address wastewater management and include limits for the discharge of specific substances found in wastewater effluents. Provincial laws, regulations and guidelines are generally not applied to wastewater systems in Aboriginal /First Nation communities. Currently, permitted discharge limits for substances contained in wastewater effluents differ not only between provinces, but within them as well. This is problematic for discharges to surface waters bordering on multiple jurisdictions.
14 Drinking Water Infrastructure Could not find reliable estimate of WTPs in Canada. Over 150,000 kms of drinking water pipe installed in Canada (CWWA estimate). Over 92% of Canadians served by connection to a municipal water system. 90% of raw water from surface water sources. 10% of raw water from ground water sources. Drinking water plants in Canada supplied 5,103 million m³ of potable water in Total prepared and consumed volume of drinking water declined 10% from 2007 to 2012.
15 Drinking Water Use 43% used by households. 21% used by industry, commercial, and public buildings. 12% line losses, non-revenue water. 40% line losses in Montreal, 2 nd largest city. 483 liters used per capita in 2011, 12% under liters used per capita in households.
16 Drinking Water Infrastructure Investment C $1.3 billion invested in Investments in new & modernization of existing. C $882 million in operations and maintenance spent in 2011.
17 Project Financing Building Canada Plan allocates C$53 billion from for construction of new WWTPs and for modernization of existing WWTPs. Project must have a Sustainability component to qualify for funding. Should encourage investment in energy-efficient and water utilization efficient technologies.
18 Building Canada Building Canada supports a cleaner environment through investments in: 1. Wastewater Infrastructure Building Canada encourages investments in wastewater infrastructure designed to: Reduce the negative impacts of municipal wastewater effluent or storm-water effluent on human health and the environment; Improve the management of wastewater sludge; Improve the management and efficiency of municipal wastewater infrastructure or storm-water infrastructure; Improve the quality of municipal wastewater effluent and storm-water discharged into the environment through improved treatment. 2. Green Energy Building Canada invests in sustainable energy infrastructure that contributes to: Increased availability and/or reliability of Canada's clean energy supply; Increased availability of renewable energy; Improved air quality; Reduced greenhouse gas emissions. 3. Solid Waste Management Building Canada promotes investments in solid-waste processing infrastructure that can reduce the environmental impacts of this waste. As a result, funding criteria emphasizes the diversion of solid waste out of the waste stream as well as measures that support the reduction and management of solid waste.
19 Project Financing Public Private Partnerships (PPPs) incorporate federal, provincial, and private funding sources. Each year large WWTP projects are financed by P3s. The complete process for advertising, RFP, proposals, proposal evaluation, and contract award takes 17 months on average. 90% of PPP Projects are completed/started up on schedule or ahead of schedule.
20 Where are the PPPs? Short answer: Capital-intensive projects. Of tracked projects in 2013 with a specified delivery model and budget: Projects <$100 million: 5% use/used a delivery model other than DBB. Projects >$100 million: 12% use/used a delivery model other than DBB.
21 Canadian Infrastructure Report Card Wastewater Infrastructure Group of Canadian associations and organizations commissioned a study in 2012 to grade municipal infrastructure. 40% of WWTPs & pumping stations rated poor. 30% of sewer pipe network rated poor. Study estimated C$40 billion investment just to replace these.
22 Canadian Infrastructure Report Card Drinking Water Infrastructure Group of Canadian associations and organizations commissioned a study in 2012 to grade municipal infrastructure. 15% of drinking water plants rated adequate 15% of drinking water plants rated poor. Study estimated C$26 billion investment just to replace these.
23 Environmental Technology Companies 700 Clean-Tech Companies Total in Canada 220 in Ontario 160 in British Columbia 150 in Quebec 90 in Alberta 80 in Other provinces


24 Environmental Technology Companies # of Companies Other Provinces; 80; 12% Alberta; 90; 13% Ontario; 220; 31% Quebec; 150; 21% British Columbia; 160; 23% Ontario British Columbia Quebec Alberta Other Provinces Source: Analytica Advisor Estimate
25 Where is the Canadian Market Now? Demand for environmental products & services is growing gradually. Market heavily skewed toward wastewater treatment, though water & reuse gaining ground. Regulation remains largest wastewater driver. Some projects remain stalled due to provincial and federal funding delays. Design-Bid-Build dominates Canadian and U.S. procurement, but munis seem to be warming to PPPs and Design-Build project delivery.
26 Industry Resources for Doing Business in Canada American Water Intelligence Water & Wastewater Manufacturers Association Water Environment Federation American Water Works Association
27 Resources for Doing Business in Canada Building Canada Fund Environment Canada Water TAP (Technology Acceleration Program) Directory of Companies divided into 6 sub-sectors Federation of Canadian Municipalities PPP Canada
28 Resources for Doing Business in Canada Statistics Canada Canadian Infrastructure Report Canadian Water Network CentresReseaux/NCE-RCE/CWN-RCE_eng.asp Canadian Water & Wastewater Association Canadian Biosolids Partnership
29 Thank You Very Much Danke Schön, Merci Beaucoup, Muchas Gracias, Grazie Mille Questions? Dana M. Hicks, President Huber Technology, Inc. Huntersville, NC Office: Cell: