Sanitation Services: Enterprise Fund Overview April 18, 2016 Budget, Finance and Audit Committee
|
|
|
- Shannon Patterson
- 5 years ago
- Views:
Transcription

1


2 Sanitation Services: Enterprise Fund Overview April 18, 2016 Budget, Finance and Audit Committee

3 Briefing Purpose To provide an overview of the Sanitation Services Department (landfill) 2
4 Outline Mission Statement Background Overview of Services Operational Scope Budget Overview Funding Outlook Business Planning Appendix Additional Operational Service Detail Other Cities Comparisons 3

5 Sanitation Services To benefit our community and environment while garnering benefit from our waste resources by providing excellent customer services that promote waste reduction, resource recovery, and support to the City of Dallas sustainability efforts. 4
6 Background In FY Council established Sanitation Services as a Enterprise Fund Department More consistent with other municipalities Owned and operated by the City of Dallas Self-supported by residential sanitation fees, commercial fees and cash customers who utilize our collection services or disposal services 5
7 Overview of Sanitation Services Sanitation Services proudly provides the following solid waste services for the City of Dallas: 6 Weekly residential refuse and recycling collection Monthly residential bulk and brush collection Refuse and recycling collection at over 220 City facilities Manages collection contract with Dallas County for Household Hazardous Waste collection and disposal Citywide dead animal collection (7 days/week)
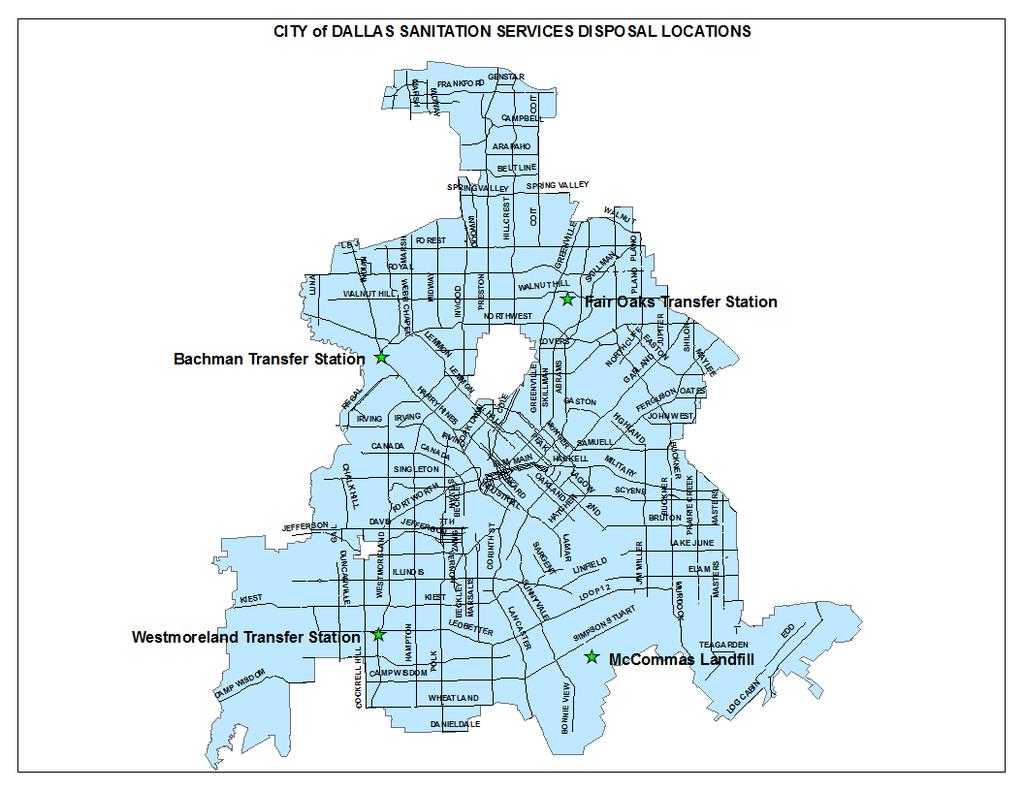
8 Overview of Sanitation Services (continued) Manages and disposes of residential and commercial solid waste at the City s McCommas Bluff Landfill Operates three City transfer stations: Bachman, Fair Oaks and Westmoreland Manages service contracts for recycling processing, as well as compactor, roll-off container and dumpster collection Provides waste diversion education, outreach and oversight of the City s Local Solid Waste Management Plan (Zero Waste Plan) 7
9 8 Scope of Services
10 Residential Collection Services Scope The Department provides services to approximately 240,000 residential homes: Over 110 routes daily for residential refuse and recycling collection 100,000 service opportunities per day or 21M opportunities annually 7,500 miles driven a day or 1.5 million miles annually Monthly Bulk and Brush collection Four weekly collections (~60,000 service opportunities each collection week) 2.8M service opportunities annually Over 200 pieces of collection equipment utilized daily 70 Rear Loader Collection Trucks 50 Automated Collection Trucks 31 Roto-booms (Grapple Trucks) 52 Brush Trucks and Trailers Collects annually approximately: 230,000 tons of residential refuse 165,000 tons of bulk and brush 55,000 tons of recycling 9
11 Disposal Services Scope Sanitation Services operates the McCommas Bluff Landfill Has estimated remaining capacity of over 47 years (~95M CY of air space) Received approximately 1.8 million tons in FY Over 5,000 tons per day Open 6 days a week Processes over 1,100 customer transactions daily Open 15 hours a day on weekdays Sanitation Services operates three regional transfer stations (Bachman, Fair Oaks and Southwest) Receive, process and transport over 260,000 tons annually 10
12 Fiscal Year Budget Overview 11

13 FY 16 Budget Allocation by Service 25% Residential Refuse Collection $38,540,412-44% 1% 17% 44% Recycle Collection/Zero Waste $11,013,531-13% Brush/Bulk Removal Services $14,902,248-17% 13% City Facilities $760,209-1% Landfill Services $21,263,747-25% Department Total - $86,480,147 12

14 FY16 Major Budget Components Salaries, benefits, pension bonds $34,106,294-40% 7% 12% 3% 40% Day Labor Contract $5,339,492-6% 32% 6% Fuel, Equipment Maintenance and Debt Service $27,828,249-32% Service Contracts, TCEQ Fees and Capital Fund Transfer $5,933,983-7% Department Total - $86,480,147 Intercity Services (e.g., CIS, landfill lease, 311, SAP Billing, HR, Safety) $10,313,064-12% Construction Materials, Fleet Parts, Roll- Carts and Supplies $2,959,065-3% 13


15 Revenue by Source 20% Residential revenue $64,921,844-75% 2% 1% Commercial Accounts $1,729,466-2% 2% City Facility Collection Revenues $761,229-1% 75% Recycling Revenues $2,100,000-2% Department Total $87,188,361 Landfill-Disposal Revenues $17,675,822-20% 14
16 Sanitation Fee and Gate Rate Overview 15
17 Sanitation Residential Fee History Sanitation Fee FY 2007 through FY 2016 $25.00 $20.00 $15.00 $10.00 $5.00 $ Fee $18.85 $19.53 $20.98 $20.34 $20.25 $20.25 $20.25 $20.64 $21.31 $22.79 Change $0.97 $0.68 $1.45 ($0.64) ($0.09) $0.00 $0.00 $0.39 $0.67 $ $1.81 cent increase (8.6%) since The 2009 residential fee, adjusted for inflation through 2015 (10.5%), would equate to a rate of $23.05 today.
18 Other Cities FY 16 Residential Fees (96 gallon cart Service) Dallas $22.79 Fort Worth $22.75 San Antonio $22.18* Phoenix $26.8 Austin $49.50** San Jose $96.21 Note: Dallas currently collects more than twice the bulk/brush tons per household than other Texas cities like Austin, Ft. Worth and San Antonio that have limited annual collections and set out limits. Service levels vary by city, please see appendix for service level detail. 17 *Includes $2.00 Environmental Fee ** Includes $7.65 Clean Community Fee
19 McCommas Bluff Gate Rate History $22.0 $21.0 $20.0 $19.0 $18.0 $17.0 $16.0 FY 07/08 FY 07/08 FY 08/09 FY 09/10 FY 10/11 FY 11/12 FY 12/13 FY 13/14 FY14/15 FY15/16 FY FY 07/08 FY 07/08 FY 08/09 FY 09/10 FY 10/11 FY 11/12 FY 12/13 FY 13/14 FY14/15 FY15/16 Rate $18.0 $19.0 $21.0 $21.0 $21.5 $21.5 $21.5 $21.5 $21.5 $
20 19 Funding Outlook
21 Funding Outlook Estimated major expense or revenue forecast*: Temporary labor contract - up to $2.5M annually (as estimated in FY 14-15) Recent RFP submissions being reviewed and evaluated Anticipate Council consideration May/June Annual 1% franchise fee increase until FY 2019 an additional $660K annually ($1.98M over next 3 years) Fleet debt service increasing due to fleet age and replacement (assuming $8M annual procurement) FY 17 - $1.2M over FY16 (6.7M total debt payment) FY 18 - $1.4M over FY17 (8.1M total debt payment) FY 19 - $1.3M over FY18 (9.4M total debt payment) 20 *Preliminary information which is subject to change
22 Funding Outlook (Cont d) Need to increase annual Capital Construction Fund Transfer by $1.3M To meet future cell construction funding schedule Employee merits and benefits, as well as fleet maintenance and fuel cost are under review Recycling revenue will fluctuate with commodity prices and new contract terms that begin in January 2017, current estimates: FY 16 - $1.7M FY 17 Estimate - $700K (new contract terms and low commodity prices) 21
23 Key Business Planning Objectives (FY2016 FY2020) 22
24 Key Business Plan Objectives Improve Sanitation Services as a complete solid waste service provider Review and implement industry best practices Increase efficiency and reduce service quality issues Participate in quality and efficiency initiatives Improve fleet procurement and replacement program Reduce fleet age and standardize equipment when possible Update and optimize collection routes, including rightsizing equipment Support employee development and retention initiatives Support and develop job specific training programs Support Departmental Employee Advisory Council (EAC) efforts Increase professional development and improve succession planning efforts Continue strategic planning efforts Implement the City s Local Solid Waste Management Plan (Zero Waste Plan) Evaluate collection processes and programs for Council review Evaluate long term funding needs and develop strategies to mitigate impact on the residential fee 23
25 Current Planning Efforts Fleet replacement and maintenance program Working with a solid waste consultant to conduct a fleet maintenance and replacement review Need to establish an optimized replacement program to mitigate increased maintenance cost, increase equipment availability and improve driver usability Evaluate and right size the collection fleet FY 16 landfill revenues are projected to be $3.4M over budget The landfill received a spike in tonnage after two regional landfills closed last spring due to flooding, and much of that tonnage has been sustained above historic levels FY 16 revenues and any increased future landfill revenues could be dedicated for fleet debt or cash purchase of fleet reducing long term debt impacts Landfill gate rate being reviewed Increased gate rate revenues could be dedicated to capital construction funding and equipment needs Every $1.0 gate rate increase = $500k - $800k in additional revenue (depending on volume) 24
26 Current Planning Efforts Sanitation is working to reduce unplanned costs and route quality issues Reducing truck driver hiring times when vacancies occur New truck driver training program developed Training new drivers, driver trainees and current drivers to help enhance and develop truck driver skills Continuing route planning and optimization efforts Reviewing collection services and programs Briefed Quality of Life on the City s bulk and brush program Evaluating options or alternatives for Council consideration Balancing collection boundaries as needed Reviewing need for an additional transfer station 25
27 Sanitation Services: 26 Summary Is an Enterprise Department owned and operated by the City of Dallas Provides solid waste collection services to approximately 240,000 residential customers Operates and manages the McCommas Bluff Landfill that receives and disposes of approximately 1.8M tons of waste annually Operating and capital costs are funded through rates or fees charged to residential and commercial customers Will continue to plan for the future by implementing the City s long range Zero Waste Plan, reviewing collection practices and programs, and preparing for future growth and regulatory requirements Will continue efforts to evaluate cost and increase efficiency, while providing improved reliability and service quality for all of our customers
28 27 QUESTIONS?
29 Appendix Departmental Service Detail Residential Collection Services McCommas Bluff Landfill Operations McCommas Bluff Gate Rate Overview Debt and Capital Construction Fund Outlook Other Cities Service Levels and Fees 28
30 29 Residential Collection Services
31 Residential Collection Services Includes collection of residential refuse, recycling, and bulk and brush. Also includes special services and waste diversion. Five regional collection districts and three regional transfer stations 30
32 Residential Collection Services Refuse and Recycling Collections: 240,000 residential accounts Once weekly refuse and recycling pick-up Collection days (Monday, Tuesday, Thursday and Friday) 110+ refuse and recycling routes run daily 115+ collection vehicles utilized daily 100,000 service opportunities per day and 21M opportunities annually 7,500 miles driven daily and 1.5M miles driven annually Annual collection tonnages: 230,000 tons Refuse 55,000 tons - Recycling 31
33 Residential Collection Services Bulk and Brush Collections: 240,000 residential service opportunities monthly Four weekly collection areas (Week 1, 2, 3 & 4) 165,000 tons collected annually 32
34 Residential Collection Services Transfer Stations: Bachman (northwest), Fair Oaks (northeast) and Westmoreland (southwest) Utilized by daily residential collections (refuse, recycle, and bulk and brush) Residential self haul days (days and times listed on webpage) Cash customer disposal (Bachman only) Recycling drop off containers Electronics drop off Tire drop off 33 Monthly tonnage collected and transferred from each station (excluding recycling tonnage) Bachman 11,700 tons Fair Oaks 5,400 tons Southwest 5,100 tons
35 34
36 Residential Collection Services Special Services Delivery of over 100 new or replacement roll-carts daily Daily roll-cart repair Weekly City facility collections Approximately 220 City facility locations Daily property damage repair (minor) Dead animal collection (ROW, animal shelter, veterinary clinics) 16,000 service request annually 27,000 dead animals collected annually 7 days a week service Provide monthly BOPA (Batteries, motor Oil, latex Paint, Antifreeze) events citywide 35


 Manages contract with Dallas County")

37 Residential Collection Services Zero Waste Division Manages City s recycling processing contract Manages 150 recycling drop off locations throughout the city Attends over 200 outreach events annually Manages marketing efforts Manages UNT contract for in school education curriculum (w/disd) Manages contract with Dallas County for Household Hazardous Waste collection and disposal Including annual regional collections Hold bi-annual Recycling Round-up events 36
38 Historical Recycling Tonnages 60,000 50,000 40,000 30,000 20,000 10,000 0 FY 2007 FY 2008 FY 2009 FY 2010 FY 2011 FY 2012 FY 2013 FY 2014 FY 2015 Tons 20,149 29,664 34,582 44,444 48,983 51,301 53,280 53,706 55,317 37
39 McCommas Bluff Landfill Operations 38
40 McCommas Bluff Landfill Serves as a Type I regional landfill accepting municipal solid waste from the City s residential collections, citizens self haul, cash customers and commercial solid waste haulers Gate rate of $21.50 Discounted rates for contracted long-term/guaranteed tonnage customers Over 900 permitted acres with approximately 95M cubic yards of available space (approximately 47 yrs.) Contract with Dallas Clean Energy McCommas Bluff for landfill gas recovery, processing and eventual sale Utilizes an enhanced leachate recirculation system for accelerated waste decomposition and gas generation 39
41 McCommas Bluff Landfill McCommas Bluff Landfill Receives over 5,000 tons daily and approximately 1.8M tons annually Second largest in the state based on annual tonnage received Over 300,000 scale house transactions annually ~1,100 daily transactions $17.5M in annual tipping fee revenue $2.4M in annual landfill gas revenue (General Fund) Operating and open 6 days Monday thru Saturday 40
42 41 Landfill Tonnage History
43 42 McCommas Bluff Gate Rate
44 Gate Rate Change Overview Current rate is $21.50 per ton Compared to area landfills, the McCommas Bluff Landfill has the lowest posted gate rate Many posted gate rates at area landfills are over $30/ton Private area landfills can negotiate discounts of posted gate rates and these rates are not published The gate rate has remained the same since FY due to economic conditions and to minimize the risk of losing major non-contracted commercial customers A gate rate increase poses a risk of losing some cash and large commercial customers, but regional rates may warrant change 43
45 Gate Rates For Area Landfills 44 Site Location Operator Gate Rate Notes McCommas Bluff Dallas, TX City of Dallas $21.50 per ton Skyline Ferris, TX Waste Management $85.99 min charge for first 5 yds. or less; $9.50 for each additional yard DFW Lewisville Lewisville, TX Waste Management $68 min/load, $9.50/yd. for uncompact, $12/yd for compacted Camelot Lewisville, TX Republic Waste Services Lewisville Landfill (C&D Only) Lewisville, TX Republic Waste Services Arlington Landfill Arlington, TX Republic Waste Services EDC Ennis, TX Republic Waste Services Hunter Ferrell Municipal C.M. Hinton Regional $30.36/ton $19.62/ton $10.14/yd $35/ton (inside City) $52/ton (outside City) $30.28/ton Irving, TX City of Irving $40/ton Garland, TX City of Garland $35/ton (automated) $52.50/ton(nonautomated) Grand Prairie Grand Prairie, TX City of Grand Prairie $32.00/ton Avg $$/ton for 30yds = Compacted - $32.67 Uncompacted - $63.41 Avg $$/ton for 30yds = Compacted - $36.36 Uncompacted - $55.88 Denton Landfill Denton, TX City of Denton $44/ton ($25 min) $10/ton - Concrete, asphalt, brick or $35/ton for a dump truck load
46 Debt and Capital Construction Fund (Outlook) 45
47 SAN: Long-term Debt Outlook (assuming level equipment purchase of $8M annually) 11,000,000 10,000,000 9,000,000 8,000,000 7,000,000 6,000,000 5,000,000 4,000,000 3,000,000 FY 2016 FY 2017 FY 2018 FY 2019 FY 2020 FY 2021 FY 2022 FY 2023 Series1 5,644,504 6,801,361 8,100,051 9,393,469 10,026,928 9,928,042 9,505,050 9,448,350 46
48 Capital Construction Fund Outlook (assumes annualized funding of $2M beginning in FY 17) FY 14 FY 15 FY16 FY 17 FY 18 FY 19 FY 20 FY 21 FY 22 FY 23 FY 24 FY 25 FY 26 FY 27 FY 28 FY 29 Transfer In Cell Construction Cash Ending Balance
49 48 Other Cities Service Levels and Fees

50 49 Rates and Services For Other Texas Cities
")
51 50 Rates and Services For Other Cities (Nationwide)