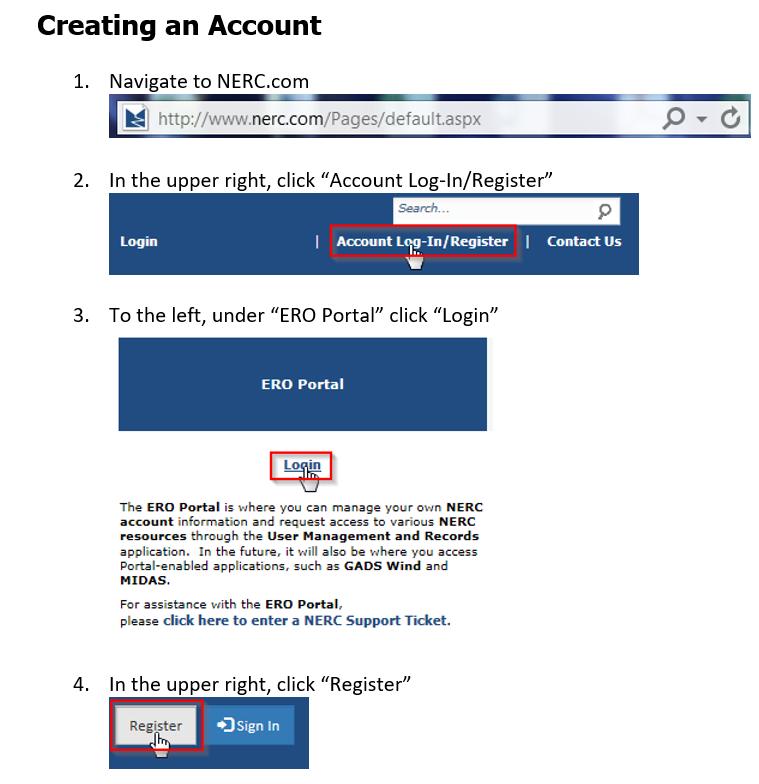
ERO Reliability Performance Update
|
|
|
- Nancy Andrews
- 5 years ago
- Views:
Transcription


1 ERO Reliability Performance Update Sam Chanoski, NERC Director of Situation Awareness and Event Analysis Fall 2017 NPCC Compliance and Standards Workshop November 9, 2017

2 Daily Severity Risk Index 2 RELIABILITY ACCOUNTABILITY
3 Daily Severity Risk Index 2016 SRI was driven by days with multiple smaller Events 2017 SRI will be driven by major storm days 3 RELIABILITY ACCOUNTABILITY
4 Event Severity Remains on Good Glideslope 4 RELIABILITY ACCOUNTABILITY
5 Metric 1: Fewer, Less Severe Events Why is it important? Measures risk to the bulk power system (BPS) from Bulk Electric System (BES) events How is it measured? Number of Category 3 5 events Cumulative trend line in the composite daily event Severity Risk Index (esri) for Category 1 3 events Data Trend Q2 Q3 Threshold 1 Target 1 Threshold 2 Target 2 No Category 3 or above events Current slope of trend line is negative 5 RELIABILITY ACCOUNTABILITY

6 Control Chart of Qualified Events Process change: Started capturing Cat 1h events 9 Cat 1h events; EOP in effect 1 entity had 4 repetitive modelling problems 6 RELIABILITY ACCOUNTABILITY
7 Qualified Event Causes 674 Events have been cause coded with 2279 identified causes, through 12/31/ RELIABILITY ACCOUNTABILITY

8 Qualified Event Causes Things break in ways unanticipated by design in the context of an organization 674 Events have been cause coded with 2279 identified causes, through 12/31/ RELIABILITY ACCOUNTABILITY
9 Why is it important? Metric 2: No Gaps in Reliability Standards and Compliance Monitoring Reduces risk to BPS reliability from potential gaps in standards and compliance by employing corrective action How is it measured? Using a consistent process, analysis of all Category 3 5 and select events for any gaps in standards and compliance and mitigation implementation Any gaps result in action plans to address reliability risks Data Trend Q2 Q3 Threshold 1 Target 1 No Category 3 or above events; studying sample events of interest Gap analysis results reported at year-end 9 RELIABILITY ACCOUNTABILITY
10 Metric 3: Resource Deficiencies are Foreseen Why is it important? Ensures ERO Enterprise is performing comprehensive and timely reliability assessments that identify and spotlight resource adequacydeficiencies How is it measured? Number of resource deficiencies that caused load outages over 300 MW or Energy Emergency Alert Level 3s (EEA-3s) that were not identified in prior seasonal or long-term reliability assessments in the past three years Data Trend Q2 Q3 Threshold 1 Target 1 No firm load outages over 300 MW due to resource deficiencies or common mode failures No EEA-3s declared due to resource deficiencies 10 RELIABILITY ACCOUNTABILITY
11 Metric 4: No Unauthorized Physical or Cybersecurity Access Resulting in Disruption to BES Facilities Why is it important? Measures risk to the BPS from cyber or physical security attacks How is it measured? Number of load losses or disruptions to BES operations due to cyber attack Number of load losses over 100 MW due to physical attack and the trend line for events over the most recent two year period 11 RELIABILITY ACCOUNTABILITY
12 Metric 4: No Unauthorized Physical or Cybersecurity Access Resulting in Disruption to BES Facilities Threshold 1 Target 1 Threshold 2 Target 2 Data Trend Q2 Q3 No load loss or disruption of BES operations due to cyber attack No load loss over 100 MW due to physical attack Assessing trend of physical security events 12 RELIABILITY ACCOUNTABILITY
13 Serious Risk Violations 13 RELIABILITY ACCOUNTABILITY
14 Metric 5: Reduced Reliability Risk from Noncompliance Why is it important? Incentivizes discovery and mitigation of violations by registered entities and measures violation severity as well as completion of mitigations How is it measured? Trend of compliance severity risk index (with and without CIP V5) and amount of repeat moderate and severe risk violations Percentage of self-identified noncompliance Mitigation completions rates 14 RELIABILITY ACCOUNTABILITY
15 Metric 5: Reduced Reliability Risk from Noncompliance Threshold 1 Target 1 Threshold 2 Target 2 Threshold 3 Target 3 Data Trend Q2 Q3 Compliance severity index (excluding CIP V5) reported at Q4 Compliance severity index (including CIP V5) reported at Q4 86.6% of all noncompliance is self-identified Threshold 4 Current mitigation completion rates are 70.5% (2016), 97.6% (2015), and 99.8% (2014 & older). Target 4 Target 5 Repeat risk trends reported at Q4 15 RELIABILITY ACCOUNTABILITY
16 Metric 6: Reduced Risks in Targeted Areas Why is it important? Measures risks to BPS reliability from five priority causes: 1. Generating unit forced outages due to cold weather 2. Misoperations rate of performance 3. Automatic AC transmission outages caused by human error 4. Transmission outages due to AC substation equipment failures 5. Transmission line outages due to vegetation 16 RELIABILITY ACCOUNTABILITY

17 Seasonal Potential Production Lost Due to Forced Outages 17 RELIABILITY ACCOUNTABILITY
18 Metric 6a: Reduced Events Caused by Generating Unit Forced Outages Due to Cold Weather How is it measured? Number of load losses from generating units forced outages due to cold weather Comparison of annual Effective Forced Outage Rate (EFOR) of generating units to previous years during the most extreme cold winter months Data Trend Q2 Q3 Threshold 1 No events with firm load loss in winter months Target 1 Comparison to previous year EFORs underway 18 RELIABILITY ACCOUNTABILITY

19 Misoperations Rates Continuing to Decline 19 RELIABILITY ACCOUNTABILITY
20 Metric 6b: Annual Misoperations Rate of Performance How is it measured? Annual Misoperations rate (cumulative rate through Q2 2017), with a threshold of less than 9% and target of less than 8% Data Trend Q2 Q3 Threshold State of Reliability report had an annual rate of 8.3% Target 1 20 RELIABILITY ACCOUNTABILITY
21 Continued Decline in Average Transmission Outage Severity 21 RELIABILITY ACCOUNTABILITY
22 Transmission Outages Caused by Human Error How is it measured? Number of load losses greater than 300 MW caused by human error Trend of outages per circuit caused by human error (target is 5% decline with reduced impacts) Comparison of outages caused by human error resulting in firm load loss to previous five-year average 22 RELIABILITY ACCOUNTABILITY
23 Metric 6c: Number of Automatic AC Transmission Outages Caused by Human Error Threshold 1 Target 1 Target 2 Data Trend Q2 Q3 No events with load loss greater than 300 MW from human error Outages per circuit caused by human error currently not declining by 5% Average number of events currently fewer than five-year average 23 RELIABILITY ACCOUNTABILITY
24 Outages Due to AC Substation Equipment Failures How is it measured? Number of load losses greater than 300 MW due to AC substation equipment failures Trend of outages per circuit caused by AC substation equipment failures (target is 5% decline with reduced impacts) Comparison of outages caused by AC substation equipment failures resulting in firm load loss to previous five-year average 24 RELIABILITY ACCOUNTABILITY
25 Metric 6d: Number of Transmission Outages Due to AC Substation Equipment Failures Threshold 1 Target 1 Target 2 Data Trend Q2 Q3 No events with load loss greater than 300 MW from substation equipment failures Outages per circuit caused by substation equipment are declining by greater than 5% and outages are declining Average number of events currently fewer than five-year average 25 RELIABILITY ACCOUNTABILITY
26 Metric 6e: Number of Transmission Line Outages Due to Vegetation How is it measured? Number of FAC-003 violations that are identified, processed, and filed Number of vegetation-related outages that are not violations of FAC-003 gathered through quarterly data submittals Data Trend Q2 Q3 Threshold 1 Target 1 At least one outage due to FAC-003 violations in Q2 13 vegetation-related outages through Q2 that were not FAC-003 violations 26 RELIABILITY ACCOUNTABILITY
27 System Characteristics are Changing Retirement/displacement of conventional generation Variable energy resources Rapid penetration of electronically-coupled resources Essential Reliability Services Frequency Response Voltage Support Ramping and flexibility needs Rapid penetration of new loads System controls and protection coordination Increasing interface with distribution-centric resources Increasing importance of cybersecurity 27 RELIABILITY ACCOUNTABILITY
28 Skating to Where the Puck is GOING TO Be California Load, Wind & Solar Profiles --- Base Scenario January 2020 Load & Net Load (MW) 34,000 32,000 30,000 28,000 26,000 24,000 22,000 20,000 18,000 6,700 MW in 3-hours 7,000 MW in 3-hours 12,700 MW in 3-hours 9,000 8,000 7,000 6,000 5,000 4,000 3,000 2,000 Wind & Solar (MW) 16,000 1,000 14,000 0 Net_Load Load Wind Total Solar 28 Net Load = Load - Wind - Solar RELIABILITY ACCOUNTABILITY

29 29 RELIABILITY ACCOUNTABILITY
30 NPCC 2017 Fall Compliance and Standards Workshop Event Analysis Update November 7-9, /2/17 1
31 Agenda Correlation between esri neocategories & Events Analysis Program (EAP) Categories Background Review Summary Conclusions 11/2/17 2
32 Agenda continued What-If Methodology Trial esri neocategory Methodology Overview What if #1 - Cat 1.a.i What if #2 - Cat 1.a.i Conclusions 11/2/17 3
33 Correlation - Background NPCC Events Analysis (EA) staff reviewed all 2016 & 2017Q1 NPCC Category 1 5 Events NERC calculates each event s severity risk index (esri) Staff performed a correlation assessment between esri scores and Categories Staff created five neocategories based on esri ranges 11/2/17 4
34 Correlation - Review Summary 72 incidents 44 events went through the process 25 Category 1.h - which is the loss of EMS/SCADA 19 other events 11 events have esri = 0 (zero) 8 other events with non-zero esri 11/2/17 5
35 Correlation - Review Summary (continued) Of remaining events with non-zero esris 5 were Category 1.a.i 1 was Category 1.a.ii 1 was Category 1.c 1 was Category 2.f 11/2/17 6
36 Correlation - Conclusions Generally EAP Categories and neocategories align Members may want to look deeper at Events where EAP Categories and neocategories do not align or esri values for an event are close to the top end of the range. The esri values are more a measure of impact than risk. As such, EAP Categories whose Events usually have esri = 0, although less impactful should be evaluated based on their risk to reliability. 11/2/17 7
37 What-If Methodology Trial Application of the What-If methodology on actual events 11/2/17 8
38 What-If - esri NERC s Performance Analysis Subcommittee (PAS) created the Severity Risk Index (SRI). Each event has its own Severity Risk Index called an esri. Input to the esri are 1) Load Loss, with varying Durations, 2) Transmission Loss (weighted by voltage class) and 3) Generation Loss 11/2/17 9
39 What-if - neocategories NPCC staff analyzed continent-wide events and their associated esris and developed esri ranges to correspond to the Categories in NERC s Event Analysis Program These esri ranges are called neocategories As provided to RCC in May 2017, NPCC staff developed a What-If methodology for evaluating continent-wide EAP qualifying events using neocategories and esris 11/2/17 10
40 What-If - neocategory Ranges (continued) neocategory min(esri) max(esri) /2/17 11
41 What-if - Methodology Trial The trial will illustrate: The ability to gauge an event s impact within its neocategory range A quantitative assessment of the amount of additional Load, Transmission, or Generation (individually) needed to increase the neocategory An evaluation of a credible worst case scenario (if provided by the entity) to ascertain whether an event could evolve into a higher neocategory range, thereby having had a higher impact. 11/2/17 12
42 Evaluated What-If - Overview Two External (outside of NPCC) Category 1.a.i type Events What changes to the actual Baseline esri inputs / variables ( What-If ) would result in this event becoming a higher category ( i.e. a more impactful event?) 11/2/17 13
43 What-if - Category 1.a.i The definition of a Category 1.a.i event is an event that results in an unexpected outage that is contrary to the design of three or more BES Facilities caused by a common disturbance. 11/2/17 14
44 What-If - Chart Illustration Baseline is the actual event variables Individual changes to esri variables to see how much additional would be needed to change neocategory Load & Duration Transmission Generation Real Provided by Entity What additional Load-Transmission-Generation could have credibly been lost had the event occurred under different conditions... what If? 11/2/17 15
45 What-If Event #1 Results Baseline Load Load + Duration Gen Trans Real Real (max Gen) esri Load Duration Gen Trans > > > > > /2/17 16
46 What-If Event #1 (continued) For this event to jump into the neocategory 2 range its esri would have to be above To accomplish that one of the following scenarios on the next slide would have to occur in addition to the loss of 1328MW of generation and the loss of the one kV class transmission circuit, which actually did happen. 11/2/17 17
47 What-If Event #1 (continued) Some possible scenarios could be: Lose 450 MW of load restored within 4 hours or Lose 225 MW of load for 4 or more hours Lose a total generation of 2755 MW (1328 MW plus 1427 MW additionally) Two kv class transmission circuits along with one kv class circuit and two kv class circuits along with the original base transmission loss of two kv class line. 11/2/17 18
48 What-If Event #1 (continued) These values are considered extreme amounts of increase to each individual variable alone, which in addition to what was actually lost during the event, would effectively raise this event s esri value into a higher neocategory. in some cases these amounts are not actual achievable; however, they act as a relative gauge of what would be required. 11/2/17 19
49 What-If Event #1 (continued) Although not illustrated here, any combination of any two or all three of the variables could also be varied to determine a relative exposure to an increase in risk. 11/2/17 20
50 What-If - Event #1 (continued) Furthermore, to zero in on a more reasonable evaluation of any categorized event, one could analyze a true worse case scenario associated with the event by the entity providing a credible worst case contingency that could have occurred had this event occurred at a different time, configuration, dispatch, etc. 11/2/17 21
51 What-If Event #1 Evaluation (continued) Entity provided credible worst case scenario: Additional loss of three kv class transmission circuits (4 in total) Along with an increase in loss of generation to 1883 MW This resulted in increasing the esri to , which is still below the and therefore still neocategory 1 11/2/17 22
52 What-If Event #1 (continued) Additionally, a further comparison was made to the credible contingency provided ( see last column) which increased the possible max loss of generation from 1883MW (which was derated due to a blended fuel mix being used ) to its actual maximum of 2238MW. This addition along with the possible loss of transmission previously described was enough to push the esri value above the Threshold for neocategory 2. 11/2/17 23
53 What-If Event #2 Results Baseline Load Load + Duration Gen Trans Real 1 Real 2 esri Load Duration Gen Trans > > > > > /2/17 24
54 What-If Event #2 Evaluation (continued) Once again, the Baseline column depicts the event s actual esri value of and the associated outages that occurred on that day. For this case, the event resulted in the loss of five transmission circuits of the > 300 but <400 kv voltage class and one transmission circuit of the >100 but <200 kv voltage class. 11/2/17 25
55 What-If Event #2 (continued) In order for this event to jump into the neocategory 2 range its esri would have to be above , as with the previous event. 11/2/17 26
56 What-If Event #2 (continued) To achieve that, any of the following would have had to occur in addition to the loss of the elements lost that day: Lose 310 MW of load for less than 4 hours or lose 155 MW of load for 4 or more hours Lose 1205 MW of generation Lose a total of eight kv (3 additional) transmission circuits, one kv transmission circuit and two (1 additional) kv transmission circuits 11/2/17 27
57 What-If Event #2 (continued) These values are extreme amounts of each individual variable, that are considered in addition to what was actually lost during the event, would make this event move into a higher neocategory, should this be capable of occurring. Although not illustrated here, any combination of all three of the variables could also be calculated/ varied to determine a relative exposure to an increase in risk. 11/2/17 28
58 What-If Event #2 (continued) Entity provided credible worst case scenario: Additional loss of either 50 MW of load (Real 1) or 100 MW of load (Real 2). Although the resulting esri is higher, it is below , therefore remains a neocategory 1 11/2/17 29
59 Questions 11/2/17 30
60 Fall 2017 Compliance and Standards Workshop November 7-9, 2017 Criteria Services Update Gerry Dunbar Manager, Reliability Criteria 11/09/2017
61 Outline Remedial Action Schemes (RAS) A-10 Classification of BPS Elements 2017 Criteria Services Activity: Directories #9 and #10 Retired (eff. 7/01/19) Directory #8 Revised Directories #2 and #5 Under Review 11/09/2017
62 Remedial Action Schemes (RAS) RAS Definition Approved by FERC 11/19/2015 Continent wide need to establish a uniform definition. NERC Glossary term for SPS revised ( See RAS ) PRC (RAS ) Approved by FERC 9/20/2017 PRC-12-1, PRC 13-1, PRC Withdrawn PRC and PRC Retired PRC Enforcement Date 1/1/2021 Limited Impact RAS (NPCC Type III) Regional Review 11/09/2017
63 Remedial Action Schemes (RAS) NPCC Transition NERC Rules of Procedure Regional Criteria not inconsistent with ERO Standards Task Force on Coordination of Planning (TFCP) Provides Oversight of Existing SPS Review Process NPCC Transition to RAS: Existing NPCC RAS/SPS List: SPS conforms to Revised Definition of RAS SPS does not conform Newly Identified RAS NPCC Glossary Term SPS See NERC RAS NPCC Directory #7 Other NPCC Documents 11/09/2017
64 A-10 BPS Classification Scope of Review: Identify critical facilities for the applicability of NPCC more stringent criteria Simplify the existing methodology to make it less labor intensive Improve consistency across areas in application and outcomes Action Plan --- Phase # Review Existing Methodology Identify Problems Propose Improvements Develop New Methodologies Present Recommendation to RCC December /09/2017
65 A-10 BPS Classification Action Plan Phase #2 2018: Validate Phase #1 Proposals Consider BPS Applicability to Directories Provide Final Recommendation Revise A-10 Document Existing and Alternative Methodologies: Goal: Identify Critical Facilities Simplify Methodology (less resources required) Greater Regional Consistency Application Outcome 11/09/2017
66 NPCC Criteria Services 2017 Activity Directories #9 and # Verification Criteria MOD-25-2 D#9 and D#10 Retirement Effective 7/01/19 Directory #8 --- System Restoration Battery Testing Requirements (PRC -005) NPCC Glossary Terms Basic Minimum Power System Key Facilities Critical Components Directory #2 Emergency Operations Directory #5 Reserve Currently Under Review Anticipate Open Process Posting /09/2017
67 NPCC Criteria NPCC Full Members Develop and Own Criteria Who: NPCC Full Members Obligated to Comply Non-Members Other Agreements (Tariff and Interconnection) What: NPCC Bulk Power System (Defined via A-10 Methodology) More Stringent Criteria Section 313 NERC Rules of Procedure Why: Promote Reliability Augment and Enhance ERO Standards 11/09/2017
68 11/09/2017 Questions or Comments?
69 Misoperation Information Data Analysis System Portal (MIDAS) NPCC Compliance & Standard Workshop Hartford, Connecticut, Fall 2017 Rafael Sahiholamal Senior RAPA Engineer 1


70 Protection System M: Misoperation I: Information D: Data A: Analysis S: System 2
71 History of PRC /4/17 3

72 Inactive PRC-004 Standard 4
73 PRC-004-5(i) 5
74 Requirement 5 R5. Each Transmission Owner, Generator Owner, and Distribution Provider that owns the Protection System component(s) that caused the Misoperation shall, within 60 calendar days of first identifying a cause of the Misoperation: Develop a Corrective Action Plan (CAP) for the identified Protection System component(s), and an evaluation of the CAP s applicability to the entity s other Protection Systems including other locations; or Explain in a declaration why corrective actions are beyond the entity s control or would not improve BES reliability, and that no further corrective actions will be taken. 6
75 Publicize lessons learned to the industry Develop meaningful metrics to assess Protection System performance The purpose of this Data Request Identify trends in Protection System performance that negatively impact reliability Provide focused assistance to entities in need of guidance Identify remediation techniques to reduce the rate of occurrence and severity of Misoperations 7
76 Phase I - MIDAS Reporting Process Registered Entities (GOs, TOs, DPs) Quarterly Relay Operation - Misoperation Submission due 60 days after end of each quarter MIDAS Misoperations Information Data Analysis System Region checks that all data have been Processed Successfully NPCC SP-7 verify reported misoperations in NPCC Region SP-7 communicates questions and/or changes to data NERC and Regional Entities Reporting Entities submit worksheets and receive status s, but cannot see data in the MIDAS system (one-way interactions with MIDAS) NPCC SP-7 verify data submissions and communicates questions and/or changes to data

77 9

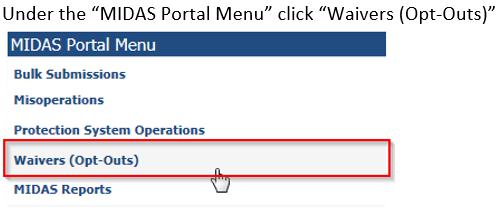
78 Operation Tab Protection System Misoperations: 10

79 Misoperation Tab Protection System Misoperations: 11
80 Phase II - MIDAS Portal Reporting Process Registered Entities (GOs, TOs, DPs) Quarterly Relay Operation - Misoperation Submission due 60 days after end of each quarter User interface for bulk submission, review, manual record entry and edit, and reports MIDAS Misoperations Information Data Analysis System Region checks that all data have been Processed Successfully NPCC SP-7 verifies the reported misoperations in NPCC Region Increased report types NERC and Regional Entities Reporting Entities submit worksheets, enter/edit information manually, review data in system, and creates/exports data and reports (two-way interactions through MIDAS Portal) NPCC SP-7 verify data submissions and communicate questions and/or changes to the data. Phase II MIDAS provides more reports analyzing types of misoperations in the database.
81 MIDAS Vs MIDAS Portal Current Misoperations Reporting Process Entity submits misoperations data through internetbased submission page XRM MIDAS Region views records in MIDAS and exports data and reports Misoperations Reporting Process for MIDAS Portal Entity accesses misoperations data through MIDAS Portal for submission, manual entry/edit of data and creates/exports data or reports XRM MIDAS Region views records in MIDAS and exports data and reports


82 MIDAS Portal 14


83
84 User Permissions


85 MIDAS Portal Menu
86
 Process Entities have access to data in the system Submission Status and History Reported Data Submission Validations Standardized Reports for Regions and")
87 Enhancements to MIDAS Replacement of the current page used to submit Enhanced Security Scheme Entity Admin, Reporter, and Observer levels for MIDAS Portal New portal for Entity for Manual Entry and Editing Revised Opt-Out (Waiver) Process Entities have access to data in the system Submission Status and History Reported Data Submission Validations Standardized Reports for Regions and Entities
88 Training Announcement Misoperation Information Data Analysis System Portal WebEx Training Training Dates & Information: Dial-in: US Toll October 24, :00 p.m. 2:30 p.m. EDT (17:00 18:30 UTC) Click here for: Join WebEx Meeting Access code: November 9, :00 p.m. - 2:30 p.m. EST (18:00-19:30 UTC) Click here for: Join WebEx Meeting Access code: November 20, :00 p.m. - 2:30 p.m. EST (18:00-19:30 UTC) Click here for: Join WebEx Meeting Access code: November 28, :00 p.m. - 2:30 p.m. EST (18:00-19:30 UTC) Click here for: Join WebEx Meeting Access code: The training will demonstrate how to use the functionality of the MIDAS portal that will be released in coming weeks.
89 System Protection Working Group (SP-7) Review the analysis of misoperations of protection systems on the bulk electric system including SPS Maintain a record of all reviewed misoperations Calculate statistic of protection system misoperations Work with the NPCC Event Analysis Team Share lessons learned with Members and industry from review of misoperations Recommend NPCC additions to the NERC reporting template 21

90 NPCC Protection System Misoperations by Cause 22
91 From 2016 SOR Report: 23
.")
92 TO, GO, and DP PRC-004-5(i) Misoperation/Operation data reporting NERC Rules of Procedure, Section ( data request ). MIDAS Portal Submittal for 3 rd Quarter 2017 Submittal timeframe 60 Days after each quarter 24
93 Protection System Misoperations Webpage 11/4/17 25
94 Questions? MIDAS presentation - Spring 2016 Compliance Workshop (page 99): nts/master%20day%202%20spring% pdf rsahiholamal@npcc.org NERC MIDAS: midas@nerc.net 26