Icing Climate and Productivity: Choosing the Right Sensor
|
|
|
- Polly Ellis
- 5 years ago
- Views:
Transcription

1 Icing Climate and Productivity: Choosing the Right Sensor Performance Assessment of Meteorological Sensors in Icing Conditions I
2 Technical Content Cédric Arbez, P. Eng Charles Godreau, Jr. Eng., M. Eng. Kossivi Tete, M. Sc. Marilys Clément, M. Sc. Authors Lucie Fauteux, Certified Editor Marilys Clément, M. Sc. TechnoCentre éolien, 2017 II
3 TABLE OF CONTENTS SUMMARY...IV INTRODUCTION... 1 OPERATING IN ICING CLIMATES... 4 ICING: RECAP... 6 ICING CLIMATE: MEASURING SENSOR EFFICIENCY ICING CLIMATE: OPTING FOR A WINNING SOLUTION REFERENCES III
4 SUMMARY In many countries, wind energy in cold climates represents a promising option for diversifying the energy portfolio and reducing greenhouse gas emissions. Harnessing these wind resources is complicated, however, by the potential for ice accretion on various infrastructures and especially on turbine blades. It goes without saying that every year these issues result in significant revenue losses for wind farm operators. Detecting icing events is thus critical for wind farm operators striving to ensure the profitability and security of their facilities, hence the importance of employing icingresistant meteorological sensors. It is also important, however, to be able to accurately assess the performance of sensors on the market. As a leader in renewable energy integration and wind farm optimization, the TechnoCentre éolien recently developed a methodology for quantitatively assessing the performance of meteorological sensors exposed to icing conditions. This comparative methodology which is based on the analysis of images obtained from sensors deployed in real-world conditions supported the development of a performance index to accurately evaluate the performance and reliability of various sensors during an icing event. Users can now resort to this index to compare different sensors, make well informed choices as a function of site-specific characteristics, reduce losses and thus optimize wind farm profitability. IV

5 INTRODUCTION For many countries, wind energy in cold climates represents a promising option for diversifying energy sources and integrating renewable energies. The major wind regimes and high wind potential of mid-latitude regions exposed to the jet stream come to mind. Harnessing these wind resources is complicated however by the potential for ice accretion on various wind farm infrastructures, especially turbine blades [1]. As of the end of 2015, cumulative installed wind capacity in cold climates in Scandinavia, North America, Europe and Asia had reached approximately 127 GW, with an anticipated annual growth rate of 11.7 GW through 2020 [2]. Closer to home, in the span of a decade ( ), Canada s total installed wind energy capacity grew by over 900% [3], and in 2016 total capacity reached 11,898 MW [4]. Figure 1 Installed Wind Capacity in Cold Climates Source: Adapted from International Energy Agency Wind Task 19 [2] 1

6 Studies published in 2011 estimated that for wind farms installed in Canada at the time, production losses associated with cold climate amounted to 1.01 million MWh, which at then-current prices represented approximately $100M and a missed opportunity to offset 305,450 tonnes of CO 2 equivalent. Production losses associated with cold climate MWh M$ CO 2 1,01 million tonnes In eastern Canada alone, 1,500 turbines are affected by icing, causing annual losses in the order of $50M [3]. 2

7 In this context, to ensure wind farm profitability, it is imperative to employ instrumentation that is capable of accurately measuring the meteorological conditions affecting energy production. It is equally important, however, to have the necessary tools to evaluate with the same precision the performance of sensors offered on the market. Given the wide range of meteorological sensors available, which ones are best? Which models exhibit the best performance for the greatest reliability during icing events? In the past few years, concerted effort by the international scientific and applied research communities has given rise to a number of promising advances in terms of adapting wind farms to cold climate and icing conditions. As a leader in this field and representative of Canada in the International Energy Agency s Task 19 working group on wind energy in cold climates, the TechnoCentre éolien (TCE) has recently developed a methodology for assessing the performance of meteorological sensors exposed to icing conditions. Based on experimentation conducted in real-world conditions, this methodology allows for the acquisition of quantitative measurements of reliability and performance for sensors exposed to icing conditions. These measurements allow users to cross-compare various sensors and choose the most suitable one(s) for the conditions encountered at their site. 3

8 OPERATING IN ICING CLIMATES The formation of ice on blades and other turbine structures causes a multitude of problems, whether in terms of operation, failures, premature component wear or operational losses. More specifically, the accumulation of atmospheric icing induces: Losses of data or data availability from sensors during icing events Partial or complete (stoppage of turbine) production losses Hazards for staff/equipment related to ice throw Evidently, ice accumulation has a non-negligible impact on the quality of measurements recorded by sensors, anemometers, etc. A study conducted in 2010 demonstrated that, if the wind is blowing at 10 m/s, a small quantity of ice on the cups and shaft of an anemometer can lead to an under-estimation of the wind speed of approximately 30% [5]. Furthermore, other tests on the impact of ice accretion on a WAA non-heated anemometer demonstrated that an ice accumulation of 1 mm resulted in an underestimation of 22% compared to the true wind speed, while an accumulation of 4 mm could lead to a measurement 50% below the actual wind speed [6]. 4
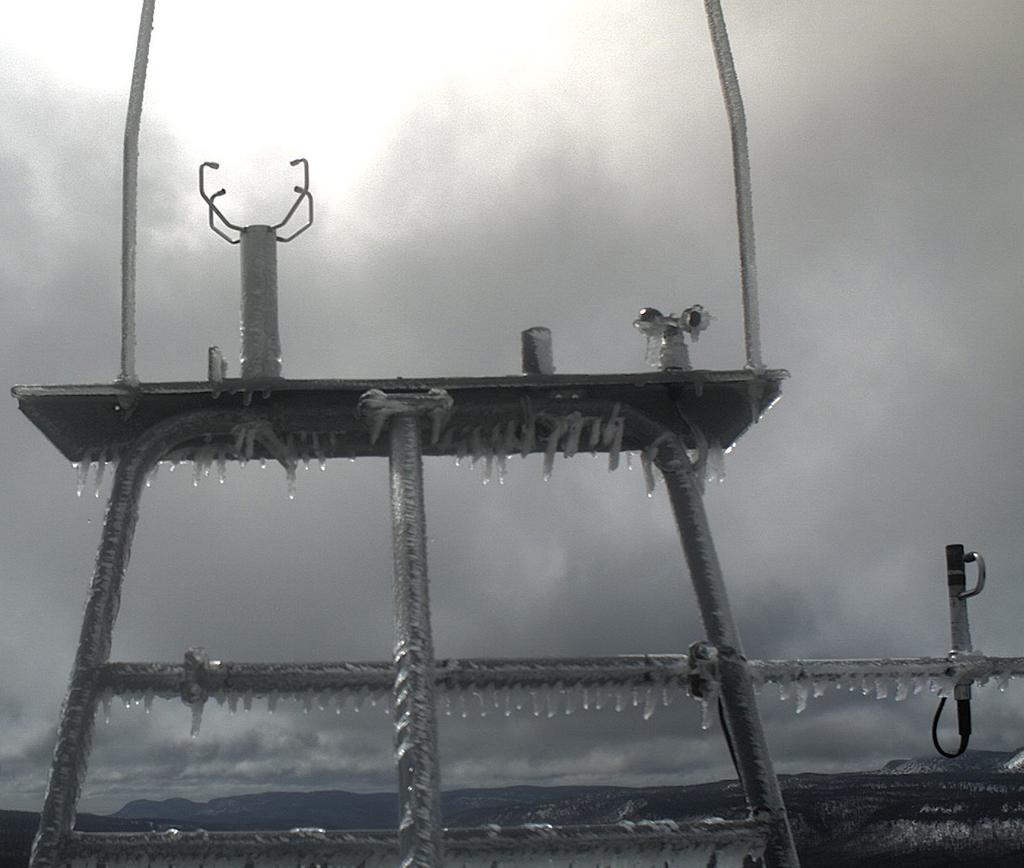
![Every year, atmospheric icing results in significant revenue losses In Canada, between the months of November and April, icing conditions may be observed up to 20% of the time [7].](/docs-images/86/94770175/images/9-2.jpg "Assuming a selling price of $0.09/kWh, the annual revenue of a 2 MW wind turbine with a capacity factor of 35% would be $552,000.")
9 Every year, atmospheric icing results in significant revenue losses In Canada, between the months of November and April, icing conditions may be observed up to 20% of the time [7]. Assuming a selling price of $0.09/kWh, the annual revenue of a 2 MW wind turbine with a capacity factor of 35% would be $552,000. With ice-induced losses in the order of 5%, annual financial losses would be $28,000, while losses in the order of 20% would be likely to cause financial losses of up to $110,000 [8]. 5
10 ICING: RECAP Icing is a phenomenon characterized by an accumulation of ice on infrastructures such as nacelles and turbine blades or meteorological sensors. It is mainly caused by precipitation such as freezing rain and wet snow or by in-cloud icing (mist or fog at temperatures below 0 C). Table I Characteristics of Different Types of Ice Rime Type Characteristics Instantaneous freezing of water droplets present in a cloud or fog in contact with a structure Glaze Freezing rain that accumulates on a structure Wet snow Mix of different types of precipitation (snow crystals, rain, freezing rain, etc.) that adhere to a structure Hoar frost Solid deposit of water vapour in conditions of high air humidity, low wind, and low temperature Mixed icing Combination of different types of ice 6


11 Hoar frost Glaze Rime Mixed icing 7


12 AN ICING EVENT CONSISTS OF FIVE STAGES: meteorological icing, incubation, instrumental icing, rotor icing 1 and recovery Figure 2 Stages of Ice Formation Phases Source: Adapted from International Energy Agency Wind Task 19 [9] 1 Rotor icing: period during which ice is present on one or more turbine blades. Due to differences in size, shape, flow velocity and vibrations, rotor icing is generally not equal to instrumental icing. On average, incubation and ablation times for rotor icing are shorter than for instrumental icing. Additionally, the duration of rotor icing is very different for a turbine that is shut down versus one that is operating. 8

13 Table II Description of Different Phases of an Icing Event Meteorological icing: Phase during which atmospheric conditions are favourable for ice accretion. During this phase, ice accumulates on instruments and/or infrastructures. Incubation: Instrumental icing: Rotor icing: Recovery: Phase during which ice accumulation is insufficient to be detected by instruments or to affect the turbine s output. During this phase, meteorological conditions are conducive to ice formation, but instruments and/or infrastructures operate normally. Phase during which ice accretion remains on the instruments and/ or infrastructures, disrupting their normal operation. For example, meteorological data can be considered invalid for analysis and the turbine s energy production may be affected. Stage during which ice is present on one or more turbine blades. This phase follows meteorological icing. During this phase, ice stops accumulating, but remains present on the instruments or infrastructures. The recovery phase ends when the infrastructure completely sheds the ice or when the instrument resumes normal operation. 9

14 ICING CLIMATE: MEASURING SENSOR EFFICIENCY Adapting turbines to cold climates is thus predicated on the use of ice-resistant sensors that accurately measure the meteorological conditions affecting energy production. But how can sensor performance be measured? The comparative methodology used to evaluate different sensor types and the image analysis developed by the TechnoCentre éolien facilitate the following exercises: Evaluation of resistance to icing and performance of sensors in icing conditions; Quantitative comparison of performance of different sensors. Methodology The method used to assess sensor performance in icing conditions is based on comparative experimentation developed from data collected during ten icing events that occurred at two sites in Quebec operated by the TechnoCentre éolien: five at the Experimental Northern Wind Energy Site (SNEEC) located in Rivière-au-Renard and five at the Mont Needle site in Murdochville. These events were selected to ensure a good disparity in terms of severity, intensity, duration and type of icing event. The total duration of an icing event is calculated from the apparition of meteorological icing until the end of instrumental icing. Severity represents the maximum quantity of ice accumulated on a structure during an icing event. This parameter can be expressed as the length of the ice profile (mm), the linear ice load (kg/m) or the ice class described in the ISO12494 standard [10]. Intensity corresponds to how quickly ice accumulates on a structure. It is expressed as a variation rate of the linear ice mass, expressed in kilograms per metre-hour (kg/m-h). 10

15 Figure 3 Experimental Sites Murdochville Rivière-au-Renard Table III Locations of Sites under Study Latitude [ ] Longitude [ ] Elevation [m] Rivière-au-Renard 49,00-64, Murdochville 48,94-65,
 are characterized by a meteorological icing incidence of 0.")
16 Infrastructure The data used in this study are obtained from sensors installed on a wind turbine and several met masts installed at Rivière-au-Renard (Experimental Northern Wind Energy Site, SNEEC) and Murdochville. These two sites (IEA Class 2 and 4, respectively) are characterized by a meteorological icing incidence of 0.5% to 10% of the year, instrumental icing incidence of 1% to 30% of the year, and icing-induced energy losses of between 0.5% and 25% of annual production [12]. Table IV Infrastructure Information Site Infrastructure Sensor Elevation [m] Rivière-au-Renard Heated cup anemometer with non-heated cups 82 Heated 2D ultrasonic sensor 82 Heated ultrasonic sensor 78 Heated cup anemometer 80 Non-heated cup anemometer 80 Murdochville Heated 3D ultrasonic sensor 11 Heated cup anemometer with non-heated cups 13 Heated 2D ultrasonic sensor 15 Heated cup anemometer 15 12

![Accretion rate corresponds to how quickly ice accumulates on a structure. It is expressed in terms of the variation of the linear ice mass [kg/m-h].](/docs-images/86/94770175/images/17-2.jpg "Image analysis is based on data obtained from cameras installed on a wind turbine or met mast.")
17 Identification of Icing Events via Image Analysis Identifying icing events entails using observations to determine the beginning and end of an episode during which there is a confirmed presence of ice on the infrastructures. The methodology to measure ice accretion using imagery is described by Bolduc et al. [13]. Accretion rate corresponds to how quickly ice accumulates on a structure. It is expressed in terms of the variation of the linear ice mass [kg/m-h]. Image analysis is based on data obtained from cameras installed on a wind turbine or met mast. The events are thus identified and characterized in terms of duration, intensity, severity and icing type. The periods of meteorological icing, instrumental icing, incubation and recovery are also calculated. 13

18 Measuring Sensor Performance The ratio between the duration of meteorological icing and the duration of instrumental icing (index I COST 727 ) is used to calculate and compare the performances of different sensors exposed to an icing event. [14]. Where: t instr : duration of instrumental icing [h] t meteo : duration of meteorological icing [h] This methodology suggests combining I COST 727 with the site s icing exposure intensity. Although it draws from this idea, the methodology developed by the TechnoCentre éolien integrates the severity of each individual icing event in a performance index. Sensors icing resistance evaluation parameters Operational recovery of date: a good ratio of recorded data indicates good anemometer performance. Instrumental icing, divided into two categories: total instrumental icing and extreme instrumental icing. Total instrumental icing corresponds to the duration that the sensor is affected by ice during the event, while extreme instrumental icing corresponds to the period when the sensor is affected to the point that it completely stops operating. These two instrumental icing categories are compared to the duration of meteorological icing. Severity of icing event: for a given duration, an anemometer s performance will be better if the event is of high severity than if it is of low severity. 14


19 Calculating Anemometer Performance Index (IP TCE ) The TechnoCentre éolien takes the performance analysis one step further by considering other parameters to assess the resistance of the sensors to icing. These various parameters are combined in the performance index IP TCE : The performance index is used to evaluate to what extent the anemometer operates properly and remains reliable throughout an icing event. Table V Definition of Ratios Used in IP TCE Formula Variables and performance of associated anemometers Definition of variables use t instr : time that the sensor is affected by icing during the event [h] t meteo : total duration of icing event as evaluated by image analysis [h] t Extr : time that sensor is completely stopped by icing during the event [h] t TOT : total duration of icing event as evaluated by image analysis [h] D R : data recovered operationally for the duration of the event D TOT : total data that should be generated for the duration of the event : severity parameter 15
20 Table VI Parameter a as a Function of Icing Event Severity Severity [mm] 1,5 < 50 1 > 50 In conclusion, a good anemometer not affected by or rendered completely inoperational by icing and properly recording data will have a low index. Conversely, an anemometer that performs poorly will have a high index. Index values and associated recommendations are presented in Table VII. Table VII Classification of Anemometers as a Function of IP TCE IP TCE Classification 0 0,3 Excellent instrument, resistant to icing 0,3 0,6 Good instrument, relatively resistant to icing 0,6 1 Instrument not particularly resistant to icing >1 Instrument not recommended, not resistant to icing 16
21 ICING CLIMATE: OPTING FOR A WINNING SOLUTION Wind farm optimization inevitably requires resource characterization, efficient operation and the use of site-suitable instrumentation. The aforementioned statement is particularly valid in an icing climate, where it is critical to use sensors that offer good ice resistance and, correspondingly, good performance. From a purely economic perspective, it is important to bear in mind that the cost of the sensor alone cannot guarantee an optimal return on investment. In fact, using a sensor suited to the meteorological conditions of the site, even if such an instrument comes at a higher cost, enhances the potential to reduce operation and maintenance costs while increasing the availability and quality of data collected. The performance index developed by the TechnoCentre éolien remains the most accurate tool for evaluating the performance and reliability of the vast majority of sensors on the market and currently used in the industry. The experimentation and development of a methodology for the quantitative evaluation of sensor performance carried out by the TechnoCentre éolien proved to be highly conclusive. It is now possible to accurately determine the performance of ice sensors exposed to icing events. Conclusion The results obtained in the course of TCE s experiments demonstrate that heated ultrasonic anemometers offer the best performance when exposed to icing. These are closely followed by heated anemometers with non-heated cups, which offer good performance, while non-heated anemometers exhibit poor performance and would consequently not be recommended for wind farms affected by icing. 17
22 Figure 4 IP TCE for Anemometers at Rivière-au-Renard for Five Selected Icing Events IP Heated cup anemometer with non-heated cups (part heated: ball bearing) Heated 2D ultrasonic sensor (part heated: sensor arm) Heated cup anemometer (part heated: cups) Hon-heated cup anemometer Heated ultrasonic sensor (part heated: entire sensor) Event 1 Event 2 Event 3 Event 4 Event 5 Average 18
23 Figure 5 IP TCE for Anemometers at Murdochville for Five Selected Icing Events IP Ultrasonic sensor (part heated: sensor arm) 0.06 Heated 2D ultrasonic sensor (part heated: entire sensor) 0.17 Heated cup anemometer (part heated: ball bearing)) Heated cup anemometer with non-heated cups (part heated: ball bearing) Event 1 Event 2 Event 3 Event 4 Event 5 Average 19
24 Oftentimes, choosing superior sensors means boosting wind farm efficiency by reducing losses, uncertainty and costs and thereby ensuring a favourable return on investment. Thanks to this methodology, wind farm proponents and operators will now be able to consult proven results when attempting to determine the most suitable equipment to acquire to ensure a meaningful return on their investment. The methodology summarized in this paper also represents an interesting advance for wind farm optimization. Ultimately, application of this performance calculation method by other national or international research teams working in cold climates to a greater number of sensors and sites will facilitate compilation of an information bank on sensor performance and therefore help improve knowledge and achieve a common objective: optimizing the profitability of wind energy so as to promote better integration thereof in tomorrow s energy portfolio. Who We Are TechnoCentre éolien is a centre of expertise that supports the development of the wind industry through research, technical assistance, technology transfer and technical support for businesses. TCE specializes in developing solutions for renewable energy integration, optimizing wind farm performance and supporting growing SMEs in the wind sector. 20
25 REFERENCES 1. Laakso T., Holttinen H., Ronsten G., Tallhaug L., Horbaty R., Baring Gould I., Lacroix A., Peltola E. and Tammelin B. State-of-the-art of wind energy in cold climates: Wind Energy Production in Cold Climate, [Online], April [ 2. International Energy Agency (IEA) Wind Task 19. Emerging from the cold, Wind Power Monthly, [Online], July 29th [ 3. Lacroix A. Assessment of wind energy production penalties due to cold climate in Canada, CanMET, pp. ISBN , 25 p, CANWEA. Puissance installée, [Online]. [ 5. Laakso T.,Baring-Gould I., Durstewitz M., Horbaty R., Lacroix A., Peltola E., Ronsten G,. Tallhaug L., Wallenius, T. State-of-The-art of wind energy in cold climates, [Online], [ 6. Tammelin B., Cavaliere M., Holttinen H., Morgan C., Seifert H., Säntti K. Wind energy production in cold climate, Finnish meteorological institute, [Online]. [ pdf]. 7. Natural Ressources Canada. Wind Energy in Cold Climates, [Online]. [ 8. New Energy Update. Canadian wind sector looks to de-icing systems to boost energy yield, revenues, [Online], October 10th [ 9. International Energy Agency (IEA) Wind Task 19. «IEA Task 19: IEA Wind TCP Recommended Practice 13», 2 e Edition: Wind Energy in Cold Climates, IEA Wind, Technical Report, ISO-12494, Atmospheric icing of structures, IEA Wind. Expert group study on recommended practices 13. Wind Energy Projects in Cold Climates, submitted to the executive committee of the international energy agency programme for research, development and deployment on wind energy conversion systems, Second Edition, Febuary 2017, [Online]. [ task_19/020617/task 19 RP 13_v2 report_2017_exco appr 1Feb17_FINAL.pdf]. 12. Arbez, C., Clément, M., Godreau, C., Swytink-Binnema, N., Tete, K., Wadham-Gagnon, M. Développement et validation d un modèle de prévision du givre pour les parcs éoliens, TechnoCentre éolien, 136 p., March Bolduc D., Wadham-Gagnon M., Boucher B., Jolin N., Camion A., Petersen J. and Friedrich H. Field Measurement of Wind Turbine Icing, in IWAIS XV, St-Jonh, Newfoundland, Canada, Fikke S., Ronsten G., Heimo A., Kunz S., Ostrozlik M., Persson P.-E., Sabata J., Wareing B., Wichura B., Chum J., Laakso T., Säntti K. and Makkonen L. COST-727, Atmospheric Icing on Structures: Measurements and data collection on icing: State of the Art, MeteoSwiss,
26 70, rue Bolduc Gaspé, Québec, Canada G4X 1G Our principal partners