Hydrology and Water Management in the upper Snake River Basin:
|
|
|
- Erika Whitehead
- 5 years ago
- Views:
Transcription


1 Hydrology and Water Management in the upper Snake River Basin: The roles of climate, geology, and water management in determining stream flow Rob Van Kirk & Science Staff Henry s Fork Foundation
2 Outline Yellowstone hotspot and upper Snake River basin Small-group activity: hydrographs Hydrologic regimes: geology and climate Effects of irrigation on hydrologic regimes Water use, water budgets, and groundwater Effects of climate change on hydrologic regimes BREAK Basic concepts of water rights and administration Small group activity: How much do you know about water management? Current topics in water management and administration in the upper Snake River basin
3 N 50 miles Plate Motion : 1 inch/year Yellowstone Hot Spot
4 N 50 miles Uplift Zone Hot Spot Bow Wave Uplift Zone
5 N 50 miles Greater Yellowstone Ecosystem ft. elevation contour Beartooth Plateau Centennial Mts. Yellowstone Lake Great Salt Lake Bear Lake

6 In western U.S., precipitation depends on elevation.
7 Hydrograph activity Draw annual (Oct 1 Sep 30) graph of streamflow over time: Group 1: Snake River above Jackson Lake (Snake River headwaters) Group 2: Big Springs (Henry s Fork headwaters) Group 3: Small stream in desert southwest Group 4: Coastal river in central California Group 5: Snake River below Palisades Reservoir Group 6: Henry s Fork immediately downstream of Island Park Dam


8 Hydrologic Regime of a River flow magnitude, timing, duration, frequency and rate of change natural regime determined by climate and geology alteration caused by water use and management hydrologic regime drives geomorphic processes in channel and floodplain geomorphic processes determine habitat alteration of hydrologic regime can change species
9 Examples of hydrologic regimes Discharge/3-year mean Warm River, ID: ground water Snake River, ID: snowmelt Trinity River, CA: rain/snow mixed 0 1-Oct Oct Oct 1929
10 Precipitation/ET depth (in) Mean ( ) Island Park Climate 0.2 Precipitation (in) 0.18 Evapotranspiration (in) 0.16 Temperature (F) Temperature (F) Oct 1-Nov 1-Dec 1-Jan 1-Feb 1-Mar 1-Apr 1-May 1-Jun 1-Jul 1-Aug 1-Sep Date Almost all growing-season precipitation is lost to evapotranspiration Water supply for stream flow comes from accumulated snowpack
11


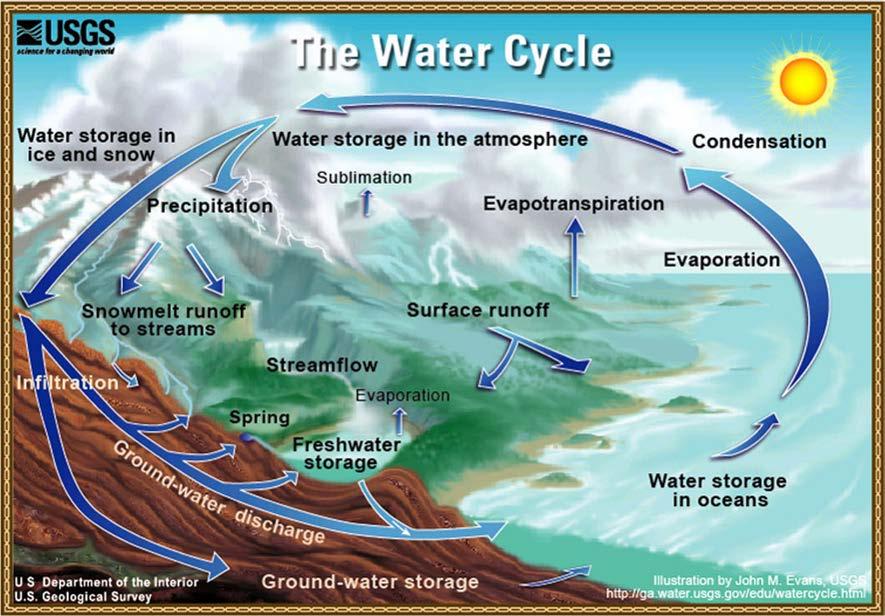
12 What is storage? Retaining water in a watershed from the time it falls as precipitation to a later time when it is released. Primary watershed storage mechanisms 1. Snowpack 2. Soil and aquifers 3. Lakes and Reservoirs
13 Topography and elevation influence how snowmelt becomes stream flow Oct 1-Nov 1-Dec 1-Jan 1-Feb 1-Mar 1-Apr 1-May 1-Jun 1-Jul 1-Aug 1-Sep Discharge/period-of-record mean Teton Cr.: high and steep HF at Island Park: flat and low Fall R.: intermediate Uniform distribution


14 Snowmelt vs. groundwater streams Stream and riparian habitats determined by hydrogeology. Snowmelt-dominated rivers have large floodplains, wide riparian areas and complex channels. (S. Fork Snake) Groundwater streams have small floodplains, narrow riparian areas, and uniform channels (HF headwaters).
15 Upper HF dominated by groundwater, Teton dominated by snowmelt, Fall River intermediate Daily Discharge (cfs) 10,000 9,000 8,000 7,000 6,000 5,000 4,000 3,000 Henry s Fork Water Supply Teton SL to St. A. Teton ab. S. Leigh Fall River IP to Ashton HL to Island Park Henrys Lake 2,000 1, Oct 1-Nov 1-Dec 1-Jan 1-Feb 1-Mar 1-Apr 1-May 1-Jun 1-Jul 1-Aug 1-Sep Date


16 Agriculture Economically important, dependent upon water storage and delivery, ~95% of water used in Idaho
17 Effect of Irrigation Storage and Delivery on Stream Flow Henry s Fork below Island Park Dam, Stream flow (cfs) Oct 1-Nov 1-Dec Unregulated Regulated 1-Jan 1-Feb 1-Mar 1-Apr 1-May 1-Jun 1-Jul 1-Aug 1-Sep Decreased winter flow (storage) Increased summer flow (delivery) Peak shifted to mid-summer
18 3500 Effect of Irrigation Diversion on Stream Flow Fall River near Chester, Stream flow (cfs) Oct 1-Nov Unregulated Regulated 1-Dec 1-Jan 1-Feb 1-Mar 1-Apr 1-May 1-Jun 1-Jul 1-Aug 1-Sep Decreased summer flow Small alteration in peak (slightly lower and narrower) No alteration during winter
19 Effects of storage/delivery, diversion, and groundwater return flows Henry s Fork at Rexburg, Stream flow (cfs) Unregulated 7000 Regulated Oct 1-Nov 1-Dec 1-Jan 1-Feb 1-Mar 1-Apr 1-May 1-Jun 1-Jul 1-Aug 1-Sep Late-summer reservoir delivery is diverted (no late-summer peak) Why is regulated flow higher than natural during winter?
20 50-75% of surface water diverted returns to streams through groundwater pathways. Distribution of Surface Withdrawals 100% 80% 60% 40% 20% Evaporative Loss Crop Evapotranspiration Return via Surface Flow Return via Groundwater 0% Upper Teton Henrys Fork Upper Snake
21 Irrigation seepage is 40-70% of total aquifer recharge Distribution of Recharge Sources 100% 80% 60% 40% 20% Direct Precipitation Stream Seepage/Tributary Underflow Irrigation Seepage 0% Upper Teton Henrys Fork Upper Snake
22 Effects on Stream Hydrographs MAX MIN Modeled Teton River hydrographs under different irrigation scenarios
23 Effects on Stream Hydrographs MAX MIN Modeled Teton River hydrographs under different irrigation scenarios

24 Increased groundwater influence can have negative ecological effects Decreased duration and magnitude of peak flows Decreased stream channel and floodplain complexity Decreased ability of native cutthroat trout to compete with nonnative rainbow trout Increased opportunity for invasion of nonnative species


25 But, irrigation seepage has been a major component of hydrologic regimes since late 1800s, providing: Improved water quality Floodplain/wetland/riparian habitat Fisheries Flood control Natural storage (no dam required) GW for municipal/domestic use Supply for downstream users

26 Basin-wide, trends in groundwater discharge are universally negative


27 Reasons for groundwater decline 1. Increased irrigation efficiency sprinklers vs. flooding pipes vs. ditches
28 Reasons for groundwater decline 1. Increased irrigation efficiency sprinklers vs. flooding pipes vs. ditches 2. Increased groundwater pumping Annual Volume (acre-feet) 350, , , , , ,000 50, Year Annual volume of groundwater pumped by A&B Irrigation District

 30,000 25,000 20,000 15,000 10,000 5,000 Fremont County Madison County Teton County Subdivisions on")
29 Reasons for groundwater decline 1. Increased irrigation efficiency sprinklers vs. flooding pipes vs. ditches 2. Increased groundwater pumping 3. Loss of irrigated agricultural land loss of irrigation seepage Increased groundwater use Cumulative area (acres) 30,000 25,000 20,000 15,000 10,000 5,000 Fremont County Madison County Teton County Subdivisions on irrigated lands Year Platted subdivisions in Henry s Fork watershed.
30 Result: Increased consumptive use of water (Upper Snake R. Basin shown here)

31 The now-infamous ESPA/1000 Springs graph From IDWR Director s order establishing the ESPA groundwater management area, 11/03/2016.
32 Climate data from Island Park Warm, dry conditions in recent years have not been seen since 1930s 1950s-1970s were stable, wet, and cool Trends over past 40 years: Warmer More variable water supply
33
34
35 Effects of early runoff in regulated system
36 Climate change in the regulated system 1. Water rights were claimed and reservoir system was built under a different climatic regime. 2. Early runoff creates timing difference between water supply and irrigation need. Result: more reliance on storage water and groundwater pumping. 3. Precipitation is more variable, making planning and system operations more difficult. 4. Effects of climate change in regulated systems are less predictable that in natural systems. 5. Organisms and ecological communities adapt more quickly than socioeconomic institutions. 6. BUT, the organisms we get may not be ones we want. 7. Adaptation is key to sustainability of all water-related resources in warming, more variable climate.
37 Break
38 Key elements of a water right Right for private use of waters of the State Property right guaranteed by Idaho Constitution Consists of (among other things): Establishment basis (historic, decreed, licensed, etc.) Beneficial use and season of use Priority date Point of Diversion Place of Use Source Amount (diversion rate or storage volume) Right may be used only when water is available
39 Beneficial Uses Over 70 officially recognized, including: Irrigation Domestic (13,000 gal/day, ½-acre; never denied) Stock watering Commercial Fish propagation Minimum stream flow Storage Groundwater recharge Without beneficial use there is no water right (Non-use for 5 years could result in forfeiture)
40 Prior Appropriation System First in time is first in right Water-right priority date determines who gets to use water when demand exceeds supply Administered by water districts Water District 1 covers all of the upper Snake above Milner except a few small basins All water rights (including storage) from headwaters to Milner are a single system Water flows past Milner Dam only when: Supply exceeds demand (and reservoir capacity) Absolutely needed for downstream uses
41 Natural flow right vs. storage right Natural flow Water that would be in the river in absence of reservoirs and diversions on that day Most were claimed prior to construction of reservoirs Most limited to irrigation-season use only Quantity measured in diversion rate (cfs) Irrigation return is natural flow Storage Water stored in and delivered from reservoirs Quantity measured in volume (acre-feet) Rights can be filled only during winter, or during irrigation season AFTER all senior natural flow rights are satisfied Storage holders can deliver and use stored water after natural flow rights expire


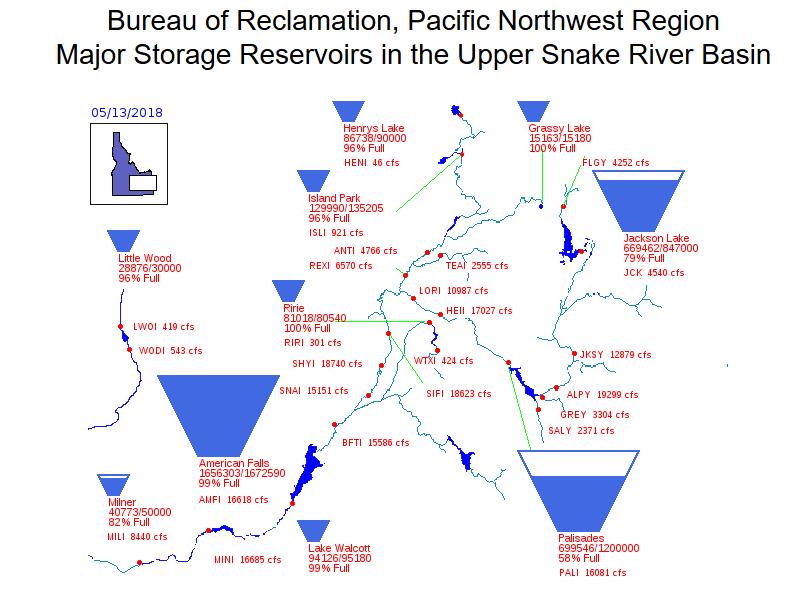
42 Upper Snake Basin: 11.1 million acre-feet annual supply Montana Idaho Nevada Utah Wyoming 0.4 Island Park Res. 2.6 Ashton Teton R. Henrys Fork Jackson Lake 0.5 Idaho Falls 5.1 Hagerman American Falls Res. 0.7 Pocatello Palisades Res. Twin Falls 0.5 N 100 km
43


44 Water District 01 (Upper Snake) surface water system diagram
 Map from")
45 Surface and groundwater highly linked on ESPA & tributary-basin aquifers Thousand Springs Blackfoot- Neeley Reach (American Falls Reservoir) Map from IDWR

46 Upper Snake River as part of the whole
47 Supply, Storage, Demand, and Delivery
48 Upper Snake River Water Budget Volume (Maf) TOTAL INFLOW Withdrawals Surface withdrawals in water district GW withdrawals on ESPA 1.60 All other GW/SW withdrawals 1.20 TOTAL WITHDRAWALS Outflow Inflow-withdrawal (water not withdrawn) 1.02 Irrigation return via ESPA 4.00 Other irrigation return 2.59 Subtotal (outflow at King Hill) 7.61 Crop evapotranspiration 3.71 TOTAL OUTFLOW Change in ESPA storage = INFLOW - OUTFLOW -0.20
49 Question/Discussion Activity: Fun facts about water in the upper Snake River basin Group 1: What natural-flow priority dates are considered senior (always get water) in the upper Snake basin? What priority dates are considered junior (run out of water nearly every summer)? What are the priority dates for storage water in the reservoir system? Group 2: What are differences among water districts, irrigation districts, and canal companies? Group 3: Storage water in Palisades Reservoir is routinely used in the Henry s Fork. How can this happen? Group 4: There are only three uses for which storage water is released past Milner Dam. What are those uses? Group 5: Name three major administrative/legal actions taken since 1984 that have affected water management in the Snake River basin? What have been the effects of those actions? Group 6: What is managed aquifer recharge? How do we quantify the effects of managed recharge on the aquifer and on flow from the aquifer back to the river?
50 Natural Flow Priority Dates Earliest in Idaho: 6/11/1855, held by Nez Perce Tribe Earliest in eastern Idaho: 1865 for irrigation in Portneuf watershed Large right with 6/14/1867 priority held by Shoshone-Bannock Tribes Senior rights in Water District 01: 1874 to 1893 Junior rights in Water District 01: 1900 or later
51 Volume (million acre-feet) Storage Rights Priorities Palisades 7/28/1939 American Falls 3/30/1921 Palisades 3/29/1921 Jackson 5/24/1913 Jackson 8/23/1906 Ririe 3/18/1975 Henrys 7/29/1965 Grassy Lake 2/13/1936 Island Park 3/14/1935 American Falls 3/29/21 Island Park 3/29/1921 Henrys 5/15/1917 Jackson 8/18/1910 Walcott 12/14/1909
52 Irrigation Entities WATER DISTRICT: Administrative organization established by the State of Idaho for the purposes of measuring and accounting for water use. An elected or appointed watermaster oversees administration of water in the district. IRRIGATION DISTRICT: Incorporated, quasigovernmental organization with responsibility to physically deliver water (usually storage) to its members. Funded by collecting taxes from water users within its boundaries. Most in the upper Snake basin were formed in conjunction with authorization of a specific storage reservoir. CANAL COMPANY: Private corporation formed by a group of irrigators to physically divert and deliver water (usually natural flow) to company shareholders. Canal companies, versus individuals, often hold water rights.
53 Using Palisades water on Henry s Fork Water District 01 rental pool water is stored in Palisades Reservoir. Any storage-right holder in WD01 can rent water from this pool to make up shortfall in storage accrual. As long as there is physical water in the given stream reach to support diversion, this rented water can be diverted anywhere in the system upstream of Milner Dam. Physical and paper water need to coincide only at Milner Dam.

54 Is delivered from here Diverted here Water leased here Accounted here
55 Three uses for storage delivery past Milner Dam 1. Anadromous fish flow augmentation in lower Snake River. Annual average delivery from upper Snake is 200,000 ac-ft. 2. Power generation at Idaho Power facilities downstream of Milner (C.J. Strike, Swan Falls, Hells Canyon) 3. Maintenance of minimum streamflow requirement at Idaho Power s Swan Falls facility (5600 cfs in winter, 3900 cfs during irrigation season). This has been needed only once since the Swan Falls agreement in 1984.
56 Major Water-Administration Actions 1984: Swan Falls Settlement Agreement (Idaho Power & State) State agreed to minimum flow at Swan Falls power plant Intent: minimum flow provided by ESPA discharge Excess upper basin water allocated to new GW irrigation 1992: Moratorium on new groundwater irrigation on ESPA 1994: Conjunctive Management Rules 1990s - present: Water calls against GW users 2008: Eastern Snake Plain Aquifer Comprehensive Mgmt. Plan Goal: 600,000 ac-ft change in ESPA water budget Objective: 250,000 ac-ft per year managed recharge 2012: Revision of State Water Plan; focus on aquifers statewide 2015: Swan Falls minimum violated (storage water used to meet flow) 2015: Surface Water Coalition Groundwater user settlement GW users agreed to cut 240,000 ac-ft per year or mitigate 2016: ESPA groundwater management area established
57 Managed Aquifer Recharge Intentional injection of water into the aquifer, whether through canal seepage, infiltration ponds, or injection wells. Why? Increase discharge back into the river at Thousand Springs, American Falls Reservoir and other locations. Mitigate effects of groundwater pumping. Increase height of water table for all users. Three administrative types of managed recharge: Traditional winter diversion in Henry s Fork ( local good ) Idaho Water Resource Board program ( greater good ) Private recharge (specific amounts to meet mitigation needs through private leases and exchanges)
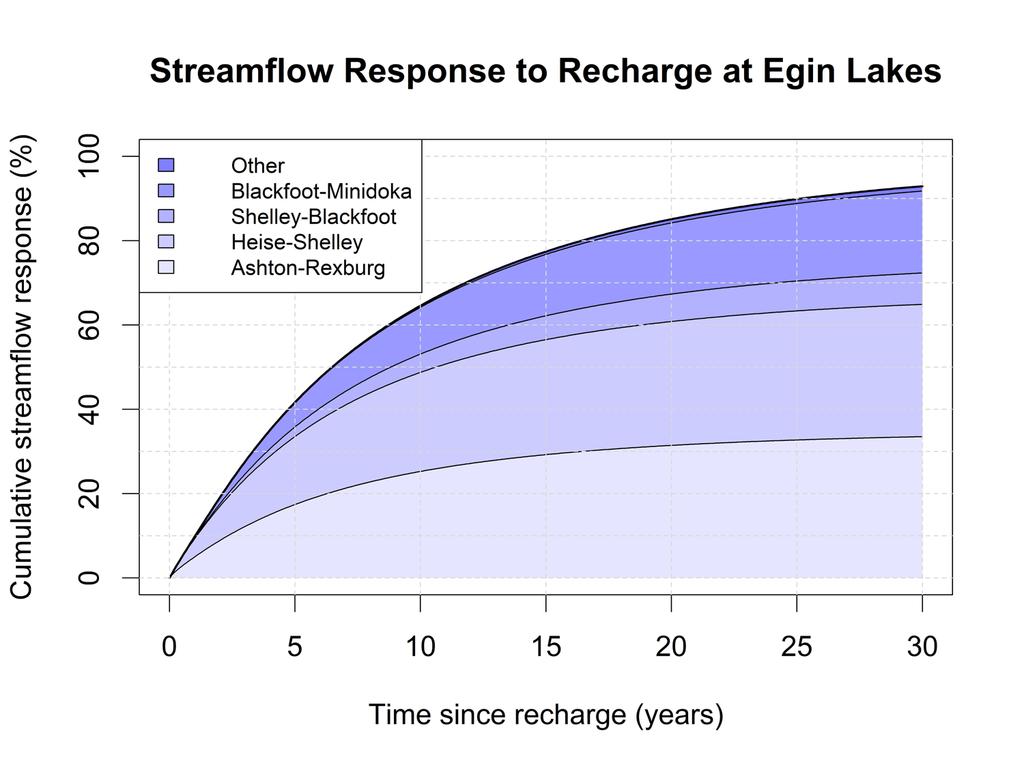
58 Example of response to recharge Spatial response of surface-water system to recharge: Increased discharge to river reach (gain) OR decreased loss from a river reach OR some combination of these Calculated using a computer model of the aquifer/river system Spatial response to recharge at Egin Lakes (near St. Anthony) River reach Percent of total response HF: Ashton to Rexburg 35.2% Heise to Shelley 33.0% Shelley to Blackfoot 8.3% Blackfoot to Minidoka 21.8% Downstream of Minidoka 1.7% TOTAL 100%
59 Example of recharge response (cont.) Temporal response of surface-water system to recharge: Two viewpoints: 1. How long until surface system responds to recharge? Fraction of recharge volume that has affected streamflow Time at which a given fraction of recharge volume has affected streamflow 2. How long does recharge affect aquifer storage? (complement of above: storage response + discharge response = 100%) Temporal response to Egin Lakes recharge Time since recharge event Discharge response Storage response 12 months (1 yr) 10% 90% 78 months (6.5 yrs) 50% 50% 302 months (25.2 yrs) 90% 10% 50% retention time is 6.5 years.
60
61
62
63 Summary Climate and geology determine natural hydrologic regimes Flat topography = higher groundwater component Water is stored in snowpack, reservoirs and groundwater Traditional irrigation: consumptively uses relatively little water is largest source of aquifer recharge on Snake River Plain has created/enhanced wetlands and late-season/winter flow Increased irrigation efficiency and groundwater pumping has decreased groundwater levels decreased return flow, particularly late in the summer Changes are good for some resources and users, bad for others Climate change results in earlier melt and more variability in supply; effects are increased in regulated system Water rights priorities throughout upper Snake system influence flow in all stream reaches Water rights administration plays a major role in determining how storage, delivery and diversion result in stream flow