Biomass Power Plant Development in California, Overview and Lessons Learned
|
|
|
- Buck Brown
- 5 years ago
- Views:
Transcription


1 Biomass Power Plant Development in California, Overview and Lessons Learned Renewable Energy Conference for California Tribes, January 22, 2008 Tad Mason,

2 Pioneering Efforts Biomass Utilization for the Production of Energy Products

3 What is Biomass? Biomass any solid, nonhazardous, cellulosic material derived from: forest-related resources, solid wood wastes, agricultural wastes, and plants grown exclusively as a fuel.* *based on the definition of biomass in the 2005 Energy Act
4 Woody Biomass Utilization A variety of value-added end uses have evolved over time Some are commercially proven and some are still in the RD & D Phases Lumber products, composite panels, pulp Soil amendments Landscape/landfill cover Bio-based products (plastics, solvents, etc.) Biofuels (ethanol, renewable diesel) Biomass power
5 Biomass Power Technology Two main components: An energy conversion system that converts biomass to useful steam, heat, or combustible gases A prime mover that uses the steam, heat, or combustible gas to produce power
6 Combustion Technology

7 Gasification The Future? Electricity/Heat Biofuels Potential
8 Advantages of Biomass When Compared to Wind and Solar Energy Provides baseload renewable energy (24/7) on a cost effective basis. Has numerous societal benefits: Supports hazardous fuels reduction and healthy forests Net improvement in air quality Provides employment (4.9 jobs/mw) Reduces waste material destined for landfills

9 Improving Air Quality
10 New Influencing Factors Effecting Biomass Plants (old and new) Growing waste disposal issues/opportunities Renewable energy gov t mandates/incentives New Financial and Owner Groups looking for renewable energy business deals Fossil fuel pricing abrupt current and future price increases Acceleration in the development of new biomass to energy conversion technologies Greenhouse gas reduction opportunities
11 DSIRE: January 2008 Incentives - Renewable Portfolio Standards *WA: 15% by 2020 OR: 25% by 2025 (large utilities) 5% - 10% by 2025 (smaller utilities) CA: 20% by 2010 * NV: 20% by 2015 AZ: 15% by 2025 MT: 15% by 2015 CO: 20% by 2020 NM: 20% by 2020 (IOUs) 10% by 2020 (co-ops) ND: 10% by 2015 MN: 25% by 2025 (Xcel: 30% by 2020) IA: 105 MW (IOUs) *10% by 2020 (co-ops & large munis) WI: requirement varies by utility; 10% by 2015 goal IL: 25% by 2025 MO: 11% by 2020 VT: RE meets load growth by 2012 NC: 12.5% by 2021 (IOUs) 10% by 2018 (co-ops & munis) ME: 30% by % by new RE NH: 23.8% in 2025 MA: 4% by % annual increase RI: 16% by 2020 CT: 23% by 2020 NY: 24% by 2013 NJ: 22.5% by 2021 PA: 18%¹ by 2020 MD: 9.5% in 2022 *DE: 20% by 2019 DC: 11% by 2022 * VA: 12% by 2022 HI: 20% by 2020 TX: 5,880 MW by 2015 Minimum solar or customer-sited RE requirement * Increased credit for solar or customer-sited RE ¹PA: 8% Tier I / 10% Tier II (includes non-renewables) State RPS State Goal Solar water heating eligible
12 California Experience Early Days Initial biomass plants developed in response to air quality/waste management issues. All biomass plants were co-located and generally operated as CHP. Most biomass waste was deposited in landfills and burned in the open.
13 Along Comes PURPA Public Utilities Regulatory Policy Act of 1978: Requires that investor owned utilities must purchase privately produced power at avoided cost rates. Created the market context that stimulated the development of the independent power industry in the US.
14 Other Incentives Renewable energy incentives of 1970 s and 1980 s caused renewed interest and development: Investment tax credits Energy tax credits CA tax incentives
15 California Private Sector Response Within 15 years approximately 1,000 MW of biomass power was developed and brought into service. Enough renewable energy for about 750,000 homes. Consumed biomass fuel at the rate of around 15,000,000 GT/year: Forest products manufacturing residuals Forest sourced biomass Agricultural waste Urban wood
16
17 PURPA Contracts Standard Offer 4 and the Boom Years 30 year contracts. First 10 years at fixed rates ($ /kWh). Year 1-10 rates based on energy forecasts with prices escalating well into future. Year 11 30, rates are based on wholesale energy rates (most floated based on natural gas rates). Power producers need to meet certain firm delivery standards to be considered a qualifying facility (QF).
18 Then Came the Bust With the 1986 world oil market crash of 1986, SRAC prices fell to half their previous levels. Standard Offer 4 contract rates fell. Few SO 4 contracts let after Deregulation of electric power markets loomed large.
19 After the Bust Utilities provide cash incentives to buy back SO 4 contracts. Some plants went down, some curtailed operations. Plants that were smaller, less efficient or had poor access to fuel were closed. Plants that transitioned into year 11 sought out cheaper fuel sources. Attempt at electrical utility deregulation implemented.
20 California Experience Current Situation Approximately 28 plants operational. Produce almost 650 MW (enough power for about 500,000 homes). Consume around 10,000,000 GT/year: forest biomass agricultural biomass urban biomass Generate revenue based upon a variety of power purchase agreements non-purpa rates most on a fixed rate of around $.0645/kWh. Current pricing schedule terms out in June, 2011.
21 California Biomass Power plants 2004 MW net operating idle dismantled
22 CA Timber Harvest MMBF Public Private Total
23 Number of sawmills in CA
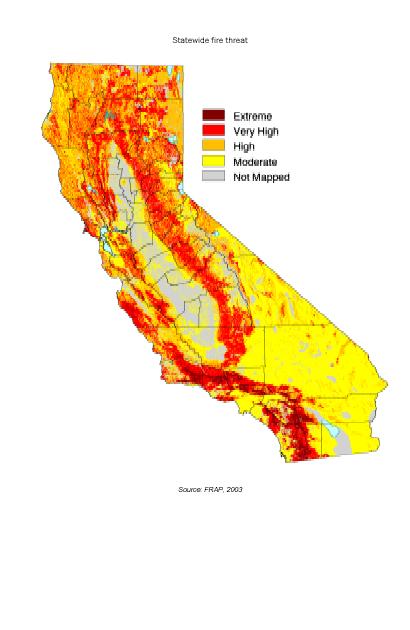
24 California Biomass Availability 1991 = 60+ million BDT/Year 2004 = 72+ million BDT/Year 2004 Analysis Results: 51% Urban 29% Agricultural 9% Chaparral 7% Forest 3% Forest products residuals Source: 1991 Biomass Resource Assessment Report for California, California Energy Commission, Dec Source: California Biomass Collaborative
25
26

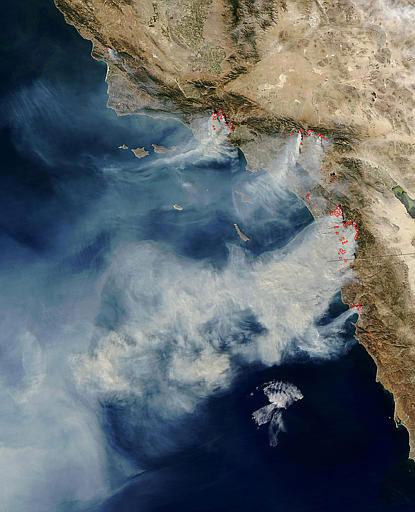
27 Cone Fire Unthinned Thinned
.")
28 Biomass Power in North America Current Industrial Technology Nearly 10,000 U.S. megawatts Almost all systems are combustion / steam turbine Most are grate stokers MW (avg. 20 MW). Heat rate 11,000-20,000 BTU/kWh. Installed cost $1700-$3500 per kw.
29 Biomass Facility Example 20 MW plant produces enough power for about 20,000 homes New plant construction cost = $40 to 45 million + Consumes about 160,000 BDT/yr (1BDT/MW/hour burn rate) Biomass transported up to 50 miles (maybe farther) Delivered Biomass valued at $15-50 per BDT Average electrical energy production cost ~ $ $0.09/kWh
30 Siting/Infrastructure- Part I Co-locate with existing commercial or industrial project Forest products manufacturing facility that has on site demand for heat and power Adjacent to power transmission/distribution system Typical project requires at least 8 acre site
31 Siting/Infrastructure - Part II Water readily available (10 + gpm minimum) Location incentives Enterprise zones Transportation system Highway Rail Ash/Waste water disposal Public concerns Fugitive emissions Noise Odor

32 Biomass Project Development Fatal Flaw Issues to Consider Fuel Supply Community Support Project Economics Appropriate Technology Siting/Infrastructure
33 Woody Biomass Supply Sources Timber harvest residuals Forest fuels treatment residuals Urban wood waste Forest products manufacturing residuals Agricultural byproducts
34 Fuel Supply Sustainable long term supply located within close proximity (25 to 50 mile radius) Economically available Environmentally available Meets quality specifications Available in quantities and from diverse sources that support project financing: Minimum 10 year supply, 70% under contract At least times facility usage (fuel supply coverage ratio)
35 Community Support Best to have grass roots support Poll key stakeholders: County Commissioners Tribal Councils Chamber of Commerce Conservation Community Local, State and Federal agency representatives Private sector resource managers, landowners
36 Project Economics Sustainable and economical fuel supply Fuel supply typically represents the highest variable cost for a biomass facility Existing incentives Production Tax Credits Business Energy Tax Credits Local incentives enterprise zone Markets for heat and power Market support justifies capital investment Return on investment Minimum ROI of 20%+
37 Potential Power/Heat Purchasers Regulated utility: Pacific Gas + Electric Southern California Edison San Diego Gas + Electric Municipal Utility District: Sacramento Municipal Utility District Forest products manufacturing facility Agricultural processing facility Community buildings Others
38 Electricity Prices Pacific Gas & Electric Short Run Avoided Cost January November Cents/kWh Date
39 Appropriate Technology Search for most appropriate technology considering project location and fuel supply Ability to convert local fuel supply into heat/power Must meet local permitting specifications Technology must be proven: Commercially available Operates efficiently on available fuel supply Operates cleanly on available fuel supply Appropriate for site and local resources
40 Project Development Steps Part I 1 - Conduct preliminary feasibility study (Fatal Flaw Analysis) 2 - Confirm community support 3 - Assess fuel resource availability 4 - Consider siting and infrastructure issues, including environmental permit review 5 - Complete due diligence Feasibility Study 6 - Secure developer and/or investment banker

41 Project Development Steps Part II 7 - Complete power purchase/thermal delivery agreement 8 - Enlist equity partners 9 - Secure financing 10 - Select EPC firm 11 - Engineer/construct project 12 - Generate renewable energy
42 Questions? Comments? Heckling Remarks? Tad Mason Managing Partner ext 112