AUTOMATION ZONE BUILDER
|
|
|
- Willa Phillips
- 5 years ago
- Views:
Transcription


1 AUTOMATION ZONE BUILDER


2 Energy Saving More than 1,000 JOB In JAPAN Come to Thailand


3 Contribution for Your Buildings We would like to propose Energy Saving Solutions to contribute your energy saving activities. 6After M&V 5Test & Commissioning Proposal 4Installation 3Before M&V 2Energy Saving Proposal 1Site Survey (Health Check)


4 3 steps of Energy Health Check activity Step 1 Step 2 Step 3 Preparation for energy data Information of Building Electricity Bill Equipment List Schematic Diagram Operation Time Interview with facility manager/engineer Outline of Building usage Record & Plan of Main renovation items Energy Saving Activity On-site survey (walk-through survey) Chiller Plant Electrical room AHU room Cooling Tower Existing System Survey The day before Energy Health Check On the day of Energy Health Check


5 The day before Energy Health Check Preparation Documents General Information of Building Electricity Bill of year 2011, 2012 and 2013 Energy and Fuel used of 2011, 2012 and 2013 Energy Report Building Equipment List Schematic Diagram of HVAC system Equipment schedule of HVAC & lighting Operation time of Equipments


6 On the day of Energy Health Check Interview Outline of Building Outline of Equipment Outline of Operation Outline for Each Building Usage Record & Plan of Main renovation items Energy saving activity How to operate Major Equipments


7 On the day of Energy Health Check Site Survey Chiller Plat Electrical room Generator room Cooling Tower Air Handling Unit Public Area Investigation &Driving situation of facilities Check Operation status. Existing System Survey


8 Energy Health Check Activity Indoor Temp 2014 Azbil Corporation All Rights Reserved.


9 Energy Health Check Activity 2014 Azbil Corporation All Rights Reserved.


10 Energy Health Check Activity 2014 Azbil Corporation All Rights Reserved.


11 Energy Health Check Activity 2014 Azbil Corporation All Rights Reserved.


12 Energy Health Check Activity 2014 Azbil Corporation All Rights Reserved.
![SGE [kg-co2/m2y] [t-co2/y] [M Baht/Y] CO2 emmissions [t-co2/y] CER [kg-co2/m2y] CO2 emissions [t-co2/y] Daytime Temp [deg] CO2 emission [t-co2/month] Daytime Temp [deg] Output Image 1.](/docs-images/86/94908306/images/13-3.jpg "Outline of Building 0 2. Evaluation of CO2 emission 0 3.")
13 SGE [kg-co2/m2y] [t-co2/y] [M Baht/Y] CO2 emmissions [t-co2/y] CER [kg-co2/m2y] CO2 emissions [t-co2/y] Daytime Temp [deg] CO2 emission [t-co2/month] Daytime Temp [deg] Output Image 1. Outline of Building 0 2. Evaluation of CO2 emission 0 3. Result of Energy Saving Audit 0 Outline of Building TSIC-ID Building Name Address Use Hospital the Operation Year of Starting 2539 AD 1996 Floor Above: 7F Below: 2F Using Area Total Area: 29,105m2 HVAC Area: 29,105m2 Non-HVAC Area: Carpark Area 3,952m2 Outline of equipment Receiving Voltage 24 kv Transformer Installation 2,000 kva Main type of A/C System Chiller+AHU/FCU Equipments with VSD Pumps AHUs Fans Main type of Lighting System Lighting type: Fluorescent Lump type: T8 Managent System BMS EMS Electricity Power Meters Income Feeder Maijor Equipments Outline of Operation Working Hour 24hour/day Working Day 365day/year Target of Room Temp 25 For Hospital Number of Out Patient per persons/day day: 1,100 Number of Beds 89 beds Energy consumption (Y2010) Unit Quantity Costs emissions CO2 emission CO2 emission Factor CO2 rate (Unit/Y) (Baht/Y) (kg-co2/unit) (t-co2/y) (kg-co2/m2y) Electricity kwh 10,403,000 35,588, ,406 - Heavy Oil MJ Diesel MJ 47,346 37, LPG MJ Other MJ Total ,625,537-5, Record of Main repaired item & other itmes relevant to enery use Main repair Y2010 The chiller (Trane) has been change. Record Others Hot water is made by the solar heater and electric heater Outpatients' reception time: 7:00~20:00 Weekday/Saturday Chiller operating time 7:00~17:00 (2 chillers) 17:00~7:00 (1 chiller) Existing VAV system is out of service due to out of order. To be Changed to FCU Exisiting ice heat storage system is out of service due to out of order. CO density sensors are installed in the parking lot but it is not used for fan intermittent operation(13hours operation) Trend of CO2 emission amount Trend for three years 6,000 5,000 4,000 3,000 2,000 1, Electricity Fuel Daytime Temp Electricity consumption is the major cause of CO2 emission. The amount of emission is increasing year by year. Comparison with other buildings SGE to Average Ranking Your Building % 21/31 Average of Other Buildings in Bangkok % - *Specific GHG Emission SGE [kg-co2/m2y] = Total CO2 emissions [kg-co2/y] Total Area [m2] < CO2 emmisions - Area > 40,000 30,000 20,000 10,000 Other Buildings Your Building , , , ,000 Using Area(m2) < SGE Ranking > Other Buildings Your Building Average of Other Buildings Monthly Data in Jan Feb Mar Apr May Jun Jul Aug Sep Oct Nov Dec < SGE > Your Average Building Energy consumption per unit is 86kg-CO2/m2Y the emission of the hospital is 15% larager than that of the other hospitals. If 15% of the electricity consumption can be reduced, 5,300,000Baht/Y can be saved. Effect of CO2 emission reduction per countermeasure Electricity Energy Saving Method Fuel reduction CO2 reduction CO2reduction rate reduction (kwh/y) (MJ/Y) (t-co2/y) (%) 47, % 1.1Change to high efficiency lightings(led) 1.2 Lighting 1.2_1Ilumination control (motion sensor) 0.0% control 1.2_2 Schedule control 0.0% 2.1_1 Group capacity control 0.0% 2.1 Heat source 2.1_2 Heat source OSS 0.0% optimazing control 2.1_3 Primary pump VWV control 174, % 2.2 Installation of high efficiency chillers 227, % 2.3 Cooling water optimizing operation control 334, % 2.4 Distribution pump VWV control 153, % 3.1 Outdoor air 3.1_1 Warming up control 3, % intake control of 3.1_2 CO2 dencity control 0.0% AHU 3.2 AHU with VAV control 110, % 3.3 Electricity saving operation control (intermittent control) 86, % 3.4 Moderation of temperature setpoint 71, % 3.5 Change to high efficiency PAC 0.0% 4 Ventilation fan 4_1 CO density control 206, % operation control 4_2 Schedule control 0.0% Total BEMS Project total 1,415, % 0 Modified equipment only(1.1, 2.2, 3.5) 275, % Return on Investment Electricity Investment Fuel reduction Total reduction ROI reduction (Baht) (Baht/Y) (Baht/Y) (Baht/Y) Year 28,170,000 4,812,910 4,812, BEMS project total Modified equipment only(1.1, 2.2, 3.5) 8,990, , , Before/after the Introduction of BEMS CO2 emission and fuel & lighting expenses present after BEMS reduction rate 4, % CO2 emission (t-co2/y) 5,410 fuel & lighting (Baht/Y) 35,625,537 30,812, % CO2 emission 6,000 5,000 4,000 3,000 2,000 1,000 0 present after BEMS Energy Cost present after BEMS Including ANALYSIS OF ENERGY USAGE MENU OF ENERGY SAVING OPTIONS SIMULATION OF ENERGY SAVING IMPACTS AND INITIAL COST BUDGET The Energy Health Check report will serve as a good reference for your preventive maintenance and energy saving activity!
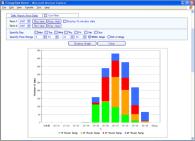
![SGE [kg-co2/m2y] CO2 emmissions [t-co2/y] CER [kg-co2/m2y] How to use the report Benchmark Analysis of Energy Intensity Comparison with other buildings SGE to Average Ranking Your Building 186 115%](/docs-images/86/94908306/images/14-0.jpg "21/31 Average of Other Buildings in Bangkok 162 100% - *Specific GHG Emission SGE [kg-co2/m2y] = Total CO2 emissions [kg-co2/y] Total Area [m2] Example Average-Your Bldg.")
14 SGE [kg-co2/m2y] CO2 emmissions [t-co2/y] CER [kg-co2/m2y] How to use the report Benchmark Analysis of Energy Intensity Comparison with other buildings SGE to Average Ranking Your Building % 21/31 Average of Other Buildings in Bangkok % - *Specific GHG Emission SGE [kg-co2/m2y] = Total CO2 emissions [kg-co2/y] Total Area [m2] Example Average-Your Bldg.=115% Energy Saving s Target: 15% ,000 30,000 20,000 10,000 0 < CO2 emmisions - Area > 0 100, , , ,000 Other Buildings Your Building Using Area(m2) Average of Other Buildings Other Buildings Your Building < SGE Ranking > Your Building < SGE > Average The benchmark analysis, which is comparing both the energy intensity of your building and the ones of other same type of buildings in Thailand, will be a one of your guideline for your energy saving activities and will help you to set the energy saving's target


15 Proposal for Energy Saving 2014 Azbil Corporation All Rights Reserved.

16 Building Energy Management Project (BEMS) 2007 Yamatake Corporation All Rights Reserved.


17

 Infilex-GC Sensors Transmitters")

18 For Amarin Plaza Client PC Energy Data Server Management Integration Server System Core Server Chiller Plant Depart LAN (BACnet TCP/IP) Infilex-GC Sensors Transmitters Chiller Plant Tower Energy Saving Application Inverter Primary Pump VWV Control Condensing Pump VWV Control

19 SP ΔP VSD Output Valve Output For Amarin Plaza Primary Pump VWV Control AHU VWV: Variable Water Volume VSD Bypass Valve FCU VSD Min. Speed SP ΔP SP ΔP at End of Circuit Primary Pump Power Demand Flow Rate Only supply demands No Energy Loss!
20 VSD Output For Amarin Plaza Condensing Pump VWV Control 80% Cooling Load VSD Min. Speed SP ΔT VSD VWV: Variable Water Volume 80% Condensing Load 80% Cooling Load Condensing Pump Control Before After
21 Measurement & Verification(M&V) and Energy Performance Contract (EPC) Energy Saving Solution by Building Energy Management System Azbil (Thailand) Co., Ltd.

22 Work Schedule

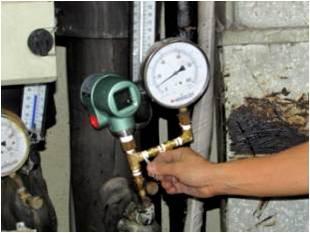
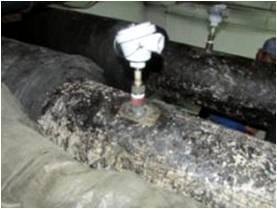
 & Temperature Recorder Ultrasonic Flow Meter (Clamp on")
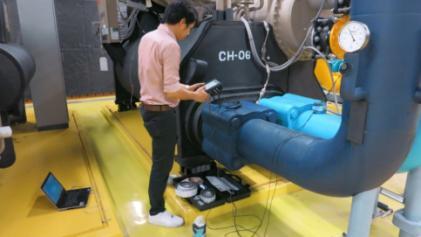
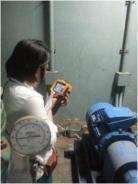
23 Measurement Methodology Measurement of Chiller Load (Chilled Water Side) Purpose : Flow rate, supply temperature and return temperature will be measured to grasp the chiller load of the chiller plant system. Location of implementation : Main pipeline of supply and return chilled water Period of Measurement : 24 hrs Interval : 1 minute Equipments : Ultrasonic Flow Meter (Clamp on type) & Temperature Recorder Ultrasonic Flow Meter (Clamp on type) Temperature Recorder
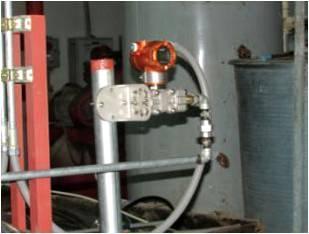
 Power")
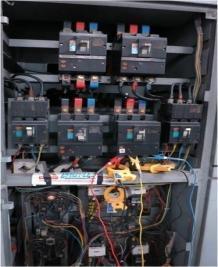
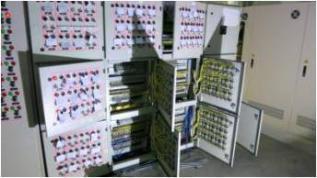
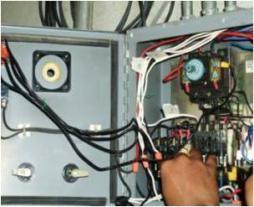
24 Measurement Methodology Measurement of Power Consumption Purpose : Power consumption will be measured to confirm the actual power of each pump. Location of implementation : Power supply circuit in MCC Panel Period of Measurement : 24 hrs Interval : 1 minute Equipments : Power Meter (Clamp on type) Power Meter Image of Installation
25 Schematic Diagram
26 Schematic Diagram


27 Measurement & Verification(M&V)


28 Measurement & Verification(M&V)


29 Measurement & Verification(M&V)

30 Measurement & Verification(M&V) 2014 Azbil Corporation All Rights Reserved.


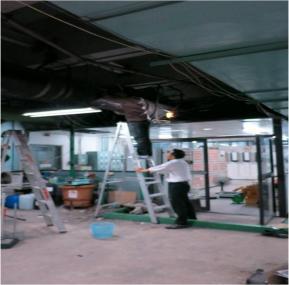
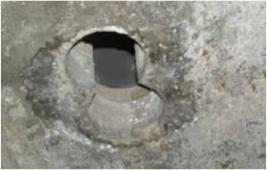
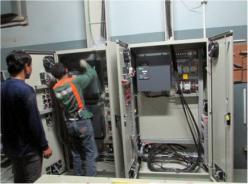
31 Photo of working activities Location of Implementation : Chiller water supply of each chiller


32 Photo of working activities


33 Photo of working activities

34 EPC & MV Confirm runnning time from the Client. These data will be Definite value with customer's agreement. Confirm operation days from the Client. These data will be Definite value with customer's agreement.

35 EPC & MV Input Information according to Electricity Bills from MEA. It would be OK for only 1 year, if the client doesn't have old Bills.
36 Input Information according to their as built drawing at the site. EPC & MV
 - No VSD => 1 Daymeasurement - VSD => 1 Day")
37 EPC & MV Pls measure by HIOKI as temporary measurement.(spot measurement) - No VSD => 1 Daymeasurement - VSD => 1 Day measrement at least

38 Agreed & fixed value by EPC Calculation methodology Agreed & fixed value by EPC


39 Energy Performance Contract 2014 Azbil Corporation All Rights Reserved.


40 Energy Performance Contract
41 Installation Work Energy Saving Solution by Building Energy Management System Azbil (Thailand) Co., Ltd.


42 Installation


43 Installation 2014 Azbil Corporation All Rights Reserved.

44 Installation 2014 Azbil Corporation All Rights Reserved.


45 Installation 2014 Azbil Corporation All Rights Reserved.


46 Installation 2014 Azbil Corporation All Rights Reserved.


47 Test & Commissioning 2014 Azbil Corporation All Rights Reserved.


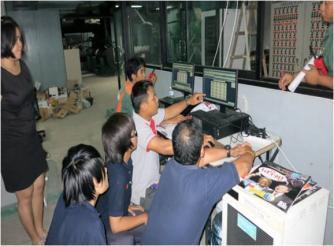

48 Training 2014 Azbil Corporation All Rights Reserved.


49 Graphic 2014 Azbil Corporation All Rights Reserved.


50 Control Room Before After 2014 Azbil Corporation All Rights Reserved.


51 Amarin Plaza : Control Room 2014 Azbil Corporation All Rights Reserved.


52 Monthly report

53 For Amarin Plaza Type of ESCO : Guaranteed Savings Contract Period : 3 years Saving Guarantee : 450,000 kwh/year Saving Cost : 1,620,000 THB/year Saved Energy 663,483 kwh/year (as of Febaury Y2015)


54

55