Watershed Plan Implementation in Oklahoma: What We Do and What We ve Learned
|
|
|
- Nathaniel Sharp
- 5 years ago
- Views:
Transcription

")
 Assemble Resources (Element D) Implement Practices (Elements B, C, F)")
1 Watershed Plan Implementation in Oklahoma: What We Do and What We ve Learned Shanon Phillips Director, Water Quality Division Oklahoma Conservation Commission What is the purpose of a Watershed Plan? Solving Water Quality Problems by: Prioritizing Areas of Focus (Elements B & C) Identifying Partners and Assemble Resources (Element D) Identifying Causes and Sources (Element A and H) Assemble Resources (Element D) Implement Practices (Elements B, C, F) Education (Element E) Evaluate Your Success (Element G & I) Remain Flexible 1
 List) 39 155 44 132 112 60 44 53 112 77 119 127 151 151 119 46 139 53 84 112 88 112 119 112 139 119 151 10 53 127 77 71 41 3 112 147 151 127 84 77 15 33 12 46 N")
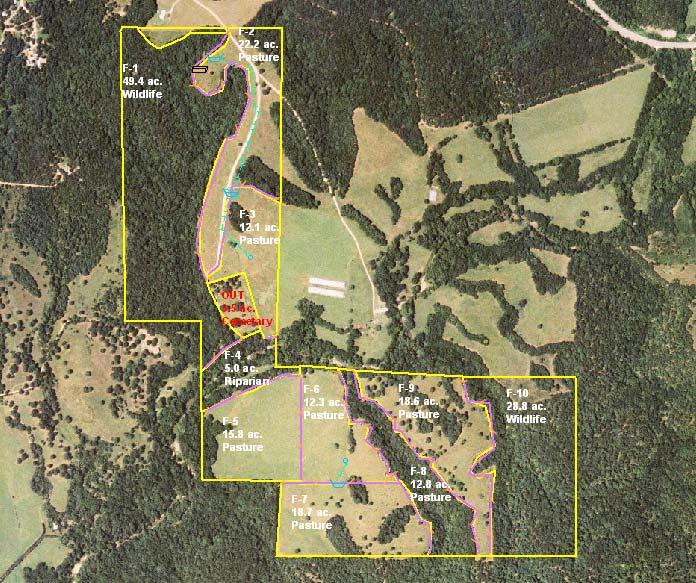
2 1) Prioritize Areas of Focus OK Focuses on Priority Watersheds Prioritized on: % impaired Causes and sources of impairments Public water supply Endangered species Etc Draft UWA (based on (d) List) N W E S Lakes UWA Priority Ranking
")
App.")


3 2) Identify Problem(s) and Sources 303(d)App. C Why are they impaired?- ID Problems and Sources 3

 Attributable Risk estimates the percent of improvement (if it were possible to completely address a stressor) ID Sources Identify the most likely activities")
4 Using R Software to define causes (stressors) linked to poor stream condition R is Open Source (Free) Software scripts provided by EPA Extent Estimates give the percent of stream length in Good, Fair, or Poor condition Relative Risk assesses the relative importance of multiple stressors (Which stressors should be the major focus for remediation, restoration or protection?) Attributable Risk estimates the percent of improvement (if it were possible to completely address a stressor) ID Sources Identify the most likely activities causing the problem Select AREAS of your watershed most likely to be contributing Use a watershed model Windshield/foot surveys 4


5 3) Identify and Convince Partners Oklahoma Program Partners Work through Conservation Districts and with local NRCS Hire Local Project Staff Assembled a Local Watershed Advisory Group Recommends Practices and Cost-Share Rates to be Offered 5

.")


6 4. Draft the Watershed Plan 5). Implement Practices 6


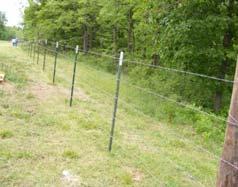
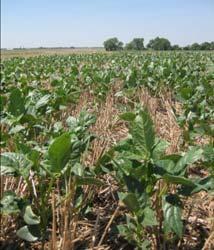
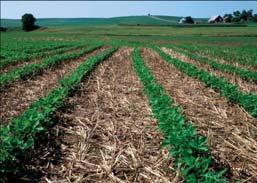
7 Implement Practices- Be Flexible Typically implement NRCS standard practices However, sometimes choose NEW practices or alter existing practices to meet needs in your watershed. Choose Practices- Be Flexible 7


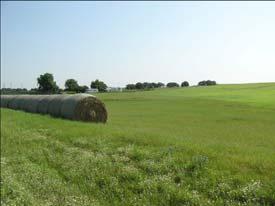
8 Use Cost-Share Rates to Help Prioritize Higher rates (90% or higher) for practices that should have the most impact Lower rates for things producers want anyway (cross fencing, etc.) 6. Education 8
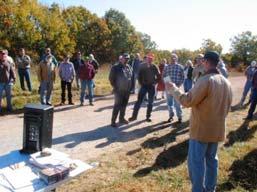
9 Demonstration Farm 7) Evaluate Your Success 9


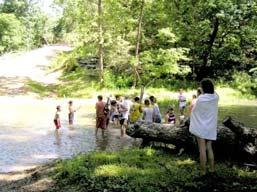
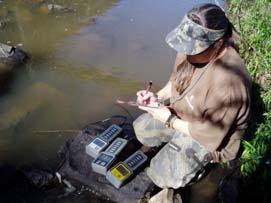
10 Monitor to Show Success Photodocumentation: Take Before and After photographs to document improvement in a site. Monitor to Show Success Evaluate Water Quality 10

11 EPA method 841-F developed by J. Spooner and J.C. Clausen from North Carolina State University and University of Connecticut. Paired Watershed Monitoring Demonstrates that change in WQ are the result of management changes in the watershed rather than due to changes in climate Collects ENOUGH data to be scientifically valid 11


 37% reduction in TP load in Spavinaw")

12 Implement Multi-Faceted Monitoring Program Change in Total Phosphorus Load Paired watershed analysis allows estimation of the effect of BMPs while controlling for environmental variability Results include: 24.5% reduction in TP load in Honey Creek (1.5 years of data) 30% reduction in TP load in Flint Creek of the illinois River (2 years post-impl. data) 37% reduction in TP load in Spavinaw and Beaty Creeks (8 years post-impl. data) Every time we ve used this method, we ve been able to detect positive water quality impacts from our BMPs 12

13 8) Remain Flexible Oklahoma Successes- WQ In EPA s Grants Reporting and Tracking System Summary Report, OK was in the top 5 states in the nation at estimated nitrogen and phosphorus load reductions. 6,000,000 FY 11 CWA 319 Program Load Reductions Annual Load Reduction Estimate 5,000,000 4,000,000 3,000,000 2,000,000 1,000,000 0 AK AL AR AZ CA CO CT DC DE FL GA HI IA ID IL IN KS KY LA MA MD ME MI MN MO MS MT NC ND NE NH NJ NM NV NY OH OK PA RI SC SD TN TX UT VA VT WA WI WV WY Axis Title Nitrogen (lbs/yr) Phosphorus (lbs/yr) Sediment (tons/yr) 13


14 Oklahoma Successes - WQ Only three states in the country have more nonpoint source success stories ( Oklahoma Successes- cont. New and continued sources of funding- EPA funding USDA CREP programs Private funding from rural electric cooperatives, Ag groups, etc. EPA CW SRF funds State funding for monitoring network New Partners- Tribes State agencies Etc. 14


15 11/1/2013 Lessons Learned ALWAYS remember that WQ improvement is the ultimate goal, but there is more than one way to get there and you might not have the only map Set REALISTIC milestones Successful solutions are not Setit-and-Forget-it Holler about your successes because people will have already heard about your failures # 1 Lesson Learned Don t Scrimp on Your Water Quality Monitoring Budget 15

16 Questions???? Shanon Phillips- Oklahoma Conservation Commission Water Quality Division Director