Measuring Carbon Footprint of Your Building Supply Chain
|
|
|
- Dennis Robertson
- 5 years ago
- Views:
Transcription


1 Measuring Carbon Footprint of Your Building Supply Chain Dr. S. Thomas Ng Dr. James M.W. Wong Department of Civil Engineering The University of Hong Kong

2 2 Contents Building supply chain and carbon footprint Carbon footprint of typical building materials Ways to measuring the carbon footprint A glimpse of an on-going research project at HKU

3 3 Why Bother? The Kyoto Protocol aimed at fighting global warming by reducing greenhouse gases Hong Kong s Target to reduce carbon intensity by 50-60% by 2020 compared with 2005 levels Building sector contributed to 56% of final energy consumption in Hong Kong in 2008 (EMSD, 2010)

4 4 Current Perception a zero energy house is one equipped with photovoltaic panels and wind turbines; insulated with sheep s wool; and without using PVC reducing CO 2 emissions at operation stage would suffice as most of the sustainability regulations and assessment models focus on this only just how much carbon is generated in assembling and disposing building components
 In domestic buildings, embodied energy")

5 5 Reality Embodied energy of a building may constitute 15% of its lifetime energy consumption (Harris, 1999) In domestic buildings, embodied energy may be equivalent to 10 times annual operational energy use For complex commercial buildings, the ratio can be as high as 30:1 (Rawlinson and Weight, 2007)
6 6 Make the best decisions in the early project stage Source: Fieldson et al (2009)
7 7 Embodied Carbon The embodied carbon of a building material can be taken as the total carbon released over its life cycle This would normally include (at least) extraction, manufacturing and transportation Ideally the boundaries would be set from the extraction of raw materials until the end of the products lifetime (including energy from manufacturing, transport, energy to manufacture capital equipment, heating & lighting of factory, maintenance, disposal, etc.) known as Cradle-to-Grave Inventory of Carbon & Energy (ICE, 2008)
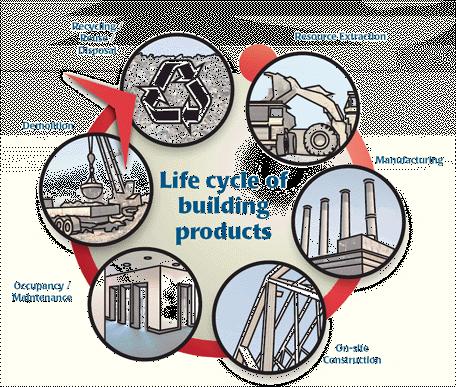


8 8 Cradle-to-Grave Concept Source: Government of British Columbia,
9 Embodied Carbon of Common Building Materials Materials Aluminium Steel (virgin) PVC 2.41 Glass 0.85 Cement Plywood 0.81 Lime 0.74 Tile 0.59 Bricks 0.22 Embodied Carbon (kgco2/kg) (1.69 for recycled aluminium) 2.75 (0.43 for recycled steel) 0.83 (0.42 for cement with 50% fly ash replacement) Concrete 0.13 cement: sand: aggregate 1:2:4 (0.209 for high strength concrete; for prefabricated concrete) Plaster 0.12 Aggregates Source: Inventory of Carbon & Energy (ICE, 2008) 9
 Engineering")


10 10 Examples of Green Materials Green block wall system Can be recycled after demolition, even just by heat and pressure after buried underground Source and Photo courtesy: Hong Kong Green Council and CaSO (HK) Engineering Green Concrete Reduce cement content reduce heat release during curing, better concrete performance and less carbon emission from cement production Use recycled industrial by-products such as silica fume/flyash to replace cement reduce cement production yet achieving high strength High performance green concrete reduce the use of concrete and therefore related carbon emission Photo courtesy: Technology Review ( 5300/)
11 11 Life Cycle Assessment (LCA) Carbon footprint of products or services needs to be calculated according to an agreed standard Fieldson et al (2009) The task of calculating carbon footprints can be approached methodologically from two different perspectives: Top-down based on Environmental Input-Output (EIO) analysis using national or organisational financial statistics Bottom-up based on Process Analysis (PA) in Life Cycle Analysis
")

 of")
12 12 Top-Down Approach Many countries produce inter-industry specific datasets (i.e. I/O table) Such tables can be converted from monetary (input) values to energy basis The sum of direct energies for various sectors then adds up to the embodied energy / carbon in specific outputs (products) of that industry
13 13 Bottom-Up Approach: Relevant Standards ISO standards ISO LCA standards (14000 and 14044) aim to establish a global industry wide set of protocols to ensure that LCA studies are conducted in a comprehensive, consistent and reproducible manner ISO Environmental labels and declarations offers critical aspects on the communication of LCA results ISO 14040:2006 describes the principles and framework for life cycle assessment (LCA) ISO (1-3) Greenhouse Gases specifies guidance for quantification, monitoring reporting & verification of GHG at organisational and project levels ISO 14065:2007 specifies accreditation requirements for organisations that validate or verify resulting GHG emission assertions or claims. ISO is a developing standard designed to be a two-part international guidance on quantification and communication of carbon footprints of products.
14 14 Bottom-Up Approach: ISO Carbon footprint of building supply chain can be measured based on ISO 14040: Identifying construction materials to be labelled (e.g. reinforcement bar) Inventory assessment Life Cycle Inventory (LCI) data from relevant databases with localization adjustment (e.g. replacement of fuel mix, impacts of transportation) Assessing life cycle carbon emission standard of studied construction materials Interpretation and application benchmarking

15 15 Bottom-Up Approach: PAS 2050 PAS 2050 Developed by the British Standard Institute and co-sponsored by the Carbon Trust and Defra PAS 2050 is a voluntary standard that has been designed to help organisations assess, manage, and reduce carbon footprints The most applicable standard as it aims to foster a greater understanding of the GHG implications of purchasing decisions


16 16 Bottom-Up Approach Source: PAS 2050: 2008

17 17 Life Cycle Emission Analysis Three Phases

18 18 Envisaged Carbon Label for Construction Materals

19 19 Is a Carbon Labelling Scheme for the Building Sector Needed? Importance of a universally recognised measurement unit Promote selection of environmentally responsible options Encourage manufacturers to improve relentlessly Putting Hong Kong at the forefront of sustainable development as well as accreditation service and carbon auditing Achieving the Chief Executive s policy direction and tie in with the mission of the Green Building Council
20 20 The Way Forward New buildings vs. existing properties In HK almost 90% of various end use of electricity is attributed to our buildings (EPD, 2010) In 2008 alone, the total energy consumed by the building sector was 36,845 million kwh or 24 million tonnes of CO2e (EMSD, 2010) Strengthen existing environmental impact assessment methods i.e. BEAM Plus, LEED, BREEAM, etc. Set suitable policies to maximise the emission reduction opportunities in the building sector 3 envelop system Carbon trading

21 21 END OF PRESENTATION Thank you for your attention! Dr. S. Thomas Ng Associate Professor Department of Civil Engineering The University of Hong Kong