Reducing the Carbon Footprint of Concrete Christie Gamble CarbonCure Technologies
|
|
|
- Walter Nash
- 5 years ago
- Views:
Transcription


1 Reducing the Carbon Footprint of Concrete Christie Gamble CarbonCure Technologies AIA Provider Number: Course Number: CCT

2 Copyright Materials This presentation is protected by US and International Copyright laws. Reproduction, distribution, display and use of the presentation without written permission of the speaker is prohibited. TM CarbonCure
3 3

4 Did you know? Concrete is the most widely used construction material in the world and part of almost every structure in our modern society. 4


5 Concrete forms 5

6 Architects, engineers and developers choose concrete because it s Strong Thermalinsulating Durable Versatile Resilient Beautiful Sound-reducing Proven 6

7 Composition of concrete 6% Air 16% Water Cement is a key ingredient that acts like the glue in concrete 26% Sand 41% Gravel 11% Cement 7

8 Cement production creates 5% of the world s CO 2 greenhouse gas emissions 8
9 Carbon cons BIOLOGICAL SYSTEMS IMPACT WEATHER IMPACT CO 2 accounts for 84% of global greenhouse gases. Global cement production was 4.3 billion tonnes in 2014, which released over 2.5 billion tonnes of CO 2. SOCIAL IMPACT WATER IMPACT Source: Cembureau: European Cement Association


10 The chemistry of concrete CO 2 heat (+) calcination reaction Limestone CaCO 3 Cement Concrete Add aggregate, water & chemicals 10
 Raw materials including limestone (CaCO 3 ) are mixed in a kiln and heated to")
11 Cement production and CO 2 Cement kiln Other Materials CaCO 3 RAW MATERIALS CaCO o F COMBUSTION (fuel) Raw materials including limestone (CaCO 3 ) are mixed in a kiln and heated to 2650 o F. 11
12 Cement production and CO 2 Cement kiln CALCINATION CO 2 Other Materials CaCO 3 CaCO 3 CO 2 RAW MATERIALS 2650 o F CaO Clinker COMBUSTION (fuel) In a process known as calcination, the CaCO 3 molecule breaks into two components: a CO 2 gas molecule and clinker the precursor to cement. 12
 The")

13 Cement production and CO 2 Cement kiln 1,000 kg cement = ~ 840 kg CO 2 CALCINATION Other Materials CaCO 3 CaCO 3 CO 2 CO 2 Other Materials RAW MATERIALS 1450 o C CaO Clinker Clinker CEMENT COMBUSTION (fuel) The clinker is mixed with other ingredients to make cement. For every 1,000 kg of cement produced, ~ 840 kg of CO 2 is released. Source: WBCSD 2011 Cement Sustainability Initiative report for GNR (Getting Numbers Right) 13


14 COMBUSTION accounts for 40% of CO 2 emissions This can be managed through plant optimization & energy efficiency 14
15 CALCINATION accounts for 60% of CO 2 emissions This cannot be managed because it comes from the chemical reaction 15


16 Cement demand is growing 6 Gt Cement Other developing countries India China Growth as high as 600% from 1990 through 2050 OECD, industrial nations Year Source: WWF/Lafarge 16
 Univ.")
17 Concrete versus other materials Concrete actually has lower CO 2 emissions and embodied energy for every kg produced Source: Hammond (2008) Univ. of Bath 17

18 Concrete abundance Concrete has a smaller CO 2 impact per volume than other materials, but its abundance means that it creates more CO 2 overall than any other material Concrete 83.4% Wood 8.3% Steel 3.8% Asphalt 8.3% Glass 0.4% Aluminum 0.1% 18

19 Concrete s carbon footprint is a significant issue... Can concrete absorb CO2 Environmental stewardship programs are encouraging architects to reduce both the operational and embedded footprint of buildings 19
20 Life Cycle Analysis energy impact Life cycle of average building) 50 Year Total: 1511 MWh 1% 3% An average building uses 1511 MWh of energy throughout its 50 year lifetime Demolition Maintenance Operations Construction Materials 83% 1% 12% 83% of that energy comes from its operations Source: K. Adelberth, Lund University, Lafarge and intuser.net 20
21 Life Cycle Analysis energy impact A low energy building uses only 542 MWh of energy over its lifetime Architects have reduced the operational energy usage of buildings by incorporating energy efficient technologies into their designs Life cycle of low energy building Demolition Maintenance Operations Construction Materials 50 Year Total: 542 MWh 3% 8% 53% 3% 33% Source: K. Adelberth, Lund University, Lafarge and intuser.net 21
22 Life Cycle Analysis energy impact 50 Year Total: 1511 MWh 1% 3% Now the embedded energy from materials has become a proportionally larger contributor to a buildings life cycle This means it s time to tackle embedded energy 83% Demoli7on Maintenance Opera7ons Construc7on 1% Materials 12% 3% 8% 53% 3% 33% 50 Year Total: 542 MWh Source: K. Adelberth, Lund University, Lafarge and intuser.net 22


23 Environmental stewardship programs 495 known product labels around health & environment 23

24 A challenge for AEC firms to specify products that reduce the embodied carbon footprint of building materials 24

25 Materials imperatives IMPERATIVE 12: Embodied carbon footprint The project must account for the total footprint of embodied carbon from its construction through a one-time carbon offset tied to the project boundary. Source: Living Building Challenge,


26 LEED v4 It s all about being holistic 26
27 Materials & Resources LEED 2009 Pre- requisite Storage & collec7on of recyclables Credits: Building re- use: walls, floors, roof interior non- structure Construc7on waste management Materials reuse Recycled content Regional materials Rapidly renewable materials Cer7fied wood LEED v4 Pre- requisites: Storage & collec7on of recyclables Construc7on & demoli7on waste management planning Credits: Building produc7on disclosure & op7miza7on: EPDs Sourcing of raw materials Material ingredients (HPDs) Building life- cycle impact reduc7on Construc7on & demoli7on waste management + Regional materials (100 miles) mul7plier 27

28 LEED v4 materials and resources Carbon reducing credits Building Life Cycle Impact Reduction - Conduct a Life Cycle Analysis to demonstrate 10% reduction in 3 impact categories (e.g. CO 2 emissions) compared to reference building = 3 points Building Product Disclosure & Optimization - Environmental Product Declarations: 20 products with EPDs = 1 point Source: US Green Building Council,


29 Environmental Product Declarations: a nutrition label for your products CO 2 Step 1: Determine the product s recipe Step 2: Conduct a Life Cycle Assessment on all the ingredients Step 3: Add up all of the impacts and report the final numbers on the EPD 29


30 Creates a benchmark for comparison to product specific EPDs May be used to validate Whole Building Life Cycle Impact reduction 30

31 The global picture So what s the concrete industry going to do about reducing carbon emissions? 31


32 IEA Blue Map scenario The IEA BLUE Map scenario sets the goal of cutting global energy-related CO 2 emissions in half by 2050 The IEA s Cement Technology Roadmap 2009 is a series of recommendations for industry to reduce carbon emissions from cement production 32

 57 29 14 2007 2050")

33 The Blue Map scenarios for global carbon reduction Total projected global CO 2 emissions according to IEA (in billion of tons of CO 2 ) Baseline 2050 Blue Map Target Business as usual Limit temperature increase to max +3 C (5 F) 33
34 Cement industry s targets to reduce carbon emissions Cement Sustainability Initiative (CSI) and IEA partnered to establish targets for the cement industry (in billion of tons of CO 2 ) 1.55 (- 23%) Baseline 2050 Blue Map Target Business as usual Cement industry target 34


35 Cement technology roadmap Bt of CO 2 Target But how?? 35

36 Carbon capture and storage Currently 16 CCS plants in the world Only plant in North America is expected to store 26 million tons CO 2 PROCESS 1. CO 2 captured from large industrial facility 2. CO 2 transported by pipeline to minimum 1 km depth underground 3. CO 2 injected into a suitable rock formation for permanent storage 36

37 Emerging technologies Can concrete absorb CO2 How do we move beyond carbon capture and storage? What if we could actually use carbon to make better concrete products? 37


38 CO 2 sequestering process CO 2 CO 2 sequestra7on refers to the process of capturing and storing CO 2. Using new approaches, CO 2 can actually be stored in concrete, a[er becoming chemically converted into stone, making stronger concrete. 38


39 Waste CO 2 is sourced from large final emitters 39


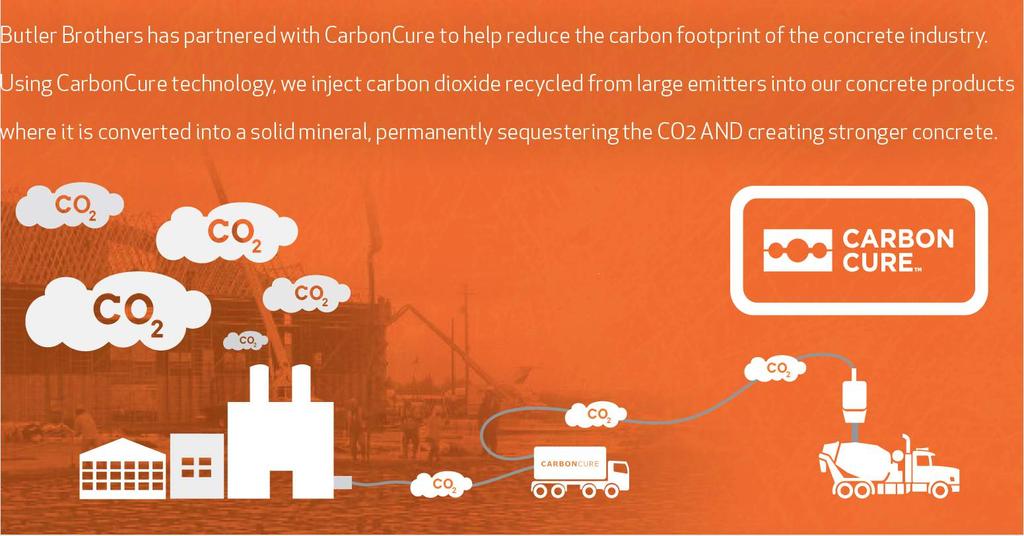
40 How it works Gas supply à CO 2 is collected from the smokestacks of large polluters à CO 2 is purified & delivered to the concrete plant à CO 2 is stored in liquid state in pressured tanks Daily use à CO 2 is injected into the mixer à Process is controlled by the operation system Material effects à CO 2 sequestration à Ready mixed: à enhanced strength à mix optimization 40 40
41 Converting CO 2 gas to a solid mineral CO 2 Heat (+) calcination reaction CaCO 3 Limestone CaO Cement Concrete Add aggregate, water & chemicals 41


 reaction CaO")


42 Converting CO 2 gas to a solid mineral CO 2 Reverse calcination reaction CaCO 3 Limestone Heat (+) calcination reaction CaO Cement CaCO 3 Bound within concrete CO 2 permanently converted to mineral within concrete Add aggregate, water & chemicals 42

 research on carbona7on kine7cs")
43 Early-stage carbonation effects on concrete Carbonate Reaction product microstructure Cement grain Calcium carbonate particles Average compressive strength improvement (before mix optimization) = 10% at 28 days Greg Dipple (UBC) research on carbona7on kine7cs 43 43
 4000 3000 2000 1000 0 100% 87% 100% 100% 100% Control Mix Reference Mix (reduced cement) 7 DAY 7d 2828d DAY 89% Control Mix CO2 Treated Mix (reduced cement) Control Mix")
44 Indication: Mix optimization CO 2 sequestration technology enables concrete producers to reach strength requirements with reduced cement content 5000 Field data from commercial use Average Compressive Strength (psi) % 87% 100% 100% 100% Control Mix Reference Mix (reduced cement) 7 DAY 7d 2828d DAY 89% Control Mix CO2 Treated Mix (reduced cement) Control Mix with 7% cement reduc7on Control Mix with 7% cement reduc7on + CO 2 44

 research on")
45 Early-stage carbonation effects on concrete Carbonate Reaction product microstructure No measurable effect on: Workability/slump Freeze-thaw ph Density Durability Air content Color Texture Greg Dipple (UBC) research on carbona7on kine7cs 45 45

46 How much CO 2 can be saved? 1 cubic meter of concrete = 15 kg CO 2 reduced 10,000 meter building = 150,000 kg CO 2 saved Major Sports Stadium: 200,000 meters could save 3,000 tonnes CO 2! A medium-rise building saves as much CO 2 as an acre of trees over 100 years 46

47 Reducing CO 2 across the continent 47


48 Case Study: Ambassatours Garage Halifax, Nova Scotia 1,000 cubic metres concrete made with CO 2 48

49 Case Study: MGM National Harbor 195,000 CMU 3,150 lbs CO 2 In coordina7on with MGM Resorts Interna7onal, SmithGroupJJR specified Ernest Maier with CarbonCure concrete masonry for the MGM Na7onal Harbor because the product s reduced carbon footprint aligned with the project s sustainability objec7ves. - Russell Perry, Principal SmithGroupJJR 49


50 Creative marketing opportunities Hullmark Centre, Toronto 50


51 Semi-finalist 51
52 Building with CarbonCure and Butler Brothers concrete means Every cubic metre of concrete saves about 15 kg CO 2 A medium-rise building saves as much CO 2 as an acre of trees over 100 years Who knew that building with concrete could be like planting trees? cgamble@carboncure.com 52