Integrating State Data & the National Oil and Gas Emissions Inventory Tool: The Oklahoma Experience
|
|
|
- Derek Wilkerson
- 5 years ago
- Views:
Transcription

1 International Emissions Inventory Conference Baltimore, Maryland August 2017 Integrating State Data & the National Oil and Gas Emissions Inventory Tool: The Oklahoma Experience Carrie Schroeder Emission Inventory Manager Air Quality Division, Oklahoma DEQ
2 Acknowledgments Support from OKDEQ, including the hard work of the following staff: Mark Gibbs, Louise Esjornson, Tom Richardson, Lindsay Ross, Shelby Willeby, Carrie Schroeder, Cecelia Kleman, Cooper Garbe, Justin Milton, Jay Laughlin, Shannon Hill, Hanna Bentley Help from ERG and Ramboll-Environ: Regi Oommen, Mike Pring John Grant, Amnon Bar-Ilan Assistance from EPA: Jennifer Snyder
3 Oklahoma Oil & Gas NEI Submission History Wellhead Midstream Major Point Sources Before 2008 Not Inventoried Minor Facilities Not Reported Type A & B Actuals 2008 NEI 2011 NEI 2014 NEI CENRAP Study Aggregated Midstream Emissions Type A & B Actuals Oil & Gas Tool Point Source Midstream Emissions Type A & B Potential Oil & Gas Tool + Aggregated Permitted Wells Point Source Midstream Emissions Type A & B Potential 3
4 4

5 Oil and Gas Tool + Aggregated Permitted Wells Point Source Midstream Emissions Type A & B Potential Point Sources 5


6 Oklahoma Area Source Oil & Gas Production Emissions 2014 O&G Production Tool Oklahoma Changes Point Source Inventories from Permitted Wellheads 2014 NEI Area Oil and Gas Submission to EIS 6
7 Oklahoma Modifications: What is Different? OKDEQ Gas Composition: We used gas composition data for the 15 counties where we had sufficiently representative data Pneumatic Devices: We incorporated the results of an Oklahoma Independent Petroleum Association (OIPA) study on pneumatic devices performed in Oklahoma (normal operations + malfunctions) Wellhead Point Source Inventory Data: We incorporated point source inventory data from over 4,000 oil and gas wellheads into our area source submission This number of wells and their associated activity was removed from the Tool 7
8 Area Oil & Gas Emissions Estimation Tool Goal: To capture the best estimate of criteria pollutant and HAP emissions from the Production oil and gas sector across the state of Oklahoma Involved many runs of the tool, and manipulation of the staging tables Main objective: prioritize getting point source emissions into the final staging table over perfecting the point to nonpoint crosswalk (TONS matter more than SCCs) EPA/ERG performed HAP augmentation to better characterize HAP emissions from OK point (and nonpoint) sources 8
9 Overview of Our Approach Tool Scenario Runs: Running the O&G tool with different source categories, basin factors, speciation profiles, etc. Procedures: Adding emissions from the different scenario runs, and from the OKDEQ point emission inventory to the final staging tables Analysis: Examine VOC & NOx emission totals and the differences between permitted wells and unpermitted wells 9

10 Tool Scenario Runs 10
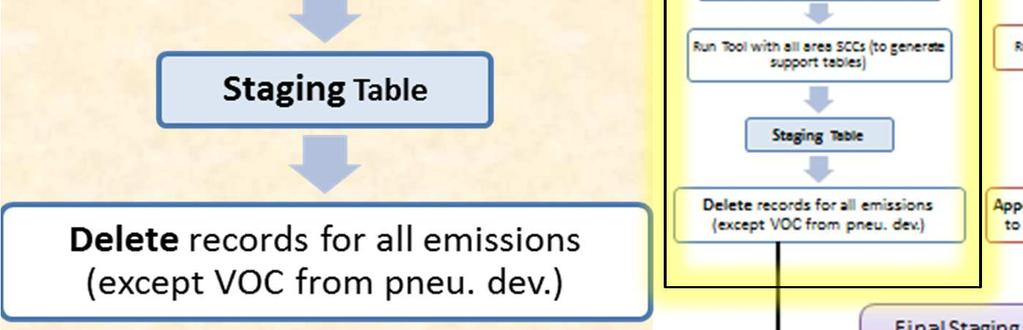
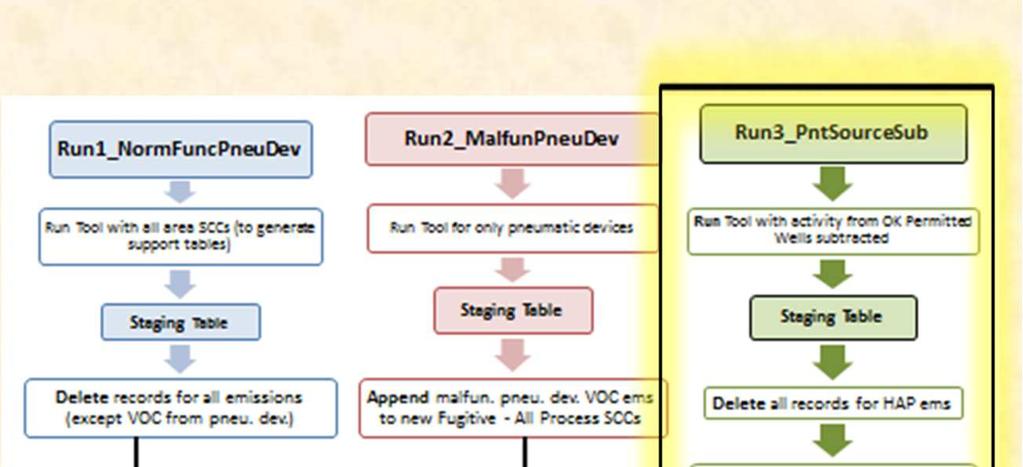
11 Run1_NormFuncPneuDev Run2_MalfunPneuDev Run3_PntSourceSub Run Tool with all area SCCs (to generate support tables) Run Tool for only pneumatic devices Run Tool with activity from OK Permitted Wells subtracted Staging Table Staging Table Staging Table Delete records for all emissions (except VOC from pneu. dev.) Append malfun. pneu. dev. VOC ems to new Fugitive - All Process SCCs Delete all records for HAP ems Final Staging Table Aggregate criteria Fugitive component SCC ems. Append into new Fugitive - All Process SCCs Delete all ems records for Fugitive component SCCs OKDEQ Emission Inventory Filter out ems from facilities already reported as point sources Aggregate point ems for related point SCCs Update aggregated Point ems to Area SCCs using Point to Nonpoint Crosswalk Append all records for criteria ems (except for Fugitives); Update Fugitive VOC emissions 11


12 Run1_NormFuncPneuDev STEP 1: Produce VOC emissions from normally-functioning pneumatic devices
13 Run1_NormFuncPneuDev Run of the tool that generates emissions from normally functioning pneumatic devices Includes: OKDEQ local gas composition data (speciation profiles for pneumatic devices) Pneumatic device basin factor data for normally functioning pneumatic devices (OIPA, 2014) Running all area SCCs to generate support tables; only emissions from normally functioning pneumatics are kept 13
14 Run1_NormFuncPneuDev BASIN FACTOR - DATA_CATEGORY CURRENT_VALUE CURRENT_REFERENCE Number of No Bleed devices (COUNT) OIPA_STUDY_2014 Bleed rate, No Bleed devices (SCF/HR/DEVICE) OIPA_STUDY_2014 Number of Low Bleed devices (COUNT) OIPA_STUDY_2014 Bleed rate, Low Bleed devices (SCF/HR/DEVICE) OIPA_STUDY_2014 Number of High Bleed devices (COUNT) OIPA_STUDY_2014 Bleed rate, High Bleed devices (SCF/HR/DEVICE) OIPA_STUDY_2014 Number of Intermittent Bleed devices (COUNT) 3.6 OIPA_STUDY_2014 Bleed rate, Intermittent Bleed devices (SCF/HR/DEVICE) 1.05 OIPA_STUDY_2014 OIPA Basin Factors: for normally functioning pneumatic devices. OKDEQ Speciation Profiles: calculated only for counties with at least 10 unique sales gas composition analyses 14


15 Run2_MalfunPneuDev STEP 2: Add VOC emissions from malfunctioning pneumatic devices to Fugitives: All Process SCCs
16 Run2_MalfunPneuDev Run of the tool that generates emissions from malfunctioning pneumatic devices The emissions are aggregated to fugitive SCCs and added to the final staging table Includes: ONLY pneumatic device SCCs Pneumatic device basin factor data for malfunctioning pneumatic devices (OIPA, 2014) 16
17 Run2_MalfunPneuDev BASIN FACTOR - DATA_CATEGORY CURRENT_VALUE CURRENT_REFERENCE Number of No Bleed devices (COUNT) OIPA_STUDY_2014 Bleed rate, No Bleed devices (SCF/HR/DEVICE) OIPA_STUDY_2014 Number of Low Bleed devices (COUNT) OIPA_STUDY_2014 Bleed rate, Low Bleed devices (SCF/HR/DEVICE) OIPA_STUDY_2014 Number of High Bleed devices (COUNT) OIPA_STUDY_2014 Bleed rate, High Bleed devices (SCF/HR/DEVICE) OIPA_STUDY_2014 Number of Intermittent Bleed devices (COUNT) 3.6 OIPA_STUDY_2014 Bleed rate, Intermittent Bleed devices OIPA_STUDY_2014; 2.0 (SCF/HR/DEVICE) Allen_Study_2014 OIPA Basin Factors: for malfunctioning pneumatic devices. (Emissions from normally operating pneumatic devices were generated from the previous run.) 17

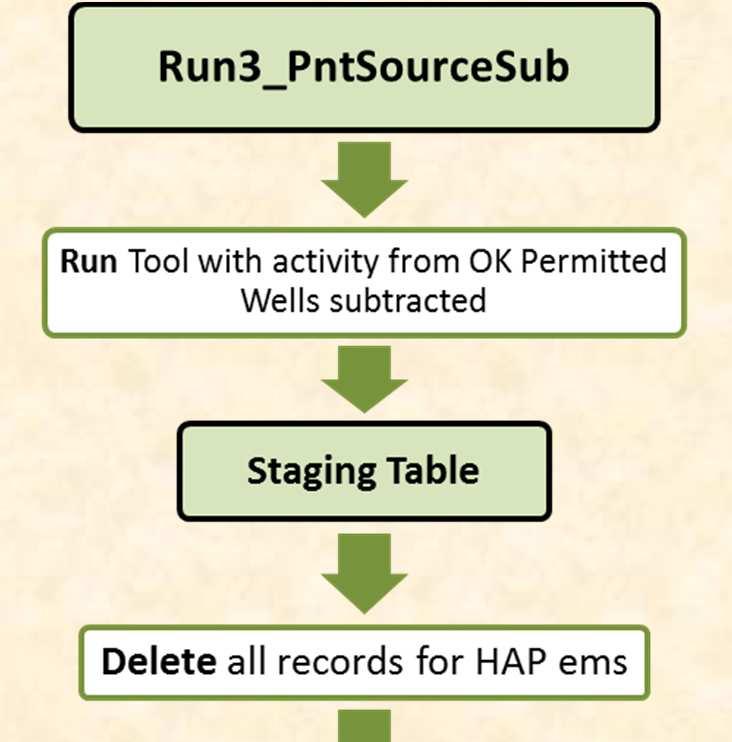

18 Run3_PntSourceSub RUN 3: Subtract permitted wellhead activity; accounts for unpermitted wellhead emissions
19 Run3_PntSourceSub Subtraction of: AERR type A &B point source activity OKDEQ permitted/inventoried well activity that have matched API numbers in the HPDI database Emissions after the point source subtraction are added to the final staging table Includes: All SCCs EXCEPT pneumatic devices OKDEQ local gas composition data (speciation profiles for fugitives, gas-actuated pumps, and liquids unloading) 19
20 Run3_PntSourceSub (Fugitive Components) Our point inventory contained inconsistent characterizations of fugitive SCCs. We felt it did not justify the level of granularity shown in the Tool. Aggregate fugitive component emissions by well type, then append into new Fugitives: All Process SCCs Gas Wells CBM Wells Oil Wells Connectors Flanges Open Ended Lines Valves Other N/A All Process Delete all fugitive component SCC records in the Emissions and EmissionsProcess table 20
21 Comparison: OKDEQ Point Source Activity Data OKDEQ Permitted Wells TOTAL (HPDI) % Point Total Liquids (BBL) 55,901, ,319,665 48% Total Gas (MCF) 713,638,549 2,162,187,694 33% # Oil Wells 3,397 21,060 16% # Gas Wells , % # CBM Wells 66 3, % Note the range in coverage OKDEQ permitted wells capture: Almost 50% of the total liquids production, but only 16% of oil wells 33% of the total gas production and less than 3% of gas wells 21


22 Run4_OKPermitWellAgg 22
23 Run4_OKPermitWellAgg Not a run of the Tool, but the process of mapping our permitted wellhead emission data into the final staging table After filtering out facilities in our inventory that had already reported as AERR Type A and B sources, we aggregated the remaining point emissions by SCC grouping, pollutant, and well type Grouped point SCCs are cross-walked to area SCCs Emissions are added to the final staging table
24 Step 4 Aggregate Point Emissions, Tanks List of Point SCC emissions aggregated in preparation for mapping to tank area SCCs Count SumOfEms (TPY) Point SCC PointSCC_L Fixed Roof Tank, Condensate, working+breathing+flashing losses Fixed Roof Tank: Flashing Loss Fixed Roof Tank, Crude Oil, working+breathing+flashing losses Fixed Roof Tank: Working Loss Fixed Roof Tank: Breathing Loss Flares Flares Flares Combusting Gases : 1000 BTU/scf Natural Gas 24


25 Run4_OKPermitWellAgg Once point emissions were aggregated into a chosen group, they were allocated to gas, oil, and CBM wells in each county using well-type ratios 25
26 Run4_OKPermitWellAgg Allocate point emissions by well type using well type ratios (HPDI county averages for the permitted wellheads) ex Coal County VOC Point Ems for Coal County : 69.3 TPY Coal County Gas Well Ratio: Coal County CBM Well Ratio: Coal County Oil Well Ratio: VOC Point Ems at Gas Wells in Coal County 60.6 TPY VOC Point Ems at CBM Wells in Coal County 2.2 TPY VOC Point Ems at Oil Wells in Coal County 6.5 TPY 26
27 Run4_OKPermitWellAgg Using a point to nonpoint SCC crosswalk, we added the well-type allocated point emissions to a related nonpoint SCC that was present in the Oil & Gas Tool VOC Point Ems at Gas Wells in County-X VOC Point Ems at CBM Wells in County-X VOC Point Ems at Oil Wells in County-X Add To Add To Add To (VOC Ems at Condensate Tanks at Gas Wells in County-X) (VOC Ems at Condensate Tanks at CBM Wells in County-X) (VOC Ems at Crude Oil Tanks in County-X) 27
28 Point to Nonpoint Crosswalk Point_SCC Gas Wells, Nonpoint SCC CBM Wells, Nonpoint SCC Oil Wells, Nonpoint SCC Other, Nonpoint SCC Pollutants Tanks & Flares Condensate Tanks Condensate Tanks Crude Oil Tanks N/A VOC, NO x, CO, SO x, PM 10, PM Cycle Rich cycle Rich cycle Rich Artificial Lift N/A VOC, NO x, CO, SO x, PM 10, PM cycle Lean cycle Lean cycle Lean Artificial Lift N/A VOC, NO x, CO, SO x, PM 10, PM cycle Lean cycle Lean cycle Lean Artificial Lift N/A VOC, NO x, CO, SO x, PM 10, PM Unspecified Engines cycle Rich cycle Lean cycle Rich Artificial Lift 4-cycle Lean N/A VOC, NO x, CO, SO x, PM 10, PM 2.5 These are HP Engine Area SCCs. In reality, some of the engines we inventory will have HP outside of this range. 28
29 Point to Nonpoint Crosswalk Cont. Point_SCC Gas Wells, Nonpoint SCC CBM Wells, Nonpoint SCC Oil Wells, Nonpoint SCC Other, Nonpoint SCC Pollutants Fugitives Fugitives All Process Fugitives All Process Fugitives N/A VOC Loading Racks Tank Truck & Railcar Loading: Condensate Tank Truck & Railcar Loading: Condensate Tank Truck & Railcar Loading: Crude Oil N/A VOC Process Heaters Gas Well Heaters CBM Well Heaters Heater Treaters N/A VOC, NO x, CO, SO x, PM 10, PM Tanks, Produced Water N/A N/A N/A Produced Water VOC Dehydrators Dehydrators N/A N/A N/A VOC, NO x, CO, SO x, PM 10, PM
30 Run1_NormFuncPneuDev Run2_MalfunPneuDev Run3_PntSourceSub Run Tool with all area SCCs (to generate support tables) Run Tool for only pneumatic devices Run Tool with activity from OK Permitted Wells subtracted Staging Table Staging Table Staging Table Delete records for all emissions (except VOC from pneu. dev.) Append malfun. pneu. dev. VOC ems to new Fugitive - All Process SCCs Delete all records for HAP ems Final Staging Table Aggregate criteria Fugitive component SCC ems. Append into new Fugitive - All Process SCCs Delete all ems records for Fugitive component SCCs OKDEQ Emission Inventory Filter out ems from facilities already reported as point sources Aggregate point ems for related point SCCs Update aggregated Point ems to Area SCCs using Point to Nonpoint Crosswalk Append all records for criteria ems (except for Fugitives); Update Fugitive VOC emissions 30
31 Final Comparison Analysis Pollutant Run with EPA defaults The Oil and Gas tool v2.1 without any point source subtraction or other alteration Final Run - Total emissions from the final staging table of the flow chart procedures. NOx (tons) 41,300 54,900 VOC (tons) 148, ,300 31
32 Comparison of Emissions per Well (Nonpoint vs. Point) 2014 O&G Tool v1.0 w/o Modifications Oklahoma Permitted Wells Total Number of Wells (Oil, Gas, & CBM Combined) 55,568 4,306 Total Emissions NO X (tons) 42,166 16,190 VOC (tons) 147,984 38,836 Per Well Emissions NO X (tons/well) VOC (tons/well)
33 Remaining Questions/Concerns Source Classification Code structure Poor descriptions and missing codes Crosswalk between point & nonpoint SCCs Definition of gas well vs. oil well Reclassification of well types (affects where emissions are appearing and changes the emission factors in the tool) Point source inventory mitigates this problem (e.g. 48% of liquids in OKDEQ point inventory) 33

 If gas wells (and their associated production) are classified in the")
34 OKDEQ Simple Sensitivity Analysis ings/ /OKDEQ2014OGToolSensitivityAnalysis.pdf The tool is sensitive to classification hydrocarbons as: Oil (crude and associated gas) Gas (condensate and gas well gas) If gas wells (and their associated production) are classified in the Tool as oil wells, VOC and NOx emissions would be underestimated. 34

35 Remaining Questions/Concerns (Continued) Better Characterizing Super-Emitters Reconciling Top-Down vs Bottom-Up Estimates Closing the Midstream Gap Identifying and Characterizing Other Missing Sources orkshop_meeting_2016/6.2_gibbs_okdeq_- _The_Future_of_Oil_and_Gas_Inventories_ pdf 35

36 Questions? Carrie Schroeder Oklahoma DEQ, Emission Inventory