Ozone forms from NOX+VOC+Sun. Source:
|
|
|
- Elmer McDaniel
- 5 years ago
- Views:
Transcription
1 1

2 2

3 Ozone forms from NOX+VOC+Sun Source: 3
4 4
5 Tons per day Progress: Reduced in O 3 precursors VOC NOX Source: RAQC, 2017 Emissions Inventory and Reasonable Further Progress Demonstration DRAFT, March
6 Progress: Inflection point VMT vs Pop Note: Colorado GDP up 30% since 2000 Source: DRCOG (draft 20 May 2015) 6

 New regulations established by Air Quality Control")
7 VOC Emissions: What is being done? New car/truck standards Cleaner fuels/ Alternative fuels Inspection/maintenance programs New vehicle technologies Transportation/land use programs Travel reduction programs Oil and Gas (O&G) New regulations established by Air Quality Control Commission in Feb Lawn and garden equipment change-out programs 7


8 NOx Emissions: What is Being Done? New car/truck standards Cleaner fuels/ Alternative fuels Inspection/maintenance programs Diesel retrofits New vehicle technologies Transportation/land use programs Travel reduction programs Power Plants Clean Air Clean Jobs Act Renewable energy/energy efficiency programs Clean Power Plan Small engine standards Non-road engine standards Locomotive engine standards Emissions Standards for Large Engines and Boilers 8
9 Background Ozone Background ozone is a significant issue, especially in the West Background ozone is from natural events and non-u.s. anthropogenic sources Past and recent studies have shown >55-60% of high ozone in NFR and Colorado due to background ozone Colorado ~18-25 ppb 25-35% Interstate ~8-12 ppb 10-15% US Background ~42-47 ppb 55-60% 9
10 What can you do? Next board meeting: Friday 6 May at 9:30am at Chamber building Mower exchange: Sat 7 May at Dicks Sporting Good park (must pre-register) Ozoneaware: Everytripcounts.org : commit to reduce 2 car trips per week this summer Log trips: ozoneaware.org/calculator/ RAQC.org 10
11 11
12 Regional Air Quality Council Lead agency for air quality planning for the Denver/ North Front Range region Primary responsibilities Planning to meet federal air quality standards (SIPs) and state standards Conduct programs of public education and awareness Implement public/private projects to reduce emissions and improve air quality Represent and assist local governments in the air quality planning process 12
13 Carbon Monoxide attained in 1995 PM-10 attained in 1993 Federal Standards PM-2.5 never violated 1997 Standard 2006 Standard 2012 Standard Ozone 1-hour standard (125 ppb) attained in Standard (84 ppb) attained in 2009 X 2008 Standard (75 ppb) out of compliance X 2015 Standard (70 ppb) out of compliance 13

 Monitor 2013-2015 Design Value (ppb)* Welby 71 Aurora East 69 South Boulder Creek 74 CAMP 65 La Casa 69 Chatfield State")
14 DV 70 = Design Value ( )*,** Design Values Map Modified from FHWA ( * Data current as of 9/30/2015 ** Orange Exceeds Standard = 8-Hour Ozone 2008 Standard Nonattainment Area = Denver Regional Council of Governments (DRCOG) = North Front Range Metropolitan Planning Organization (NFRMPO) Monitor Design Value (ppb)* Welby 71 Aurora East 69 South Boulder Creek 74 CAMP 65 La Casa 69 Chatfield State Park 79 Welch 73 Rocky Flats 79 NREL 80 Aspen Park 70 Rocky Mtn. Nat'l Park 70 Fort Collins - West 77 Fort Collins - CSU 71 Greeley - Weld Tower 72 14
 due in 2017 RAQC, CDPHE, and AQCC are in process of developing the")
15 2008 Ozone Standard 75 ppb Established by EPA in March 2008 Denver/NFR area designated Marginal nonattainment area in 2012 Region failed to attain standard as required by July 2015 Region will be bumped up to Moderate Area by EPA New air quality plan (SIP) due in 2017 RAQC, CDPHE, and AQCC are in process of developing the plan 15
16 Status of Initial 2008 Nonattainment Areas 46 Areas Nationwide Marginal: Bump-Up (Not Attaining based on data) 11 areas Atlanta, GA El Centro, CA New York-New Jersey, NY-NJ Bakersfield, CA Grass Valley, CA Phoenix, AZ Chicago, IL Hartford, CT San Diego, CA Denver/North Front Range, CO Mariposa County, CA Marginal: 1-yr. Extension (based on 2014 data) 8 areas Cleveland, OH Pittsburgh, PA Sheboygan, WI Houston, TX St. Louis, MO Washington-Arlington, DC-VA Philadelphia, PA San Luis Obispo, CA Marginal: Attained by July 20, 2015 (based on data) 17 areas Allentown-Bethlehem, PA-NJ Columbus, OH Reading, PA Baton Rouge, LA Dukes County, MA Red Bluff, CA Calaveras County, CA Jamestown, NY Rock Springs, WY Charlotte-Concord, NC-SC Knoxville, TN San Francisco-Oakland, CA Chico, CA Lancaster, PA Seaford, DE Cincinnati, OH Memphis, TN Moderate and Above (2018+ Attainment Date) Baltimore, MD Dallas-Fort Worth, TX Los Angeles-San Bernardino, CA Los Angeles-South Coast Basin, CA Morongo Band of Mission Indians, CA Pechanga Band of Luiseno Mission Indians, CA 10 areas Oxnard, CA Riverside-San Bernardino, CA Sacramento, CA San Joaquin, CA 16
17 New 2015 Ozone Standard - 70 ppb CAA section 109(d) requires EPA to review the scientific information and National Ambient Air Quality Standards every five years. In setting NAAQS, EPA may not consider cost. (Whitman v. American Trucking Associations, 531 U.S. 457, 473 (2001)) EPA was under court order to review standard by December 1, 2014 and finalize decision by October 1, EPA proposed a standard range between ppb in Dec EPA Administrator issued the final standard of 70 ppb on Oct. 1,

18 Statewide Ozone Status 18

19 National Projections for 2015 Ozone Standard 2014 Source: EPA - based on data 19

20 2015 Standard Implementation Standard finalized at 70 ppb Oct State recommendations on area designations due Oct EPA issued guidance on this process in early EPA finalize area designations/classifications by Oct Marginal Area attainment date Oct Moderate Area attainment date Oct (New SIP due Oct. 2020) 20
21 Legal Challenges to 2015 Standard Some states and business groups have challenged the standard in court as being too stringent Other states and environmental/public health groups have challenged the standard as not being stringent enough In the meantime, EPA and the states are moving forward with the process to implement the standard 21
 2013 Air Quality Data")
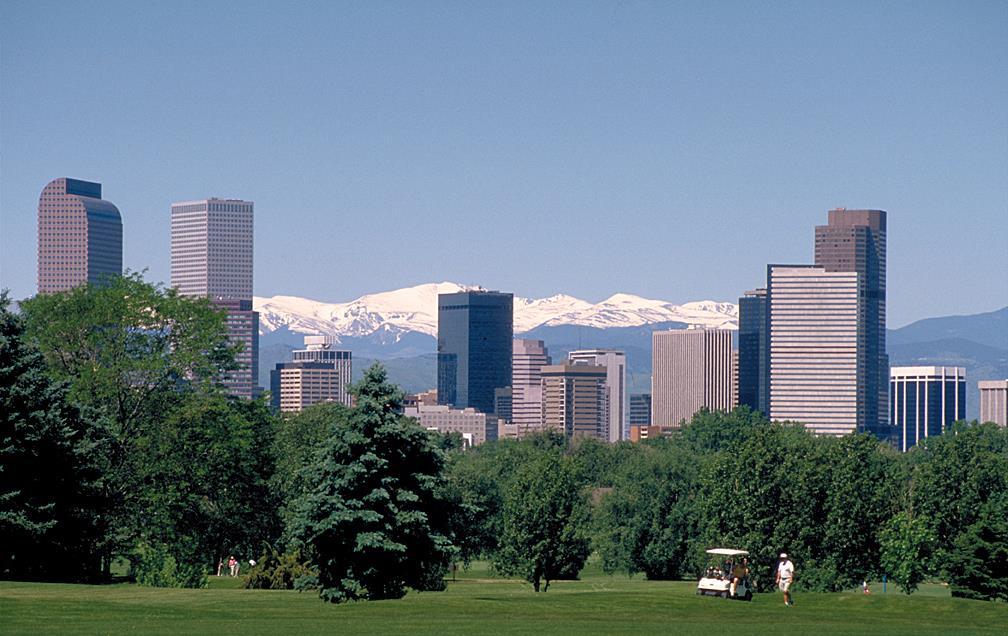
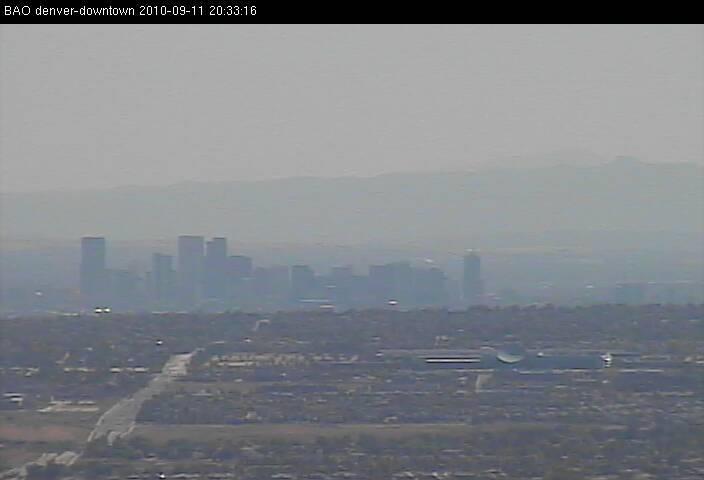
22 Annual Visibility In Denver Source: Air Pollution Control Division (APCD) 2013 Air Quality Data Report
23 Progression of EPA Ozone Standard
24 Hour Ozone (ppb) 8-Hour Ozone Trend and Federal Standards Hour Ozone Standard <85 ppb Hour Ozone Standard 75 ppb Range Proposed by EPA for 2015 Standard Annual 4th Highest Daily Maximu m 8-Hour Ozone (ppb) 3-Year Average 4th Max (Regional Design Value) Year 8-Hour Ozone Standard: Based on a three-year average of the annual forth-highest daily 8-hour maximum ozone concentration. 24