Air Quality Conformity. TTP220 S. Handy 4/25/16
|
|
|
- Julian Sparks
- 5 years ago
- Views:
Transcription
1 Air Quality Conformity TTP220 S. Handy 4/25/16
2 The 4-Step Model INPUTS? Land use data Network Population, income, autos by zone Employment by type by zone Represented as nodes and links Travel times from zone to zone 4-STEPS? Trip Generation Trip Distribution Mode Split Assignment # trips from zones - Ps # trips to zones - As # trips between each pair of zones % of trips between zones by each mode driving trips assigned to routes OUTPUTS? Volumes LOS
3 Demands on models have changed! New kinds of projects and policies, e.g. biking What variables are in the model? New kinds of criteria, e.g. environmental justice What outputs does the model produce? Requirements for public involvement How transparent is the model and its application? Greater recognition of relationships with LU How do models account for these relationships?


4 Challenges to Forecasts A federal court sided with the organization in a suit against WisDOT that challenged the traffic data used to justify the $146 million widening [from 2 to 4 lanes] of Highway 23 According to the ruling, the Wisconsin DOT failed to justify the amount of traffic it projected as likely to use the road in the future. The Court ruled that the project is ineligible for federal funding until documented accurate traffic forecasts can be made that justify expanding the highway Friends of Wisconsin, 5/28/15 See also: White Elephant Watch: Vol. 3
5 Challenges to Forecasts State departments of transportation all over the country use specious traffic projections to justify hugely expensive road widening projects. That s how you end up with the graph on the right showing how DOTs continued to forecast traffic growth year after year, even as driving stagnated Friends of Wisconsin Beyond certain procedural and design requirements, states have unfettered discretion to determine what to build, which often results in projects that fail to provide clear benefits or to advance national transportation policy objectives. Center for American Progress
6 New Transportation Planning Goals Measures Forecasts Congestion Reduction V/C Level-of-Service Travel Demand Model Environment Equity Accessibility?????? Environment - Air Quality Pollutant Emissions Travel Demand Model + Emissions Model
7 GOAL
 State Clean Air Act (1969,")
8 Air Quality Legislation Federal Clean Air Act (1963, 1970, 1990) State Clean Air Act (1969, 1988)
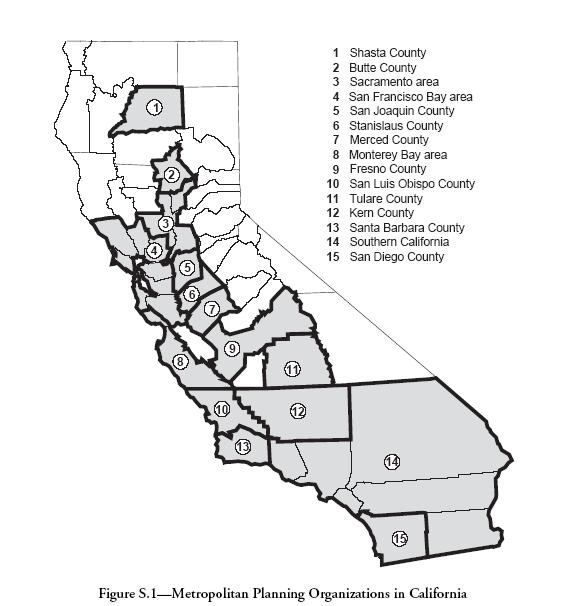
9 Air Quality Agencies Environmental Protection Agency (EPA) California Air Resources Board (CARB) Air Quality Management Districts (AQMDs) and Air Pollution Control Districts (APCDs)
10 Health-based NAAQS Pollutant Primary/ Secondary Averaging Time Level Carbon Monoxide (CO) primary 8 hours 9 ppm Lead (Pb) Nitrogen Dioxide (NO 2 ) Ozone (O 3 ) Particle Pollution (PM) Sulfur Dioxide (SO 2 ) primary and secondary 1 hour 35 ppm Rolling 3 month average primary 1 hour 100 ppb Form Not to be exceeded more than once per year 0.15 μg/m 3 (1) Not to be exceeded 98th percentile of 1-hour daily maximum concentrations, averaged over 3 years primary and 1 year 53 ppb (2) Annual Mean secondary primary and 8 hours ppm (3) Annual fourth-highest daily maximum 8-hour secondary concentration, averaged over 3 years 3 primary 1 year 12.0 μg/m annual mean, averaged over 3 years secondary 1 year 15.0 μg/m PM 3 annual mean, averaged over 3 years 2.5 primary and 24 hours 35 μg/m 3 98th percentile, averaged over 3 years secondary primary and PM hours 150 μg/m 3 Not to be exceeded more than once per year secondary on average over 3 years primary 1 hour 75 ppb (4) 99th percentile of 1-hour daily maximum concentrations, averaged over 3 years secondary 3 hours 0.5 ppm Not to be exceeded more than once per year Source:

11 Source: State standards stricter than federal standards
12 PROBLEM See the American Lung Association s State of the Air
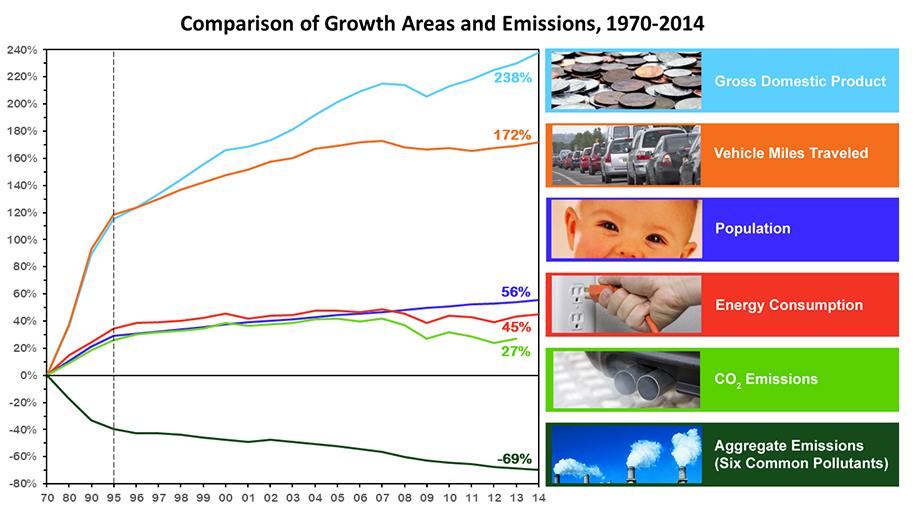
13 Progress!
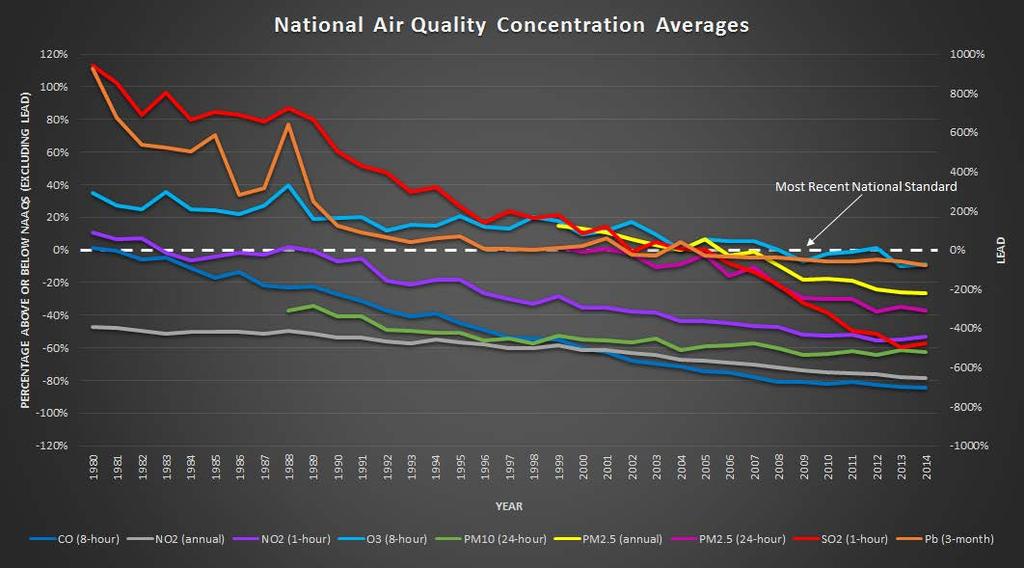
14
15
16
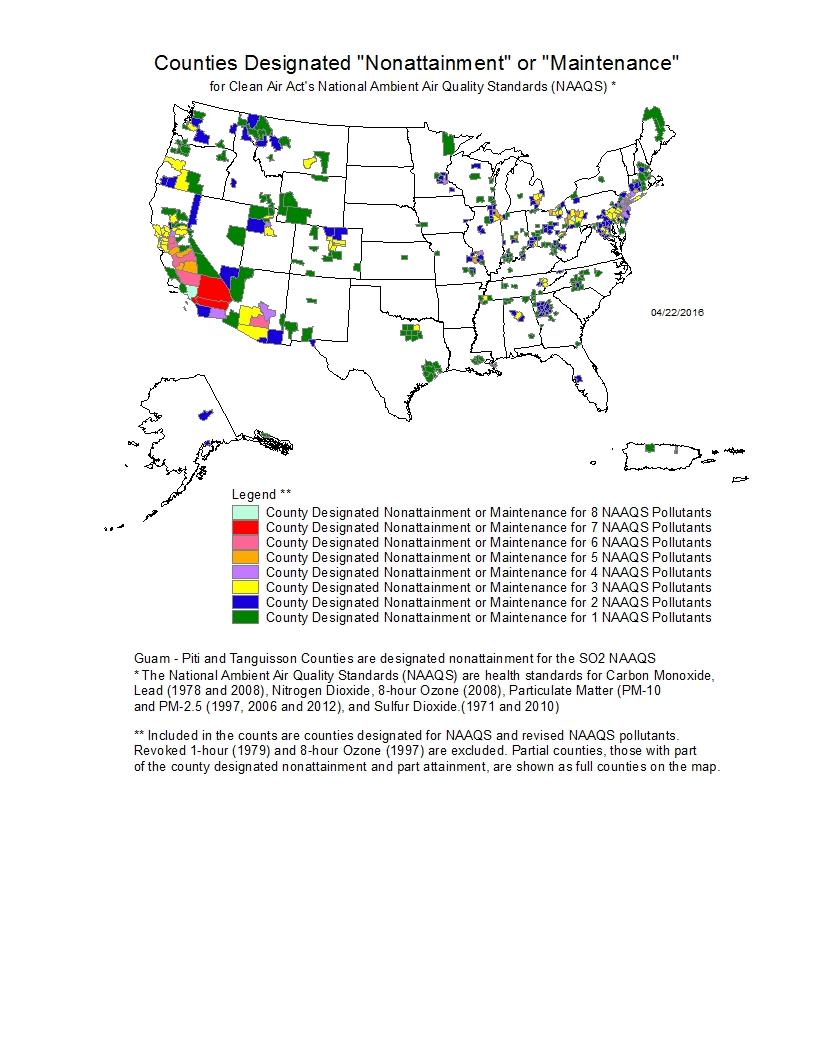
17 Population Density in Non-Attainment Areas
18 Number of people living in non-attainment counties (2007) In 2016 more than half of all Americans 166 million people live in counties where they are exposed to unhealthful levels of these pollutants. ALA SOTA
19 Ozone = (VOCs + NO x + heat + sun) Formed in atmosphere by photochemical reactions Colorless and odorless at low concentrations Strong lung, throat, and eye irritant Decreases lung function Increases respiratory problems, asthma, hospitalization, and contributes to heart disease Contributes to 80,000 premature deaths/year in CA

20 Sources of Emissions Ozone On-Road Mobile Sources
21
22 CONFORMITY DEFINED
23 Intergovernmentalism in Transportation Planning $ with strings attached Federal State State System Regional Local Proposed projects Regional System Local System
24 Congestion Management/Air Quality $ billion per year under FAST Act Apportionment to states: Previoulsy: based on population and severity of AQ problem MAP-21: based on historic (2009) CMAQ apportionment. No direct suballoaction to MPOs. States decide. 25 percent of $ must be for PM 2.5 non-attainment. Projects must reduce congestion & emissions: ozone, PM-10, CO help reach AQ attainment control VMT/capita e.g. bicycle coordinator, traffic signal coordination Newly eligible under FAST Act: vehicle-to-infrastructure communications equipment, EV and natural gas infrastructure
25 What Is Transportation Conformity? Transportation Conformity Reference Guide Revised 2010 Transportation conformity is a way to ensure that Federal funding and approval are given to those transportation activities that are consistent with air quality goals. It ensures that these transportation activities do not worsen air quality or interfere with the "purpose" of the State Implementation Plan (SIP), which is to meet the NAAQS. Meeting the NAAQS often requires emissions reductions from mobile sources. Source:
26 What Is Transportation Conformity? Conformity Air Quality Planning Transportation Planning State Implementation Plan (SIP) Air Quality Management Districts
27
28

 Short-term")
 Projects")
29 What Is Transportation Conformity? The following must conform to the purpose of the SIP : Long Range Plan (LRP / RTP / MTP) Short-term Transp. Improvement Program (TIP) Projects with FHWA, FTA funding and/or approval
30 What Is Transportation Conformity? Conforming to the purpose of the SIP means that such activities will not: Cause or contribute to any new violations of the national ambient air quality standards (NAAQS) Increase the frequency or severity of NAAQS violations Delay timely attainment of the NAAQS or any required interim milestone
31 What does it apply to? On-road mobile sources and their pollutants Non-Attainment and Maintenance Areas
32 CONFORMITY PROCESS
33 Who does what? Agency State MPO FHWA, FTA EPA Role Adopts State Implementation Plan Does conformity analysis for plans, TIPs Makes conformity determination Provides guidance Note: Project-level conformity determination in NEPA process
34 How does one get a conformity determination? Regional emissions analysis more momentarily Latest planning assumptions and emissions model Timely implementation of transportation control measures (TCMs) in an approved SIP Interagency consultation conformity meeting air quality standards
35 Exhibit 3-1 Transportation Control Measures CAA 108(f)(1)(A), 42 U.S.C. 7408(f)(1) i. programs for improved public transit; ii. restriction of certain roads or lanes to, or construction of such roads or lanes for use by, passenger buses or high-occupancy vehicles (HOV); iii. employer-based transportation management plans, including incentives; iv. trip-reduction ordinances; v. traffic flow improvement programs that achieve emissions reductions; vi. fringe and transportation corridor parking facilities serving multiple-occupancy vehicle programs or transit service; vii. programs to limit or restrict vehicle use in downtown areas or other areas of emissions concentration particularly during periods of peak use; viii. programs for the provision of all forms of high-occupancy, shared-ride services; ix. programs to limit portions of road surfaces or certain sections of the metropolitan area to the use of non-motorized vehicles or pedestrian use, both as to time and place; x. programs for secure bicycle storage facilities and other facilities, including bicycle lanes, for the convenience and protection of bicyclists, in both public and private areas; xi. programs to control extended idling of vehicles; xii. programs to reduce motor vehicle emissions which are caused by extreme cold-start conditions; xiii. employer-sponsored programs to permit flexible work schedules; xiv. programs and ordinances to facilitate non-automobile travel, provision and utilization of mass transit, and to generally reduce the need for single-occupant vehicle travel, as part of transportation planning and development efforts of a locality, including programs and ordinances applicable to new shopping centers, special events, and other centers of vehicle activity; xv. programs for new construction and major reconstruction of paths, tracks, or areas solely for use by pedestrian or other non-motorized means of transportation when economically feasible and in the public interest. For purposes of this clause, the Administrator shall also consult with the Secretary of the Interior; and xvi. programs to encourage the voluntary removal from use and the marketplace of pre-1980 model year light duty vehicles and pre-1980 model light duty trucks. * *Note: Excluded from CMAQ Funding under Title 23 U.S.C. Section 149 Source:
36 State Implementation Plan (The SIP) SIPs are not single documents. They are a compilation of new and previously submitted plans, programs (such as monitoring, modeling, permitting, etc.), district rules, state regulations and federal controls. Many of California's SIPs rely on the same core set of control strategies, including emission standards for cars and heavy trucks, fuel regulations and limits on emissions from consumer products. State law makes ARB the lead agency for all purposes related to the SIP. Local air districts and other agencies, such as the Bureau of Automotive Repair and the Department of Pesticide Regulation, prepare SIP elements and submit them to ARB for review and approval. ARB forwards SIP revisions to the U.S. Environmental Protection Agency (U.S. EPA) for approval and publication in the Federal Register. The Code of Federal Regulations Title 40, Chapter I, Part 52, Subpart F, Section lists all of the items which are included in the California SIP. At any one time, several California submittals are pending U.S. EPA approval. Source: (2009)
37 Source:
")
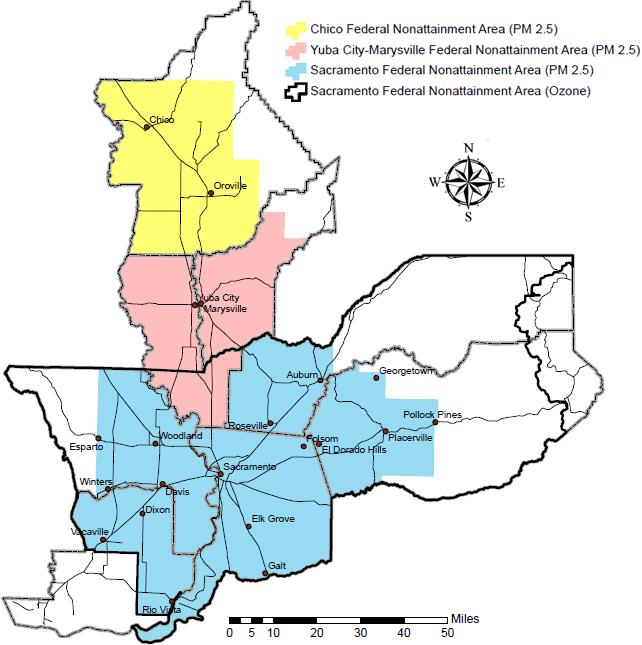
38 Sacramento Regional 8-Hour Ozone Attainment and Reasonable Further Progress Plan (2008)
")
39 Sacramento Regional 8-Hour Ozone Attainment and Reasonable Further Progress Plan (2008)

40 Sacramento Regional 8-Hour Ozone Attainment and Reasonable Further Progress Plan (2008) Budget test: estimated emissions for LRP and TIP are less than or equal to budget for each pollutant or precursor
41 Conformity Failures Conformity Lapse (e.g. Atlanta, Sacramento) Conformity determination is 12 months beyond expiration, or failure to implement control strategies Can t go forward with federally funded projects except for TCMs in SIP Conformity Freeze (e.g. NJ) Disapproval of SIP by EPA Can t approve new LRP or TIP c. 1999

42 Transportation Conformity Due to litigation in other parts of the country, the Federal Highway Administration has become sensitive to the issue of applying the most current vehicle fleet information to a region s transportation conformity analysis. The current SIP s fleet information is about 10 years old. The Sacramento Area Council of Governments (SACOG) is the agency responsible for demonstrating transportation conformity in our region. SACOG estimates that applying the most recent fleet data to our existing models would result in a conformity lapse. The state Air Resources Board, SACOG, U.S.EPA and FHWA have negotiated approval to use the 1994 vehicle fleet data through December 31, After that time, conformity findings can be made only if the new fleet data is used. This means that the transportation plans and transportation improvement programs now in place for our region, as well as 21 other air districts in the state, cannot be changed until the region has a new clean air plan. The Sacramento region, unlike others in the state, is not required to update the SIP before the 8-hour ozone plans are due in However, since a conformity lapse began October 4, 2004, an expedited process to prepare a plan is underway. Source:
43 Source:

44 The 2006 MTP, which was adopted March 16, 2006, will be in effect until the MTP2030 is adopted in It restores many projects that could not be implemented while the region was in an air quality conformity lapse.
45 Implications Sanctions for not Doing air quality plans Doing required conformity tests No sanctions for not meeting NAAQS!

46 EMISSIONS FORECASTS

47 EMFAC used in California MOVES used elsewhere in U.S. Source: Modeling Mobile Source Emissions,

48 Source: Modeling Mobile Source Emissions,

49 Source: Modeling Mobile Source Emissions,
50 From travel model
51 Source:

52
53 Intergovernmentalism in Transportation Planning $ with strings attached Federal State State System Regional Local Proposed projects Regional System Local System
54 AB32 The California Global Warming Solutions Act of % reduction of GHG from 1990 levels by 2050 Million metric tons (CO 2 equivalent)
55 SB375 Sustainable Communities Planning Act of 2008 Targets for per capita GHG emissions reduction from cars and trucks for metropolitan areas, by reducing vehicle-miles-traveled (VMT) Sacramento 7% 16% Bay Area 7% 15% LA region 8% 13% San Diego 7% 13%


56 Sustainable Communities Strategies in conjunction with RTPs
57
58

59 By implementing the transportation and land use components of the MTP/SCS, and including measures from the Scoping Plan, 2020 emissions are forecasted to be MMtCO2e for the region in This is 12 percent below the target set by AB 32.

60 The per capita GHG pounds per day emissions for the region were 23.0 in 2005, which sets the benchmark for SB 375 reduction. Based on the development in the MTP/ SCS, GHG per capita emissions reduce to 20.8 pounds per day in This is a 9.6 percent reduction from 2005 to 2020, well below the 7 percent reduction set by ARB.
61
62 State Implementation Plan (SIP) AREA SOURCES STATIONARY SOURCES Land MOBILE SOURCES Emissions standards Transportation Control Measures (TCMs) Land use strategies City and County General Plans
63 Key Points Top-down efforts to push regional (and local) transportation (and land use) policy Has it made any difference? Use of models to assess whether plan meets the goals Has it made any difference?
64 Next Up Wednesday, 4/27 Monday, 5/2 Wednesday, 5/5 Monday, 5/9 Wednesday, 5/11 Programming Project Development Local Government MPO Critique MPO Presentations Followed by evaluation of strategies! Pick topics on 5/11