2014 Chesapeake Bay Watershed Agreement:
|
|
|
- Imogene Sullivan
- 5 years ago
- Views:
Transcription
1 2014 Chesapeake Bay Watershed Agreement: Management Strategy for the 2017 WIP Outcome, 2025 WIP Outcome, and Water Quality Standards Attainment & Monitoring Outcome Introduction Draft February 9, 2015 For the past 30 years, the Chesapeake Bay Program (CBP) partnership 1 has been committed to achieving and maintaining the water quality conditions necessary to support living resources throughout the Chesapeake Bay watershed. Building off these commitments and using the best scientific information available, the CBP partnership agreed to the nutrient and sediment allocations in the 2010 Chesapeake Bay Total Maximum Daily Load (Bay TMDL) 2, a historic and comprehensive pollution reduction effort in the Chesapeake Bay watershed. The Bay TMDL identifies the necessary pollution reductions of nitrogen, phosphorus and sediment across the seven Bay watershed jurisdictions of Delaware, Maryland, New York, Pennsylvania, Virginia, West Virginia and the District of Columbia to meet applicable water quality standards in the Bay and its tidal waters. Reducing pollution is critical to restoring the Chesapeake Bay watershed because clean water is the foundation for healthy fisheries, habitats, and communities across the region. All partners and source sectors 3 must contribute substantial efforts to achieve the Bay TMDL allocations. The Watershed Implementation Plans (WIPs), developed by the seven Bay watershed jurisdictions, provide a roadmap for how the jurisdictions, in partnership with federal and local governments, will achieve the Bay TMDL s nutrient and sediment allocations. As such, the WIPs collectively serve as the foundation of the Management Strategy for the water quality related outcomes. The jurisdictions are expected to develop WIPs over three Phases. Phase I and Phase II WIPs, developed and submitted to EPA in 2010 and 2012, respectively, describe actions and controls to be implemented by 2017 and 2025 to achieve applicable water quality standards. The Phase II WIPs build on the initial Phase I WIPs by providing more specific local actions. The Phase I and Phase II WIPs can be accessed here: As part of the accountability framework established in the Bay TMDL, jurisdictions also establish short-term goals in the form of two-year milestones which are based on the WIPs and have been reported to EPA since In 2018, the seven Bay watershed jurisdictions will develop Phase III WIPs that provide more information on what actions the jurisdictions intend to implement between 2018 and Based on a midpoint assessment of progress and scientific analyses that is currently underway through 2017, the Phase III WIPs will be developed so that by 2025 all practices are in place that are necessary to meet applicable water quality standards in the Bay and its tidal tributaries. In conjunction with the implementation of the WIPs, the CBP partnership is currently engaged in an evaluation of water quality changes to explain progress toward meeting water quality standards and the Bay TMDL. This evaluation includes assessing changes in nutrients and sediment in the Bay watershed and analyzing water quality trends in the estuary and tidal tributaries. In addition, the CBP partnership will conduct selected EPA s Chesapeake Bay TMDL: 3 Section 4 of the Bay TMDL: wastewater, agriculture, urban storm water, septic systems, forests and air 1
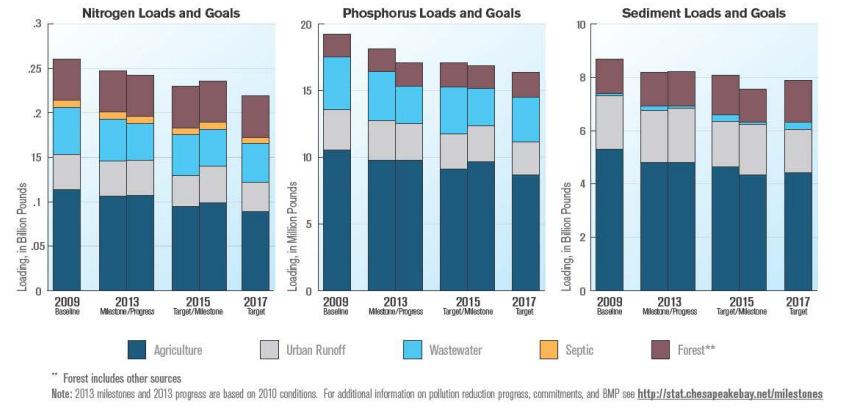
2 assessments of factors affecting progress towards restoring water quality, habitat, fish and wildlife, and conserving lands, including the effects of management activities. Further incorporation and use of monitoring information to assess progress is critical to better understand how on the ground actions have an impact toward meeting the 2017 and 2025 WIP outcomes, particularly since monitoring assessments will ultimately determine when the jurisdictions water quality standards are achieved. Outcomes & Baselines Background In 2009, the Chesapeake Bay Executive Council established the CBP goal that all practices for a clean Chesapeake Bay be in place by The Bay TMDL describes this goal, as well as the interim goal that practices be in place by 2017 to achieve 60 percent of the necessary reductions compared to The baseline for the 2017 goal are the 2009 estimates of nitrogen, phosphorus, and sediment loads (in pounds per year) in the Chesapeake Bay watershed. These estimates were obtained from the CBP partnership s modeling tools that are calibrated to monitoring data and use implementation data collected from the seven Bay watershed jurisdictions. The year 2009 was established as the baseline year because it the last year for which pollution reduction progress was assessed prior to EPA establishing the Bay TMDL in In 2012, the CBP partnership endorsed an integrated approach to assessing progress toward meeting the Bay TMDL nutrient and sediment reduction goals and attaining applicable water quality standards through using both modeling tools and monitoring data. CBP partners reaffirmed their continued support for monitoring networks, annual reporting of standards attainment, and nutrient and sediment trends in the watershed. The Chesapeake Bay's tidal waters are divided into 92 segments, and each segment has up to 5 designated aquatic life uses which equates to a total of 291 designated uses. The measure of success for this integrated approach is to meet all applicable water quality criteria in the tidal Chesapeake Bay necessary to protect the designated uses for those 92 segments. Water Quality Outcomes in the 2014 Chesapeake Bay Watershed Agreement 2017 WIP Outcome: By 2017, have practices and controls in place that are expected to achieve 60 percent of the nutrient and sediment pollution load reductions necessary to achieve applicable water quality standards compared to 2009 levels WIP Outcome: By 2025, have all practices and controls installed to achieve the Bay s dissolved oxygen, water clarity/submerged aquatic vegetation and chlorophyll a standards as articulated in the Chesapeake Bay TMDL document. Water Quality Standards Attainment & Monitoring Outcome: Continually improve the capacity to monitor and assess the effects of management actions being undertaken to implement the Bay TMDL and improve water quality. Use the monitoring results to report annually to the public on progress made in attaining established Bay water quality standards and trends in reducing nutrients and sediment in the watershed. Progress to Date The WIPs identify how the seven Bay watershed jurisdictions are putting measures in place by 2025 that are needed to restore the Bay, and by 2017 to achieve at least 60 percent of the necessary nitrogen, phosphorus, and sediment reductions compared to 2009 levels. As of 2013, based on the CBP partnership modeling tool estimates, practices are in place to achieve 27 percent of the nitrogen reductions, 43 percent of the phosphorus reductions, and 37 percent of the sediment 2
3 reductions (compared to 2009 levels) that are necessary to attain applicable water quality standards in the Bay 4. Attaining water quality standards is essential to other CBP goal areas including habitat and fisheries. Attaining the standards also provide substantial benefits for protection of human health, aesthetic, and recreational uses. The water quality standards attainment outcome will require the monitoring of water quality conditions to assess progress towards achieving applicable water quality standards in Bay and tidal water restoration to support aquatic living resources. Through 2012, the CBP partnership found that 31 percent of the Bay and its tidal waters were attaining applicable water quality standards (i.e., 90 of 291 designated uses have been met). Seventy percent of the monitoring sites through 2012 showed long-term improvements in nitrogen and phosphorus. From , nitrogen conditions improved at about one half of monitoring sites, while phosphorus concentrations show little or no change at more than one half of such sites. Improvement for sediment concentrations is less than that for nutrients, with 28 percent of monitoring sites showing long-term improvement (since 1985) and 10 percent of sites from Participating Jurisdictions & Agencies The current signatories of the 2014 Chesapeake Bay Watershed Agreement are EPA (on behalf of the United States), Virginia, Maryland, Pennsylvania, the District of Columbia, West Virginia, Delaware, New York, and the Chesapeake Bay Commission. The jurisdictional signatories developed the Phase I and Phase II WIPs to achieve the needed nutrient and sediment reductions whose controls are based on voluntary programs, regulations, permits, or otherwise enforceable agreements, such as contracts, that apply to major sources of these pollutants, including nonpoint sources. The final Bay TMDL is shaped by an extensive two-year public involvement effort. EPA based the TMDL allocations, in nearly all cases, on those proposed allocations included in the final Phase I WIPs, which detail how the jurisdictions will achieve/implement pollution reductions. The Bay TMDL, which describes an accountability framework including the 2017 and 2025 WIP outcomes, was developed through a highly transparent and engaging process. The outreach effort included hundreds of meetings with interested groups; two rounds of public meetings, stakeholder sessions and media interviews in all Bay watershed jurisdictions in fall of 2009 and 2010; a dedicated EPA website; a series of monthly interactive webinars; notices published in the Federal Register; EPA response to all TMDL comments; and a close working relationship with CBP committees representing citizens, local governments, and the scientific community. It was at the discretion of the Bay watershed jurisdictions to hold their own public meetings and public comment period for their respective WIPs, as these were state-developed documents 6. A substantial portion of the nitrogen, phosphorus and sediment controls necessary to meet the Bay TMDL allocations is expected to be implemented at the local level by CBP partners including conservation districts, local governments, planning commissions, utilities and watershed associations. Outreach to a variety of local entities may help the CBP partners assess and determine the ideal scale at which implementation will be reflected in the CBP modeling tools and where appropriate, quantify local target loads within the WIPs. The CBP partnership recognizes that individual jurisdictions may pursue somewhat different approaches to this local outreach. Factors Influencing Goal and Outcome Attainment There are four major factors that affect the ability of the CBP partnership to achieve the applicable water quality outcomes in the 2014 Chesapeake Bay Watershed Agreement: DE WIP; DC WIP; MD WIP; NY WIP; PA WIP; VA WIP; WV WIP 3
4 1. Continuing to sustain the capacity of governments and the private sector to implement practices. The jurisdictions have described their capacity (funding, authorities, and sustainability) to implement nitrogen, phosphorus, and sediment reduction practices several times over the past two decades. These include the tributary strategies developed during the 1990s and again in the mid-2000s, and more recently, in the Phase I and Phase II WIPs and two-year milestones, which also include strategies to build capacity in order to achieve pollutant reductions. Federal Agencies and land holders have described their capacity (funding, authorities, and sustainability) to implement nitrogen, phosphorus, and sediment reduction practices through the programs they administer or on the lands that they control as part of Executive Order These entities must continue to work towards sustaining adequate capacity necessary to complete the efforts. 2. Understanding the factors affecting the ecosystem response to pollutant load reductions to focus management efforts and strategies. Based on the current science and the associated CBP modeling system, the CBP partnership has demonstrated that implementing practices for reducing nitrogen, phosphorus, and sediment loads will achieve applicable water quality standards in the Bay. Improved understanding of the following elements could further enhance decision-making for the Phase III WIPs: (1) the factors affecting the time it will take to see improvements (i.e., lag times ) between implementation of practices and responses in water quality; (2) factors in addition to nitrogen, phosphorus, and sediment pollutant load reduction that affect response of DO, clarity, SAV, and chlorophyll; (3) the relationships between water quality improvements and the recovery of habitat conditions for fish and shellfish populations; and (4) how increases in plant and animal biomass in response to improved water quality improves the assimilative capacity of the system for nutrients and sediment. 3. Improving the identification of sources and their contributions to nitrogen, phosphorus, and sediment pollutant loads. The sources and their respective contributions of loads listed in the Bay TMDL is currently represented through CBP partnership models 8, USGS SPARROW models 9, and supporting tidal and nontidal monitoring networks and research. As described in the Bay TMDL document (Chapter 4), the sources that are modeled by the CBP partnership are based on U.S. Census Bureau and USDA Census data, federal and state permitting data, satellite imagery, and additional data submitted by seven watershed jurisdictions. As part of the Bay TMDL s midpoint assessment, the CBP partnership is currently incorporating additional/more recent local land use data, refining information on the transport of loads through the Bay watershed, and better predicting future impacts of population growth and climate change in the Bay watershed for incorporation into the modeling tools to improve implementation planning in Phase III. 4. Quantifying the reductions from pollution control practices and verifying their continued performance. The pollution reduction values associated with nitrogen, phosphorus, and sediment controls that the CBP partnership has approved for use in the models are based on extensive literature reviews and expert panel recommendations. Through its technical source sector workgroups and expert panels, the Water Quality Goal Implementation Team 10 (WQGIT) periodically refines these values based on new information and to take into account innovative practices. The CBP partnership is addressing the effectiveness and efficiency of practices by adopting principles to verify that reported practices are, indeed, in place and functioning as designed; further quantifying the effect of variations in watershed properties (such as different types of 7 Executive Order 13508: 8 CBP modeling tools: 9 USGS SPARROW model: A modeling tool for the regional interpretation of water quality monitoring data
5 soils) on controls; quantifying changes in Best Management Practices (BMP) performance over time; and evaluating the potential future impacts of climate change on BMP performance. To address the factors affecting achievement of the water quality outcomes, several efforts have been undertaken. The Scientific, Technical Assessment and Reporting 11 (STAR) team has set up a project to better measure and explain progress toward water quality improvements. This project will generate and improve understanding of the factors affecting system response (the Bay and its watershed) to implementation of management practices. STAR (under the CBP Modeling Workgroup 12 ) is also pursuing with STAC approaches to reduce uncertainties for models. Additional efforts to enhance monitoring are described in the Monitoring Progress section of this document. In addition to these four major factors, there are several other programmatic, management, and implementation factors that may affect attainment of the water quality outcomes. These issues are being addressed under the Bay TMDL s 2017 midpoint assessment. The Bay TMDL calls for an assessment in 2017 to review our progress toward meeting the nutrient and sediment pollutant load reductions identified in the 2010 Bay TMDL, Phase I and II WIPs and two-year milestones. The midpoint assessment provides the partnership with the opportunity to step back and assess how the Bay TMDL and WIP implementation are making a difference, if it s all working as intended, and if there s a better way we can implement our priorities and achieve our goals. The ultimate goal is to make implementation more streamlined and the challenges to implementation more understandable for the CBP partnership as we move towards 2017 and As part of the Bay TMDL s midpoint assessment, the CBP partnership has agreed to consider a number of issues and actions to better inform management on progress and implementation effectiveness, and what further decisions on implementation may be needed: Conducting a detailed multi-year assessment of chlorophyll in the tidal James River using augmented monitoring and modeling approaches o The CBP partnership is working closely with the principal investigators of the James River Chlorophyll-a criteria assessment to determine the criteria necessary in order to meet water quality standards in the James River. Criteria could change by becoming more stringent, less stringent, or existing criteria is confirmed. Factoring in effects from continued climate change o EPA and other partners are developing the tools to quantify the effects of changes in watershed flows, storm intensity, and changes in hypoxia due to increased temperatures and sea level rise in the estuary. Current efforts are to frame an initial future climate change scenario based on estimated 2025 conditions. The CBP partnership will need to decide if or when to incorporate these climate change considerations into the Phase III WIPs. Assessing the implementation potential of filter feeders for nutrient and sediment reductions o Living resource restoration was not considered in the Bay TMDL because low filter feeder biomass was insufficient to influence water quality, and because of future biomass uncertainty due to harvest, disease, and lack of habitat. Since then significant oyster restoration has occurred and more is planned, as well as a recent resurgence of aquaculture in the Chesapeake Bay. The oyster model will be revised as necessary to incorporate aquaculture operations and additional oyster biomass brought about by restoration activities including sanctuaries. Examining the impact the lower Susquehanna dams have on the pollutant loads to the Bay, including changes over time o The CBP partnership will work with the US Army Corps of Engineers Lower Susquehanna River Watershed Assessment (LSRWA) study and the STAR midpoint assessment work plan for the
6 assessment of trapping capacity behind dams, especially the Conowingo, as well as greater representation of local impoundments and reservoirs throughout the Phase 6 Watershed Model. The CBP partnership will need to address how to reduce the level of impairment in the Chesapeake Bay due to Conowingo. Enhancing the next generation of decision support tools (Phase 6) o The CBP partnership is currently revising the watershed modeling system structure to enhance decision support and to improve accuracy, transparency, and confidence. The Phase 6 suite of decision support tools will be refined in many ways, including the addition of simulation years, monitoring stations, and updated BMP efficiencies. Revisiting Watershed Model calibration methods with the goal of improving local watershed results o Different calibration methods will be assessed for the calibration of flow, sediment, and nutrients. o A precipitation data set for the entire Phase 6 simulation period from 1985 to 2011 will be developed, applied, and calibrated. o New calibration stations allowed by the expansion of the simulation period will be applied and calibrated. o Assessment in the changes that are due only to the change in the hydrology calibration will be quantified and documented. Reviewing and updating historical implementation data that has been submitted by the jurisdictions to the CBP partnership, confirming that BMPs are still in place and ensuring that accurate information is included in the modeling tools o Information on BMP implementation that is accurate as possible is integral to calibrating the Phase 6 Watershed Model; planning and reporting on future actions; using monitoring data to assess impacts of past efforts, since understanding the factors affecting observed trends in water quality requires a clear understanding of what actions have been implemented over time; and assessing the critical period of The WQGIT, STAR, the source sector workgroups, and the Modeling Workgroup have developed work plans to guide their efforts under each of the midpoint assessment priorities. Those work plans can be accessed here: Current Efforts & Gaps The Phase I, the Phase II WIPs, and two-year milestones include descriptions of efforts currently underway or planned to improve tracking, reporting, and assessing the effectiveness of implementation actions. EPA, the Bay watershed jurisdictions, local governments, the private sector, and nongovernmental organizations will use these data to inform accountability and adaptive decision-making, and redirect management actions and resources. Specific efforts include the use of the National Environmental Information Exchange Network (NEIEN) to seamlessly exchange information between existing federal, State, or District databases and the suite of CBP decision support tools. Tracking data and models will be used, along with ambient monitoring data, to assess WIP and milestone commitments and progress. The WIPs also evaluate the currently legal, regulatory, programmatic, financial, staffing, and technical capacity to deliver the implementation of reductions sufficient to achieve the target loads in the Bay TMDL. As part of their evaluation, the Bay watershed jurisdictions considered whether additional reductions could be achieved with existing capacity (funding, authorities and sustainability). The evaluation of existing capacity includes programs and rules, a comprehensive assessment of current point source permitting/treatment upgrade schedules and funding programs, nonpoint source control funding, existing permitting and incentivebased programs and regulations. The jurisdictions identified gaps between their current capacity and the capacity they estimate is necessary to fully attain the interim and final nutrient and sediment target loads for each of the 92 segments of the Bay TMDL. Necessary new capacity includes additional incentives, new or enhanced state or local regulatory 6
7 programs, market-based tools, technical or financial assistance, and new legislative authorities. It also includes capacity from other federal agencies, local governments, the private sector, and/or non-governmental organizations. The Bay watershed jurisdictions are expected to discuss plans to work with federal, local, private sector, and nonprofit partners to leverage capacity for achieving interim and final load targets. The WIPs identify contingency strategies in the event that actions by those partners, or by the jurisdictions, do not occur. For example, if an enhanced cost-share program does not yield adequate participation and compliance rates, a jurisdiction might pursue the development of enhanced authorities or new regulations to control loadings from that same source sector or another source sector. The Bay watershed jurisdictions are now focused on implementation of management practices identified in their WIPs and two-year milestones. Federal agencies also are focused on implementing their Executive Order strategies and two-year milestones. Some of the WIP commitments and contingencies include: Committing to more stringent nitrogen and phosphorus limits at wastewater treatment plants, including on the James River in Virginia. (Virginia, New York, Delaware, District of Columbia) Pursuing state legislation to fund wastewater treatment plant upgrades, urban stormwater management and agricultural programs. (Maryland, Virginia, West Virginia) Implementing a progressive stormwater permit to reduce pollution. (District of Columbia) Conservation districts throughout the Bay watershed will conduct farm visits to inform farmers of their regulatory requirements and help farmers identify ways they can improve conservation methods on their properties. (Pennsylvania) Investing in a Regional Agricultural Watershed Assessment Program to inspect farms and assist farmers in meeting their regulatory requirements for planning and installation of BMPs. (Pennsylvania) Committing to pollution reduction plans as part of the MS4 permitting process. (Pennsylvania) Considering implementation of mandatory programs for agriculture if pollution reductions fall behind schedule. (Delaware, Maryland, Virginia) Additional policies, programs, or actions include: Enforceable or otherwise binding commitments that controls will be, or are already being, implemented and maintained. Permits or contracts with quantifiable limits and milestones that the jurisdictions can demonstrate are consistent with the Bay TMDL s wasteload and load allocations. Estimates of the necessary resources (funds, technical assistance, permit reviewers, inspectors) to support implementation and maintenance of practices. Documentation of historic participation and compliance rates associated with existing programs and practices and successful nutrient and sediment management efforts. Management Approach The overall management approach needed for reducing nitrogen, phosphorus, and sediment are provided in the Bay TMDL, the Phase I and II WIPs, and the accountability framework, which is described in the Bay TMDL and Executive Order The Bay watershed jurisdictions committed to meet the interim (2017) and final (2025) target loads for nutrients and sediment in the Bay through their respective WIPs. The final loads are expected to be sufficient to achieve the water quality standards in the Bay. The Bay TMDL is supported by a rigorous accountability framework to ensure cleanup commitments are established and met, including WIPs, short and long-term benchmarks (such as two-year milestones), a tracking and accountability system for jurisdictions activities, and federal contingency actions that may be employed if jurisdictions do not meet their milestone and WIP commitments. Federal agencies are directed by Executive Order to consult with the seven Bay watershed jurisdictions to ensure that federal actions to protect and restore the Chesapeake Bay are closely coordinated with those actions by state and local jurisdictions in the 7


8 watershed. The federal agencies have developed an Executive Order Strategy to outline ways to accomplish that goal. Although the accountability framework is not part of the Bay TMDL, Sections 7 and 10 of the TMDL document describe how the accountability framework helps provide reasonable assurance that the needed pollutant reductions will occur and how adaptive management can be used as a tool to implement those pollutant reductions within the accountability framework. As part of its efforts to carry out the Bay TMDL accountability framework, EPA interacts with the jurisdictions directly and through the WQGIT and its associated source sector workgroups. The WQGIT workgroups are focused on supporting the reduction of nitrogen, phosphorus, and sediment pollutant loads from key sources described in Section 4 of the Bay TMDL: wastewater, agriculture, urban storm water, septic systems, forests and air. EPA also works with the jurisdictions and the WQGIT on issues associated with two-year milestones, offsets, and water quality trading. The WQGIT is supported by the CBP Scientific, Technical, and Analysis (STAR) team, which contains the modeling and monitoring workgroups, and other Goal Implementation Teams, as necessary. The CBP partnership s models are used to assist the jurisdictions in assessing different options for management practices in the formulation of their WIPs and two-year milestone commitments. Monitoring Progress 2017 WIP Outcome Practices: Starting in 2010, the CBP partnership solicits BMP implementation data from the jurisdictions. The WQGIT Watershed Technical Workgroup is responsible for assisting jurisdictions in developing, understanding, and submitting data through the NEIEN system. EPA s reporting system, the Bay Tracking and Accounting System, or BayTAS, is used to track progress toward meeting Bay TMDL allocations. WQGIT members have been actively involved in the development of BayTAS. ChesapeakeStat 13 is a CBP partnership website that publicly shares information on indicators, strategies, and funding including the BayTAS data,
9 BMP implementation data reported through NEIEN and any other numerical data used for assessing progress towards CBP partnership water quality goals. The CBP partnership is working with the jurisdictions and federal partners to improve verification of reported nutrient and sediment controls. The WQGIT also adopted a protocol for reviewing the effectiveness of nutrient and sediment controls or BMPs based on an evaluation by expert panels and survey of the best available literature and data. These expert panels regarding the effectiveness of controls are underway in order to inform the CBP partnership as to whether it is appropriate/necessary to modify existing, or approve new, nutrient sediment controls and how the implementation of such those controls are accounted for by the CBP models. Modeled Loads: The CBP partners use a suite of computer models to project pollutant loads and flow. The CBP modeling framework is designed to address questions of how Chesapeake Bay water quality will respond to changes in watershed and airshed management actions, which can inform decision-making for reducing pollution and meeting applicable water quality standards. These modeling tools are also used to track and quantify nutrient and sediment loads as WIP implementation progress. The estimated modeled loads will be used to track progress with achieving the 2017 WIP outcome. USGS and the Modeling Workgroup are currently developing techniques to better compare modeled nutrient and sediment load data with that of monitored loads WIP Outcome Midpoint Assessment: In addition to assessing progress towards meeting the 2017 WIP outcome, the midpoint assessment will also include an evaluation of the current science to improve the implementation strategies in the Phase III WIPs. The midpoint assessment includes the enhancement of the modeling tools by the CBP partners, led by the Modeling Workgroup, to incorporate the latest science. Specifically, the Modeling Workgroup is charged with revising the watershed modeling system structure to improve transparency, accuracy, and confidence. Improved accuracy, in particular, encompasses the incorporation of more refined local land use data. Water Quality Standards Attainment & Monitoring Outcome The CBP has extensive tidal and nontidal monitoring networks, which are used to (1) measure nitrogen, phosphorus, and sediment in the watershed; (2) assess conditions in tidal waters relative to established waterquality standards; and (3) evaluate tidal habitat conditions and living resource populations and health. In addition, two types of air deposition are monitored daily and tracked through the CBP models. The first is wet deposition, which occurs during precipitation events and contributes only to nitrogen loads during days of rain or snow. The other is dry deposition, which occurs continuously and is input at a constant rate daily into the Bay Watershed and Bay Water Quality models. The CBP partnership also has a basinwide reporting process for tracking implementation of management practices. Many of these monitoring and assessment activities are coordinated through and provided by the CBP s STAR team and partner science entities. The CBP partnership, through the Scientific and Technical Advisory Committee (STAC), conducted a review of its monitoring programs in 2009 to better align efforts with the implementation of the Bay TMDL and WIPs and plans for future evaluation to determine if changes in the monitoring programs are needed and to address the goal teams needs. Findings from this 2009 review will be used to improve CBP model simulations to inform the development of the Bay jurisdictions Phase III WIPs by STAR is working with the WQGIT to develop an approach to integrate three key pieces of related water quality information to better assess and communicate progress toward the Bay TMDL and associated water quality standards including: 9
10 Reductions of nitrogen, phosphorus, and sediment by source, jurisdiction, and overall load reduction associated with the implementation of BMPs. These load reductions are estimates from the CBP models based on BMP implementation data submitted by the jurisdictions. Changes of in-stream nitrogen, phosphorus, and sediment concentrations and loads as estimated by flowadjusted trends of nitrogen, phosphorus, and sediment. These estimates show long-term (25 year) and shorter term (10 year) changes by normalizing the annual effects of streamflow variability. The normalized estimates are based on monitoring data collected as part of the CBP nontidal water quality monitoring program. Attainment of Chesapeake water quality standards for dissolved oxygen, chlorophyll-a, water clarity/sav standards. Attainment of these standards is based primarily on results from the CBP tidal water quality monitoring program. The WQGIT and STAR also are enhancing the monitoring and analysis to address the factors affecting annual loads, responses in living resources, and efforts underway to improve monitoring programs, including: Water Quality Monitoring System understanding: The CBP partnership conducts annual monitoring of river flow to the Bay to help explain yearly changes in DO, clarity/sav, and chlorophyll-a conditions. Living resources monitoring is used to assess changes in populations of lower trophic levels (SAV and invertebrates) and fisheries (crabs, oysters, and selected finfish species) that are dependent on habitat conditions. The CBP nontidal water quality monitoring program monitors nutrient and sediment at 125 sites in the watershed to help document and understand the factors affecting the response to management practices. The WQGIT and STAR intend to: o Enhance analysis of tidal monitoring data to assess progress toward water quality standards. o Expand the small watershed monitoring network and assessment of data to better evaluate BMP efficiency. o Monitor of shallow groundwater to understand the effect of septic systems on water quality. o Consider monitoring of shallow groundwater to better understand contribution to surface-water loads and response time between BMP implementation and water quality improvements. o Conduct an analysis of water quality changes to better understand and explain the factors affecting water quality response to BMPs and report findings. This analysis will evaluate how nutrient and sediment transport cause lag times between implementing practices and water quality changes. This analysis will build on the USGS report on lessons learned about water quality improvements (2014 New Insights report). Monitored Loads and Trends: The CBP partners and USGS operate the River-Input Stations to monitor and help assess annual loads of nitrogen, phosphorus, and sediment to the Bay which are used to explain changes in estuary water quality conditions. New techniques are being developed to improve comparison between the nitrogen, phosphorus, and sediment load data collected from the monitoring stations to TMDL allocations, which were established using the modeling tools. These techniques will be implemented at additional sites in the CBP nontidal network were possible. Assessing Progress The CBP accountability framework provides the foundation to assess performance toward the TMDL and associated water quality standards. The CBP partnership would be consulted on any proposed changes to the WIP Planning Targets, which provide for the watershed-wide distribution of load reductions. This is separate from any nitrogen-phosphorus and/or cross-basin exchanges within a state, which are the responsibility of that jurisdiction. Enhanced knowledge of management practices and their effects will be used primarily to refine individual jurisdiction strategies to achieve the 2017 and 2025 goals WIP Outcome 10
11 EPA will assess the jurisdictions progress toward reaching the Bay TMDL s ultimate nitrogen, phosphorus, and sediment reduction goals at least biennially using against the jurisdictions two-year milestones commitments. Every two years, the jurisdictions are expected to identify and commit to implement specific pollutantreduction controls and actions in each of their successive 2-year milestone periods. Under the Executive Order, the federal government also has been committing to two-year milestones. EPA will measure progress towards achieving the 2017 and 2025 WIP outcomes annually by running implementation data collected from the jurisdictions through the partnership s modeling tools. When assessing two-year milestone commitments, EPA evaluates whether proposed actions, controls, and practices would result in estimated loads at the jurisdiction scale that will put the jurisdiction on track towards meeting its 2017 and 2025 goals. EPA uses the reported BMP data and the Chesapeake Bay Watershed Model to assess the jurisdictions progress towards meeting the target allocations. EPA also assesses the jurisdictions and Federal Agencies progress towards meeting its programmatic milestones (e.g., promulgation of new laws, implementation of regulations, policy development, permit issuance, compliance and enforcement commitments, etc.) at least biennially WIP Outcome As part of the midpoint assessment, EPA will be evaluating the progress towards meeting the 2017 and 2025 goals established in the Bay TMDL. The CBP partnership will use this midpoint assessment of progress to determine if the 2017 WIP outcome in this management strategy has been achieved. This midpoint assessment not only encompasses a review of the implementation of the partners WIPs and milestones but also water quality monitoring, modeling and decision-support tools utilized by the CBP partnership. The intent is that this assessment will strengthen and enhance the partnership's decision support capabilities used to develop the implementation plans and strategies in Phase III for meeting our shared objective in restoring the Chesapeake Bay. Water Quality Standards Attainment and Monitoring Outcome The CBP partnership will enhance the analysis and explanation of monitoring information as part of the Bay TMDL s midpoint assessment. The CBP partners have endorsed (PSC, May 2012) an integrated approach that includes three primary pieces of information to measure progress toward water quality standards: Reporting of water quality management practices. Analyzing trends of nitrogen, phosphorus and sediment in the watershed. Assessing attainment of dissolved oxygen, chlorophyll, and water clarity/sav standards. The integrated approach to quantify and explain water-quality trends in the Bay and its watershed relies on monitoring information, enhanced BMP implementation data, and use of several analytical tools (including statistical tools, CBP Watershed Model and estuary models, USGS SPARROW model, and groundwater models). The following activities will be coordinated through the CBP STAR team and interaction with the WQGIT: Analyze water-quality trends in the Bay and its watershed. Explain the factors affecting water-quality trends in Bay and its watershed. Enhance CBP models using the improved understanding of trends. Inform management strategies to improve water quality. Adaptively Manage In a dynamic environment like the Bay watershed, changes during the next 15 years are inevitable. It may be possible to accommodate those changes within the existing Bay TMDL framework without the need to revise it in whole, or in part. The CBP partnership has committed to take an adaptive management approach to the Bay TMDL and incorporate new scientific understandings into the implementation planning in 2-year milestones and in Phase III following the midpoint assessment. Future adjustments to WIPs and two-year milestones based on 11
12 changing conditions and the availability of new information is consistent with the CBP s concept of adaptive management. The CBP partnership will continue to examine the following questions to address implementation challenges and opportunities, incorporate new data and scientific understandings, and refine decision support tools and management strategies toward the achievement of the water quality outcomes in the 2014 Chesapeake Bay Watershed Agreement: What progress had been made in implementing practices for the Bay TMDL? What are the changes in water quality and progress toward applicable water quality standards? What are we learning about the factors affecting water-quality changes to better implement practices? What improvements are needed in decision support tools, monitoring, and science? How do we best consider the combined impacts of land change and climate variability (storm events and long-term change) on nutrient and sediment loading and implications for the TMDL? Biennial Workplan In 2008, the Chesapeake Executive Council charged the seven Bay watershed jurisdictions to develop a twoyear milestone process for reducing their respective nitrogen, phosphorus, and sediment contributions to the Chesapeake Bay and to track the pace of those reductions. Two-year milestones are short-term objectives under the Bay TMDL accountability framework used to assess progress towards restoration goals while allowing jurisdictions to flexibly adapt their WIPs to meet those goals. The two-year milestones will serve as the biennial workplan for this management strategy as they represent key check-in points on the way to having all pollution reduction measures in place by 2025 to restore the Bay and its tidal waters, with controls in place by 2017 that would achieve 60 percent of the necessary reductions. The Bay jurisdictions milestones are expected to reduce phosphorus by nearly 2.4 million pounds and decrease sediment by more than 1.1 billion pounds by the end of 2015, compared to the 2009 baseline. The jurisdictions milestones are expected to reduce nitrogen by nearly 25 million pounds, but an additional reduction of nearly 6 million pounds is needed to remain on track to meet the 2017 target 14.The Bay jurisdictions two-year milestones and EPA s evaluations of these commitments and assessment of progress can be accessed here: This management strategy will be updated as these evaluations occur
13 13