Life Cycle Assessment as a support tool for bioenergy policy. Dr. Miguel Brandão
|
|
|
- Gavin Davis
- 5 years ago
- Views:
Transcription

1 Life Cycle Assessment as a support tool for bioenergy policy Dr. Miguel Brandão
2 Outline: Applying LCA for quantifying the climate effects of bioenergy Urgent need for replacing fossil fuels in order to mitigate climate change; bioenergy systems promising strategy Life Cycle Assessment as a decision-support tool for bioenergy Quantified benefits of bioenergy systems very variable and depend on methodological choices Unresolved methodological issues inthe LCA of bioenergy systems Insights and Prospects: LCA s uncertainty and relevance
3 Counter-intuitive lessons from hard systems analysis What s better? - Composting vs Incineration - Reusable nappies vs Disposable nappies - Recycled bags vs Plastic bags - Recycled paper vs Virgin paper - Organic food vs Conventional food - Local food vs Imported food - Biofuels/bioenergy vs Fossil fuels


4 The Life Cycle concept: a systems approach Manufacturing and Retail Use Resource Extraction and Processing Source: EC-JRC Goods and Services Re-use, Recycling, Energy Recovery, Disposal


5 Life Cycle Thinking and Assessment Resources Health and Environment Energy Climate Change Material Scarcity Eutrophication Land Use Source: EC-JRC Toxic Pressures
 weighting Human Health Natural environment Natural resources Area of Protection weighting Midpoints")
6 Toxicity Radiation Carcinogens Environmental mechanism (impact pathway) Respiratory inorganics Summer smog Ozone layer Acidification Eutrophication Ecotoxicity Climate change Land-use Resource depletion Aggregation to single score indicator Single indicator (overall environmental impact ) weighting Human Health Natural environment Natural resources Area of Protection weighting Midpoints NOx, Cd, CO 2, CH 4, dioxins, energy, coal, silver ore, land use and other emissions and resource flows... Inventory


7 Environmental impacts for different treatment options for MSW Source: JRC, 2008
8 Necessity of Life Cycle Thinking in Policy and Business Avoid shifting-of-burdens from one stage to another in product life-cycles among countries, to/from outside EU across different environmental and health impacts and resources use from one generation to the next Fair basis for comparisons holistic assessments equivalent functionality

9 Is bioenergy carbon neutral? Source: IEA Bioenergy Task 38

10 Not carbon neutral because Life cycle emissions Non-CO2 GHGs C-stock change ILUC Albedo Source: IEA Bioenergy Task 38

11 Source: Schlamadinger et al in IEA Bioenergy Task 38
12 LCA methodology in Renewable Energies Directive
13 Typical and default values for biofuels Biofuel producion pathway Typical greenhouse gas emission saving (%) Default greenhouse gas emission saving Sugar beet ethanol Wheat ethanol Corn (maize) ethanol Sugar cane ethanol Rape seed biodiesel Sunflower biodiesel Soybean biodiesel Palm oil biodiesel Pure vegetabe oil from rape seed Source: European Commission Renewable Energies Directive (2009)
 Bioenergy.")
14 Large variability in published GHG emissions for bioenergy Source: Chum et al. (2011) Bioenergy. In IPCC Special Report on Renewable Energy Sources and Climate Change Mitigation
15 Unresolved Issues System modelling approaches: attributional and consequential Handling co-production: allocation or substitution Reference systems baseline land use indirect Land Use Change (ILUC) associated carbon flows Climate change metrics: Biogenic Carbon and time accounting
16 Attributional and consequential modelling UNEP/SETAC (2011). Shonan LCA database guidance principles: Attributional approach: System modelling approach in which inputs and outputs are attributed to the functional unit of a product system by linking and/or partitioning the unit processes of the system according to a normative rule. Consequential approach: System modelling approach in which activities in a product system are linked so that activities are included in the product system to the extent that they are expected to change as a consequence of a change in demand for the functional unit.
17 Attributional and consequential modelling Attributional Consequential Source: Weidema (2003)
18 Bioenergy and GHG Accounting: Reference system Sources of Energy Remarks Scenario for meeting energy demand Fossil Feedstocks Natural Ecosystems Managed Land Under-utilised Resources (e.g. land) Status quo + 1 Climate Change Deforestation Climate Change Diversion (no compensation) Diversion (with compensation; iluc) = 0 Food Security = 0 Climate Change Diversion (with compensation; Intensification Additional biomass growth (C sequestration) Carbon Capture and Storage +1-1= = 0 Climate Change BECCS (Bioenergy with CCS) = = 0 Efficient resource use
 Source: Brandão")
19 Indirect land use change (ILUC) Source: Brandão (2008)
20 Are models suitable for determining ILUC factors? Source: Berndes, G., Bird, N. & Cowie, A., Bioenergy, land use change and climate change mitigation. Background Technical Report, Paris: International Energy Agency (IEA).

21 Are models suitable for determining ILUC factors? Source: Valin et al. 2015
22 When the new ILUC proposal was launched on 17 October 2012, EU Climate Commissioner Connie Hedegaard said that some biofuels currently receiving EU subsidies were as bad as, or even worse than the fossil fuels that they replace.
23 Estimated indirect land use change emissions from biofuels Cereals and other starch rich crops 12 g CO2-eq./MJ Sugars 13 g CO2-eq./MJ Oil crops 55 g CO2-eq/MJ Fossil fuel comparator 83.8 g CO2-eq./MJ (2008) 2012: 90.7 for diesel 2012: 89.2 for gasoline 2012: 90.3 for weighted average (3:1)
24 EC Default values + iluc factors Palm Oil 105 g CO 2 -eq./mj Soybean 103 g CO 2 -eq./mj Rapeseed 95 g CO 2 -eq./mj Sunflower 86 g CO 2 -eq./mj Palm Oil with methane capture 83 g CO 2 -eq./mj Wheat (process fuel not specified) 64 g CO 2 -eq./mj Wheat (as process fuel natural gas used in CHP) 47 g CO 2 -eq./mj Corn (Maize) 43 g CO 2 -eq./mj Sugar Cane 36 g CO 2 -eq./mj Sugar Beet 34 g CO 2 -eq./mj Wheat (straw as process fuel in CHP plants) 35 g CO 2 -eq./mj 2G Ethanol (land-using) 32 g CO 2 -eq./mj 2G Biodiesel (land-using) 21 g CO 2 -eq./mj 2G Ethanol (non-land using) 9 g CO 2 -eq./mj 2G Biodiesel (non-land using) 9 g CO 2 -eq./mj No GHG saving! <35% GHG saving 35-50% GHG saving 50-60% GHG saving >60% GHG saving

25 Precision vs. Accuracy Source: Brandão et al. (2014) The Use of Life Cycle Assessment in the Support of Robust (Climate) Policy Making. Journal of Industrial Ecology High Precision Low Accuracy Biased results HighAccuracy Low Precision Representative Results It is much more important to be able to survey the set of possible systems approximately than to examine the wrong system exactly. It is better to be approximately right than precisely wrong. Tribus and El-Sayed (1982)
26 Outlook: LCA for decision support LCAs relevance for policy support growing Several international developments and ongoing initiatives Better methods, databases, software Lack of consensus Increasing harmonisation needed in LCA practice Need for integrating with economic (and social) results to inform the design of policy instruments LCA of biobioenergy systems Methodological choices in LCA determine results Delimitation of system boundary and indirect effects important All models are wrong, some are useful Not all bioenergy systems are created equal Biomass/biofuels not necessarily better Helps us in identifying the best and worst offenders Bioenergy may still play a role inmitigating climate change Message for policy makers: promote the good system, discourage the bad and ugly Non-shifting of burdens
27 Thank you
28 Policy implications for iluc estimations by economic-equilibrium modelling Does the modelling provide a good basis for determining the significance of iluc? Are the impacts significant? Can we differentiate between bioethanol/biodiesel, feedstocks, geographical areas and production methods? iluc effect is significant and crop-specific EC Directives ineffective iluc factor to crop-specific biofuels
29 Food, feed, fuel, timber or carbon sink? Optimal land-use strategies Current Cropland Set-Aside Permanent Grassland
30 Why apply economic-equilibrium models? To estimate how a sector balances To estimate how an economy balances To estimate how the whole world balances This is important because it avoids the shifting of burdens in the form of indirect and rebound effects!
31 How and why do model results differ (Monforti, 2011)? LUC effects vary considerably across feedstocks For the same feedstock, models differ in terms of LUC [ha/toe] according to: How much area increases compared to yield (IFPRI has higher ILUC savings from yield increases) Marginal yield How much crops are made available by reduced food and feed consumption To what extent crop production is shifted to countries with lower yield How by-products are accounted for (LEITAP has much lower ILUC savings from by-products)
32 Critical issues in iluc modelling 1. GHG emissions from LUC Land requirements Reference system 2. Ascribing LUC to their drivers Amortisation 3. Dealing with modelling uncertainties Treatment of by- products intensification vs. expansion vs. displacement

33 Crop displacement (Edwards et al. 2010)
34 Carbon stocks in UK t C / ha Above-Ground Biomass Dead Organic Matter Soils 50 0 Forest Grassland Annual Cropland Organic Cropland Set-Aside Perennial Cropland Source: : Azeez (2009), IPCC (2003; 2006)
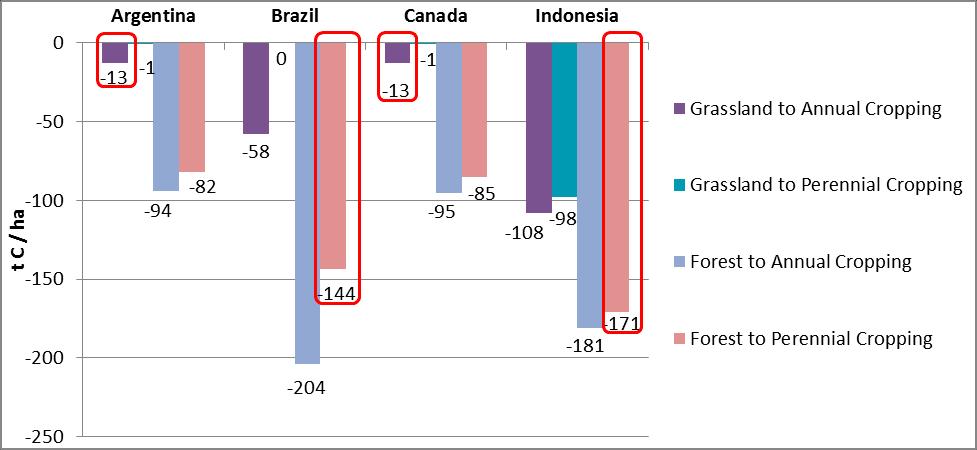
35 Implications of choice