Onsite Septic System Nitrogen Contributions to the Hood Canal Estuary. Department of Civil and Environmental Engineering, University of Washington
|
|
|
- Nora Lester
- 5 years ago
- Views:
Transcription

1 Onsite Septic System Nitrogen Contributions to the Hood Canal Estuary Michael Brett, Peter Steinberg, Julie Horowitz, Bryan Atieh, Garrett Leque, and Mark Benjamin Department of Civil and Environmental Engineering, University of Washington
2

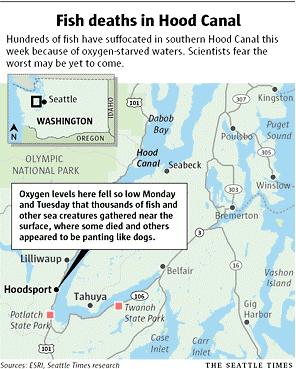
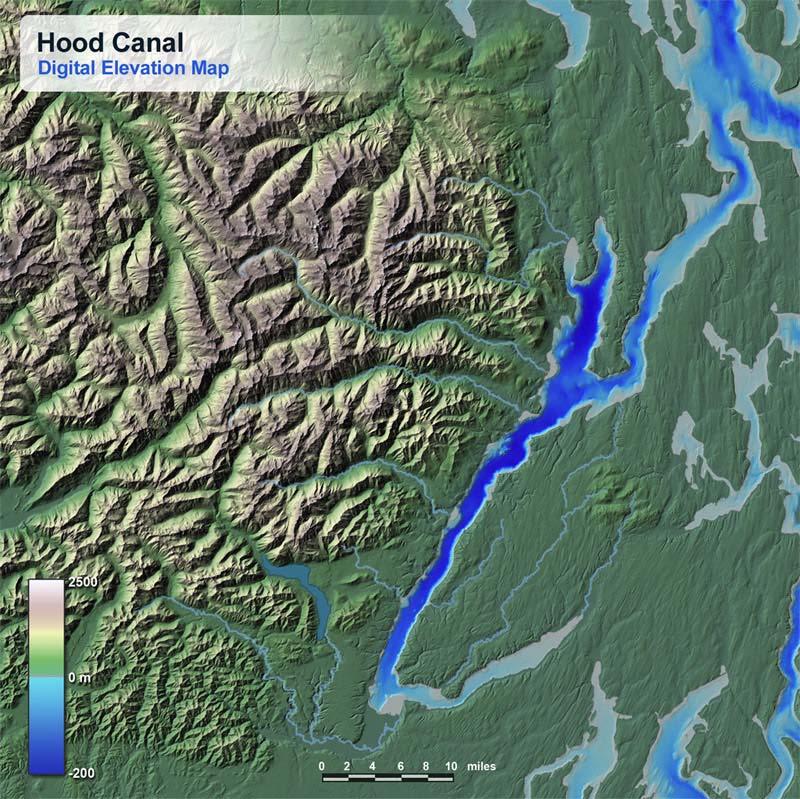
3 Hood Canal, Washington, USA


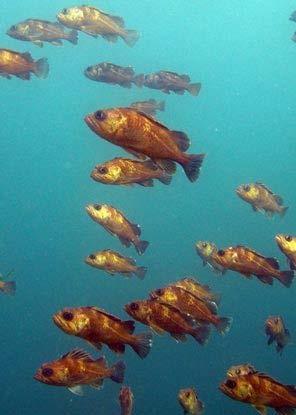
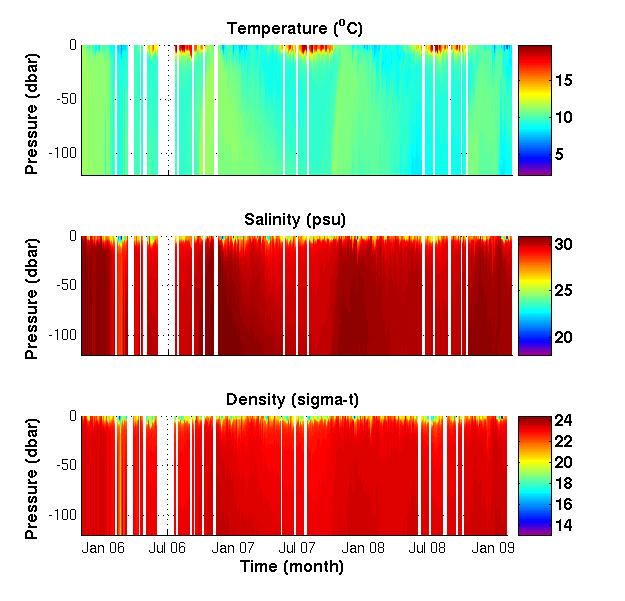
4 Effects of low dissolved oxygen Eutrophication: excess nutrients stimulating excess plant growth Hypoxia: Dissolved oxygen below ~2mg/L Anoxia: Dissolved oxygen below ~1mg/L


5 , pet waste, lawns Newton, UW-APL


6

7 PART 1: OSS Impacts on watershed N export

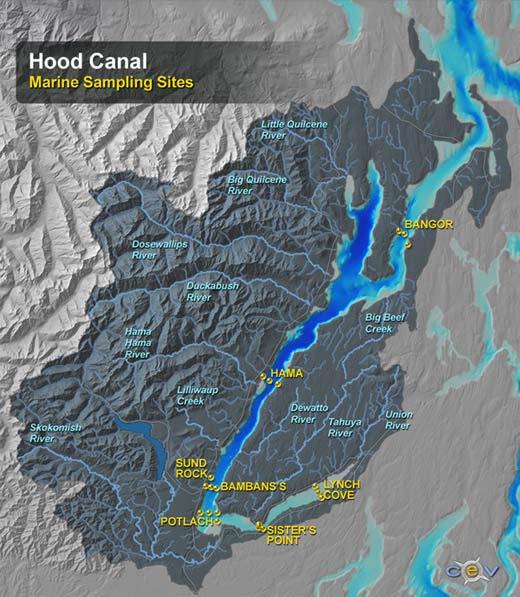
8 Influence of Catchment Characteristics on Stream Nitrogen Transport to the Hood Canal
 Results -Seasonal variation in N loads/concentrations -Land cover effects on load/concentrations -Discharge effects on")
9 General Watershed Characteristics -Hydrology -Land Cover Outline Study Objectives -Estimate freshwater N loads (possible cause of Hood Canal hypoxia) Results -Seasonal variation in N loads/concentrations -Land cover effects on load/concentrations -Discharge effects on load/concentrations
10 The upper left panel (A) shows average monthly TDN concentrations in the ten catchments with the highest proportion deciduous mixed forest. The upper right panel (B) shows the TDN concentrations in the ten catchments with the most mature coniferous forest. The lower left panel (C) shows average TDN concentrations in the ten most densely populated catchments. The lower right panel (D) shows TDN concentrations in the ten least densely populated catchments.


11
12 TDN concentration (µg/l) Mainstem Hood Canal Lynch Cove TDN Flow Flow (m 3 /s) TDN Export (tonnes/month) Oct N o v Dec Jan Feb Mar Apr May June July A u g Sept Oct Oct Nov Dec Jan Feb Mar Apr May June July Aug Sept Oct Oct N o v Dec Jan Feb Mar Apr May June July A u g Sept Oct Total Alders Humans Background 0 Oct Nov Dec Jan Feb Mar Apr May June July Aug Sept Oct Figure 4. The average monthly time series for the TDN concentrations and stream flow (upper panels) and TDN export (lower panels) for the mainstem Hood Canal (left panels) and Lynch Cove region (right panels) of this estuary. The error bars presented for the TDN concentrations are ± 1 SD. The various curves presented in the loading panels represent total TDN export to the euphotic zone of the estuary, and partial TDN loadings attributable to red alders, humans and natural background conditions according to the regression model presented in Table 6.
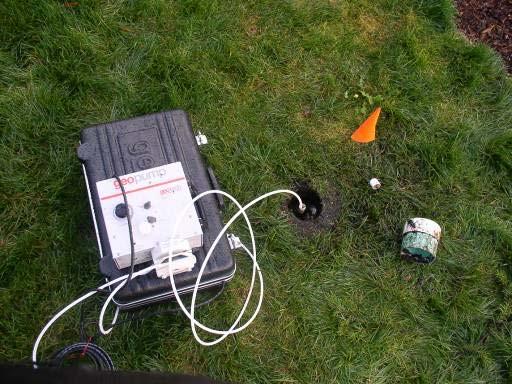

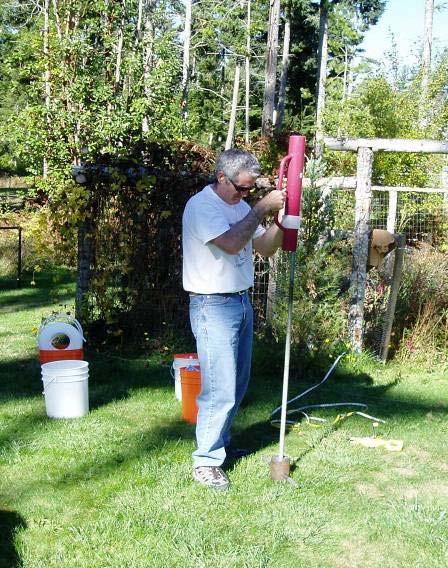

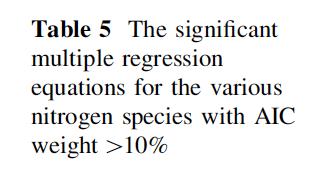
13 Well Installation and Sampling

14 Total Nitrogen (mg/l N) Septic Tank Well Tap Background 10 % 30 % 50 % 70 % 90 % Chloride (mg/l Cl) 0.45 Probability Mason Probability < Percent Removal of TN Mason 2 N removal < Percent Removal of TN
15 Mason 10
16 Concentrations of NO 3 - and NH 4 + over time Well T1 NO3 and NH4 (mg/l) NO3 NH4 R 2 = 0.86 R 2 = Time since initiation (Hours)
17 800 y = -1045x r 2 = DIN conc. (µg/l) Iodide (mg/l) 4 A 60 Tidal magnitude (m) Well level (cm) Days 0
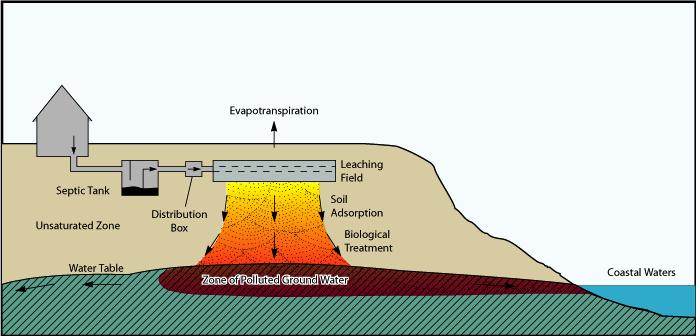
18 Part 1 Conclusions: Approximately, 50% of OSS N discharges ultimately find their way into Hood Canal These N discharges considerably enrich stream water N concentrations in some catchments At the watershed scale OSS N discharges have an important impact on stream chemistry Nitrogen export from the watershed predominantly occurs during the months of Nov-Dec (> 60% of total export) because this is when the highest stream flows (8X over summer base flows) and the highest stream concentrations (2X over summer) occur. Conversely, only 15% of DIN export occurs during the critical summer/late fall period of Jun-Oct

19 PART 2: OSS N impacts on Hood canal
20 Q SF = Q UP + Q FW, and Q SF * S SF = Q UP * S UP + Q FW *S FW, where S SF, S UP and S FW are the salinities of the surface layer, upwelling water and freshwater inputs, respectively. Using data on S UP, S FW and Q FW, we solved these equations for the upwelling flow (Q UP ) accordingly: Q UP = " # $ Q FW. S UP %! 1 S SF & '
21 Watershed Q = 146 m 3 /s C TDN = 152 µg/l L DIN = 699 MT/yr Precipitation Q = 23 m 3 /s C DIN = 68 µg/l L DIN = 50 MT/yr Dry Fallout L DIN = 2.6 MT/yr Outflow Q = 3230 m 3 /s S = 28.5 ppt Marine Upwelling Q = 3061 m 3 /s S = 30.1 ppt C DIN = 400 µg/l L DIN = 39,075 MT/yr Surface layer is 95% salt water N loading to the surface layer is 98% marine
22
23
24 Mean Diss. O 2 (mg L -1 ) Residual Diss. O 2 (mg L -1 ) A B North Ducka Hoods Twanoh Improving O 2 & increasing watershed DIN export Jan Feb Mar Apr Residual Diss. O 2 (mg L -1 ) May Jun Jul Aug Sep Oct Nov Dec C y = x r 2 = 0.47 Jan_05 Mar_05 May_05 Jul_05 Sep_05 Nov_05 Jan_06 Mar_06 May_06 Jul_06 Sep_06 Nov_06 Jan_07 Mar_07 May_07 Jul_07 Sep_07 Nov_07 Jan_08 Mar_08 May_08 Jul_08 Sep_08 Nov_08 Jan_09 Mar_09 May_09 Jul_09 Sep_09 Nov_09
25 Marine Upwelling (m 3 /s) Upwelling Residual Diss. O 2 (mg/l) 0 O 2 residual Sep Oct Nov Dec Jan Feb Mar Apr May Jun Jul Aug Sep -1.5
26
27 80 vs 500 µg/l from watershed into Hood Canal Worst case scenario = 0.5 mg L -1 O 2 loss But actual DIN inputs average 150 not 500 µg L -1 ; and most of the extra N is from red Alders not OSSs
28 Mean Diss. O 2 (mg L -1 ) Residual Diss. O 2 (mg L -1 ) A B North Ducka Hoods Twanoh Jan Feb Mar Apr May Residual Diss. O 2 (mg L -1 ) Jun Jul Aug Sep Oct Nov Dec C y = x r 2 = 0.47 O 2 increased 1 mg L -1 without intervention Jan_05 Mar_05 May_05 Jul_05 Sep_05 Nov_05 Jan_06 Mar_06 May_06 Jul_06 Sep_06 Nov_06 Jan_07 Mar_07 May_07 Jul_07 Sep_07 Nov_07 Jan_08 Mar_08 May_08 Jul_08 Sep_08 Nov_08 Jan_09 Mar_09 May_09 Jul_09 Sep_09 Nov_09
29

30 1 versus 0.1 mg/l 90% versus 99% natural
31 0.1 mg/l State Standard 1 mg/l
32
33
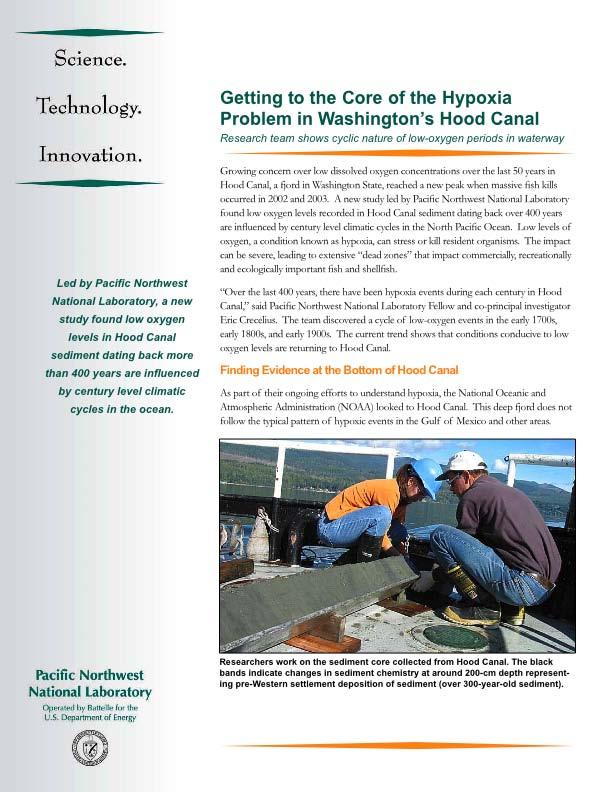
34 Part 2 Conclusions: Although 50% of the N discharged to OSSs ultimately makes its way into Hood Canal, this nutrient source is a very small portion (< 0.5%) the overall marine dominated N flux. Further, watershed N exports primarily occurs during the time of year where O 2 concentrations are rapidly improving, i.e., the late fall/early winter. Sediment cores show hypoxia is the natural state of this estuary, and O 2 concentrations were historically lower prior to European settlement of the watershed. A mechanistic model suggests OSS N at most causes a depression of 0.2 mg O 2 L -1 during the worst time and place in Hood Canal. Long time scale climatological phenomena may exert a strong influence on oxygen concentrations in this estuary. There is still a debate amongst the various scientists studying this system as to whether the human impact on deep water oxygen concentrations is 0.1 or 1.0 mg O 2 L -1 (in other words 90% of the hypoxia is natural)
35 Outstanding issues: Different ways of and assumptions for estimating marine contributions to Hypoxia. (3X) Different methods for estimating OSS N export from unsampled nearshore areas. (5X) Different ways of calculating DO loss between the mainstem and Lynch Cove. (2X) Spatial quandaries - how does low DO water get to where the fish kills occur? (20 km)

36 Thank you! The Hood Canal Onsite Septic System Nitrogen Loading Project was supported by the Puget Soun Partnership. Special thanks to the Technical Advisory Committee, the Hood Canal Dissolved Oxygen Program, and all the project participants.