Controlling Trihalomethanes and the Costs Associated with their Minimization using Automated On-Line Monitoring with the THM-RR system
|
|
|
- Maximillian Fitzgerald
- 5 years ago
- Views:
Transcription

1 Controlling Trihalomethanes and the Costs Associated with their Minimization using Automated On-Line Monitoring with the THM-RR system Gary L. Emmert Professor and Chair Department of Chemistry
2 The THMs include: chloroform (CHCl 3 ) bromodichloromethane (CHBrCl 2 ) chlorodibromomethane (CHBr 2 Cl) bromoform (CHBr 3 ). Total concentration of THMs should not exceed the maximum contaminant level (MCL) of mg/l Are THMs violations a problem for WTPs? 2

3 Legal Violations for HAAs across the United States 3
4 Options for Daily Process Control Strategies In House Laboratories Contract Labs On-Site process control options 4
5 Contrasting In-House and Contract Laboratories Investment/maintenance expensive instrumentation. Need to hire skilled analysts Outsourcing the analysis provides the data needed to demonstrate compliance with USEPA regulations. Data analysis done by specialized experts who have the skills required by these methods. 5
6 Disadvantages of Contract Laboratories for THMs Expensive to accomplish daily process control Sample turnaround times are too long a few days to several weeks, even with expedited services Data provided after this much time is hardly useful to operators for responding in real-time to problems as they arise. 6
7 Need a THMs meter allows for a real-time response proactive intervention control strategies optimized on the fly 7
8 Commercial devices aimed at on-site monitoring THMs Parker THMAnalyzer Multisensor Systems MS2000-SYS Aqua Metrology system Inficon Model CMS 5000 Foundation Instruments THM-Rapid Response 8

9 Commercialized Version of Capillary Membrane Sampling-Gas Chromatograph 9
 Methods for real-time measurement of THMs and HAAs in distribution systems Phase II.")
10 Water Research Foundation Project 2873 Emmert, G.L., Cao, G., Geme, G., Joshi, N. and Rahman, M. (2004) Methods for real-time measurement of THMs and HAAs in distribution systems. AWWARF and AWWA, Denver, CO. Emmert, G.L., Brown, M.A., Simone, P.S., Geme, G and Cao, G. (2007) Methods for real-time measurement of THMs and HAAs in distribution systems Phase II. AWWARF and AWWA, Denver, CO. 10


11 Capillary Membrane Sampling- Gas Chromatography Solid Peer-Reviewed Science


12 How does it work? The guts you never have to think about But what about the calculations? 12


13 Fully automated sampling, data collection and reporting 13
14 Establishing the On-Line/On-Site Monitoring Program at the Lebanon TN WTP 14
15 The City of Lebanon, TN WTP 12 MGD conventional system located next to the Cumberland River in Wilson County, TN Water drawn from the Cumberland River and PAC is added for taste and odor control and reduce DBP precursors The water then enters a mixing tank where polyaluminum chloride coagulant is added before transferring to flocculation chambers. The water passes through tube settlers before filtering through dual media gravity filters 15
16 Chlorine dosed on top of the filters to control bacteria growth in the media. Filtered water then disinfected with gaseous chlorine with blended phosphates added as a corrosion inhibitor After required contact time, the finished drinking water is pumped to sanitized reservoirs, water towers, and to the customers tap Utility maintains an active laboratory - common drinking water parameters are measured and logged each shift Also has an active flushing program in place. 16
17 Calibration and Linearity of THM-RR system Calibrated using a five point calibration curve Range of calibration curve is user adjustable to their specific needs Automatically calculated least squares fits typically exhibit correlation coefficients (r values) generally > 0.99 Ranges from 10 up to 50 µg/l individual THMs species and from 10 to 200 µg/l for Total THMs. 17
18 Detailed MDL, Accuracy, and Precision Measurements. THM4 species Absolute Error (µg/l) Relative Error (%) Method Detection Limits (µg/l) EPA Trad. Mean % recovery % R.S.D. CHCl CHBrCl CHBr 2 Cl CHBr Total THMs* Most rigorous set of peer-reviewed measurements on any commercial THMs system 18
19 How sensitive is the needle on the THMs Meter? Minimum Detectable Change 0.05 µg/l Minimum Quantifiable Change 0.14 µg/l Failure Rate well less than 2% of the time 19
20 Overview of Dataset Over 5239 measurements of individual and Total THMs concentrations 5238 instances of change between a given measurement and the next measurement in sequence 95.0% were detectable changes 86.5% of the measurements were quantifiable changes 20
21 Less than 2% of the measurements resulted in a failed analysis. Consider that an event such as an air bubble caught in the CMS device might cause a failed analysis. In practice, there were only two instances where more than two consecutive analyses were failures. Of these, the majority of instances appeared to correct themselves without user intervention before the next sample injection. 21
22 Side-by side comparison of THM-RR to USEPA 524. The agreement between the two methods was measured using two approaches. 1 st method Bias = experimental value true value Bias = (THM-RR) (USEPA 524.2) Average Bias between the two methods was 1.3 ± 1.1 µg/l Range was 2.5 to 0.4 µg/l. 22
23 2 nd approach - more rigorous Bland-Altman analysis Bias defined the same way as before in Bland-Altman analysis Bland-Altman Bias 1.3 ± 1.1 µg/l with 95% confidence interval of 2.0 to 0.6 µg/l Both approaches show THM-RR system agrees with USEPA to within ~2 µg/l mean unsigned error results also indicate differences of ~2 µg/l not averaging out the highs and lows 23
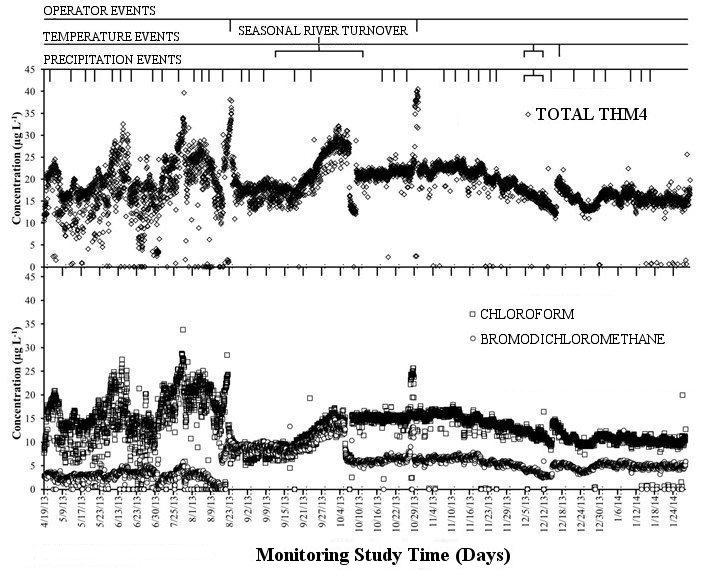
24 Process mapping Over the first week, no changes were made to the routine operating parameters of the plant. Process Mapping phase trends observed during normal operations. 24
25 During weekdays, at approximately 10:00 AM there was a sudden decrease in Total THMs concentration for several hours after which it would suddenly increase again These sudden drops were not present on weekend days. Coincided with dredging/dragging of the settling basin tanks 25
26 Once the normal behavior was mapped, operational changes could be made - effects from changes accurately determined Without a process map, optimization studies may or may not make sense, depending on the precise timing of sampling Without process mapping, results can be misleading or downright confusing 26
27 With the process map, sampling is precisely timed Results superimposed on the map can accurately and precisely evaluate the effect of a specific change on THMs formation Process mapping 1 st step toward true optimization of processes and the minimization and control of THMs concentrations 27
28 Process optimization The primary water treatment chemical used for taste and odor, TOC and THMs control at the Lebanon WTP is Norit Hydrodarco O, a commercially available PAC Over the course of the study, the concentration of PAC was varied and behavior of THMs monitored 28
29 During process mapping of the monitoring program (Days 1-7), the PAC dose concentration was 10 ppm On Day 8, the concentration of PAC dose was increased to 15 ppm No observable decrease in the Total THM concentration Marked decrease in the TOC concentration 29
30 Days PAC concentration dose increased to 20 ppm TOC of the finished water reduced further No observable decrease in Total THMs concentrations (in fact, appears to be a slight increase) 30

31 Finally - dose of chlorine on top of the filters applied to inhibit bacteriological growth was optimized Even with a reduction of PAC dose rates by a factor of two, THMs concentrations were minimized and stabilized at the plant. 31
32 Economic Considerations Comparing the PAC used from the 2/28/12 to 8/3/12 to the same time period in 2013 Demonstrated that the WTP used 15,300 lbs. less PAC in 2013 than in the same period in With PAC cost at $0.944/lbs., the actual savings over this time period was $14,
33 33
34 34
35 Amy Empirical Model for THMs Formation Total THMs (µg L 1 ) = (Literature) (DOC) 1.10 (D) (Br ) (T) 0.61 (ph) 1.60 (t)
36 Lebanon Calibrated Model for THMs Formation Total THMs (µg L 1 ) = (Lebanon Calibrated) (TOC) 1.31 (D) (T) (ph) (t) Predict Total THMs Concentrations to ± ~2 ppb! 36
37 Conclusions Detailed and rigorous MDL, accuracy and precision studies for the commercially available THM-RR system. Side-by-side comparison to USEPA Agrees to ~2 ppb THM-RR used to establish a program of on-line THMs monitoring and minimization at the City of Lebanon, TN with significant economic benefits Used THM-RR to calibrate and then develop site-specific empirical models for THMs formation. Provides two ways to be on top of THMs formation 37
38 Conclusions (continued) Process Mapping - monitor the baseline behavior of THMs in the distribution system Process Optimization - minimizing THMs by more efficiently applying treatment processes Accomplished Goal - Minimizing the use of PAC while maintaining acceptable taste and odor, total organic carbon (TOC) concentrations and stabilizing THMs concentrations 38
39 Bottom Line for Lebanon Water Treatment Plant Saved about $15K in PAC costs over a 5 month period Gained control of THMs maintained compliance throughout summer System run largely by typical water treatment operators supervised by Plant Manager 39
40 Rugged and Robust Instrument Capacity Factors had less than 1% error over 10 months. Peak Asymmetries ranged were very close to 1 with 1-4% error Monthly calibration provides errors on the order of ~ 5 µg/l Calibrate bi-weekly and the error drops by ~1/2 40


41 Acknowledgements Project 2873 NASA-EPSCoR Project NNX08AT67A 41
42 New work on HAAs supported by prestigious National Science Foundation-Small Business Initiative Research (NSF-SBIR) Grant 42