Economic Impacts of Sanitation in Cambodia
|
|
|
- Elvin Watson
- 5 years ago
- Views:
Transcription


1 Research Report February 2008 Economic Impacts of Sanitation in Cambodia A five-country study conducted in Cambodia, Indonesia, Lao PDR, the Philippines and Vietnam under the Economics of Sanitation Initiative (ESI) Public Disclosure Authorized Public Disclosure Authorized Public Disclosure Authorized Public Disclosure Authorized
2 THE WORLD BANK Jakarta Stock Exchange Building Tower II/12th Fl. Jl. Jend. Sudirman Kav Jakarta Tel: (6221) Fax: (6221) Printed in The volume is a product of World Bank staff and consultants. The findings, interpretations, and conclusions expressed herein do not necessarily reflect the views of the Board of Executive Directors of the World Bank or the governments they represent. The World Bank does not guarantee the accuracy of the data included in this work. The boundaries, colors, denominations, and other information shown on any map in this work do not imply any judgment on the part of the World Bank concerning the legal status of any territory or the endorsement of acceptance of such boundaries.
3 Economic Impacts of Sanitation in Cambodia A five-country study conducted in Cambodia, Indonesia, Lao PDR, the Philippines and Vietnam under the Economics of Sanitation Initiative (ESI) WSP-EAP Research Report February 2008
4
5 EXECUTIVE SUMMARY Executive Summary Until 2004, only about 17% of Cambodian people had access to improved sanitation meaning that there were still more than 11 million Cambodians living with an unimproved or no latrine. Although the figure given by the Cambodia Demographic and Health Survey (CDHS) in 2005 indicates the increase of access coverage to nearly 22% in 2005, it is estimated that about 204,000 people need to gain access each year to improved latrines if Cambodia is to achieve its Millennium Development Goal target of reducing by half in 2015 those without improved sanitation from a base year of Most of the people without improved sanitation (84%) are in rural areas which are home to more than 90% of the Cambodian poor. While there is a consensus that lack of access to clean water and improved sanitation has a variety of impacts, there is often a lack of evidence to affirm that poor sanitation imposes a significant burden on society. This in turn hampers the implementation of the required investments in the sanitation sector. In response, the Sanitation Impact study, initiated by the World Bank Water and Sanitation Program, aims to generate sound evidence on the negative impacts of existing sanitation conditions and the potential benefits of improvements in sanitation and hygiene in Cambodia. In this study, quantitative assessment of economic impacts of poor sanitation and hygiene on health, water resource, other welfare indicators, and tourism is conducted. The inclusion of health is based on the close links between sanitation and hygiene and disease incidence. Once the sanitation and hygiene related diseases occur, various costs will be generated such as health care cost, productivity cost, and, in more severe case, premature death. In addition, water resources are polluted by poor sanitation, with related economic costs. Among others, water pollution leads to costly avertive behavior in response to less usable water resources, and it affects the fish population. Other welfare impacts are evaluated in this study because the absence of sanitary facilities affects people in terms of the time spent accessing facilities which incurs some costs to the users, among other things. Last but not least, the inclusion of tourism in the study is also deemed important given the significance of this sector in Cambodia s economy, accounting for almost 15% of Gross Domestic Product (GDP) in Although hard to quantify, poor sanitation facilities and lack of hygienic conditions affect the country s attractiveness as a tourist destination. In addition to the quantitative evaluation, the study also discusses the effects of poor sanitation on various qualitative dimensions including health-related quality of life, intangible user preferences, life decisions, and the quality of the surrounding environment. Even though these qualitative impacts are not measurable monetarily, they do have implication on human welfare, for which populations may be willing to pay to avert. The study also presents some of the benefits of improved sanitation when impacts mentioned above are completely or partially eliminated. However, these benefits are not necessarily fully representative of the potential gains as other possible impacts are not included such as impacts on foreign direct investment, other sanitation and hygiene related diseases which are not included in the health impact assessment, and others. In the analysis, sanitation refers to activities related to human waste, which is the term used for human excreta. However, there are instances in which sanitation as it relates to gray water and solid waste are included. In measuring the impacts, the study uses a peer-reviewed methodology developed specifically for this study, which draws on established methods and, where these do not exist, develops new approaches to capture the impacts of poor sanitation. For improving policy interpretation of the results, the study distinguishes where possible between financial and economic impacts, and presents for rural/urban areas and different provincial groupings (zones). Overall, the study finds that poor sanitation leads to economic losses of US$448 million per year which translates into per capita loss of approximately US$32. These economic losses are equivalent to 7.2% of the Cambodia s GDP in This amount is roughly equivalent to the contribution of the fishery sector to the GDP, or twice the forestry s contribution. While these economic costs are not all tangible, the immediate money in the hand losses (financial losses) amount to about US$160 million per year, which is roughly 2.5% of the GDP, being equivalent to nearly US$12 1
6 EXECUTIVE SUMMARY per capita. These figures, however, exclude a number of other impacts, some of which are qualitatively assessed in the study, while others are omitted in the estimation. Economic loss of poor sanitation and hygiene (Total: 448 million US$) 16% 9% 42% Health costs Water costs Access time Tourism 33% In the economic cost estimation, it is found that health impact is the largest contributor of quantified costs. It amounts to US$187 million accounting for 42% of the total economic costs. The next main contributor of the quantified economic costs is the water costs attributed to the cost for accessing cleaner drinking water, the cost for accessing other domestic water uses, and the loss in fish production due to polluted water. According to the estimation, water costs share roughly one third of the total economic losses being nearly US$150 million. Moreover, the tourism sector which may be also affected by poor sanitation and hygiene practice in the country is also estimated to lose about US$74 million per year making 16% of the total costs. This loss is actually a result of under-exploitation of tourism capacity (below optimal capacity) and that the envisaged tourism growth is not achievable. The economic loss caused by the loss of time due to unimproved sanitation is roughly US$38 million being 9% of the total economic costs. This cost incurs among those who practice open defecation (journey time) and shared toilet users (waiting time). Economic losses by impacts Million US$ Health Water resource Access time Tourism Impact categories Tourism loss Access time Fish production Domestic water Drinking water Premature death Productivity Healthcare 2
7 EXECUTIVE SUMMARY While health cost is the main contributor to the total economic costs, the cost of premature death is estimated to be the biggest source of health costs which amounts to US$169 million annually contributing to more than 90% of the health impacts. This huge cost is due to the high number of deaths among children from diarrhea, and from diseases related to malnutrition which results from diarrhea. It is also noted that there are various methods for estimating value of human life which result in significantly different values. However, the technique used in this study the human capital approach is among the most conservative of estimation methodologies. Besides premature death, there are two other components of health costs making up total health cost. Cost of health care amounts to over US$13 million per year, including the costs of consultation, treatment, medicine, and transportation. Productivity cost, which refers to the productive time loss of patients both adults and children as well as their carers, amount to US$5 million per year. Three components make up the water costs which are access to clean drinking water, access to water for other domestic purposes, and fish production loss. Of the US$150 million of water access costs, accessing clean drinking water accounts for approximately 63%, while domestic water use (excluding drinking water) accounts for over 7%. Moreover, the cost due to lower fish catch affected by reduced levels of dissolved oxygen, part of which is attributed to poor sanitation, is about US$44 million accounting for nearly 30% of total water access costs. Tourism impacts are computed on the assumption that visitors to Cambodia are sensitive to sanitation conditions. Based on some crude assumptions, it is estimated that poor sanitation and hygiene leads to the tourism loss of about US$74 million being 7% of the tourism income in This cost is anticipated by the fact that the potential growth of tourism may not be fully achievable if sanitation and hygiene conditions in the country are not properly managed. This estimation, nevertheless, does not account for the sanitation and hygiene-related sickness, and welfare loss due to the sickness. The economic cost associated with time loss is estimated to be about US$38 million. While poor sanitation may explain the drop-out of school girls, the quantified cost of other welfare impacts does not include the loss that may be incurred by drop out from school which will influence career seeking and income levels in the future. Moreover, the fact that women may be absent from or not willing to go to work due to poor sanitation facilities is not accounted for. Also, there are other dimensions of welfare impacts (intangible user preferences) which are not quantified such as the issue of privacy, prestige, convenience, etc. It is highlighted in the study that hygiene and cleanliness are the main perceived benefits of most latrine users in Cambodia. These benefits are followed by comfort, health improvement, safety, convenience, privacy, and prestige. In terms of the impact of poor sanitation on environmental surrounding and related human welfare impacts, this impact is assessed by focusing on the problem of household solid waste. Based on literature sources and interviews with stakeholders, it is clear that solid waste in urban and rural areas of Cambodia is not yet properly handled. Although in some urban areas where the collection service is available, the scattering of waste in public places such as at markets and along the streets is still common. This practice damages the sight of the areas, and also produces bad odors to the people, affecting the welfare of the local people as well as attractiveness for tourists. Moreover, the designated dump site, particularly in Phnom Penh, is already operating at over capacity, thus impacting air pollution and water resources. Having estimated the impacts, the study also evaluated the benefits associated with improved sanitation and hygiene practices. Better hygiene practices and improvements in toilet systems were linked to a reduction in health costs, while improved physical access and treatment/disposal can reduce the other costs components. The results showed that improved hygiene practices such as hand washing can reduce health costs by approximately US$84 million. Improved physical access to sanitary toilets can reduce economic costs associated with time use by about US$38 million, and contribute US$0.3 million to input markets (latrine builders and materials). Improved toilet systems can reduce health costs by US$60 million and contribute to input market of US$1.2 million. Improvement in the treatment or disposal of waste has a large impact on water resources and tourism which can reduce costs totaling US$223 million where US$149 million is from mitigated water impacts and US$74 million is from tourism 3
8 EXECUTIVE SUMMARY gain. While the benefits from pursuing all the improvements will not necessarily lead to gains which are equal to the sum of the values above, the results nonetheless suggest that the gains can be significant. Hence the different sanitation options need to be examined in terms of what economic and financial benefits they have on health, water resources, the environment, other welfare, tourism, and local markets. For example, it is estimated that the benefits from sanitation market in terms of input and output market for the reuse of human excreta waste amounts to US$1.8 million per year. This benefit is from the construction of biodigester plants for digesting animal and human waste for biogas and fertilizer, and from the cash saving associated with the use of biogas. While the figures mentioned above are the base case estimation, sensitivity analysis was conducted to explore variation in estimated costs using different data sources and assumptions. The sensitivity analysis indicates that the base case results are sensitive to data inputs, in particular the value of life for premature deaths, which could be considerably higher. Input ranges for other variables tested in one-way sensitivity analysis do not individually affect the overall results significantly. The findings of this study support widely though poorly substantiated beliefs that poor sanitation has significant economic costs. Consequently, it has also shown that the gains of improving sanitation could be substantial. On the basis of these findings, the study recommends the following: Given broad impacts of poor sanitation, decision makers from various sectors covering health, water resources, environment, rural and urban planning and development, fisheries, and tourism are advised to act now as the negative impacts of poor sanitation will increase over time incurring higher economic costs. Governments should give priority to the populations with no latrine, recognizing that effective demand may be low in these groups due to low incomes and poor awareness of the benefits of investing in sanitation. Sanitation investments should not be made just in latrine extension programs, but in improved sludge, water and solid waste management, and in hygiene programs to raise population awareness on personal and community hygiene issues. Since health impacts incur the highest cost related to poor sanitation, health aspects of sanitation programs deserve central focus. Governments should focus on the easy health wins from improved sanitation, through targeting children and focusing on safe but simple latrine designs, improved excreta isolation measures, and improved hygiene practices. Governments should urgently implement sanitation standards that reduce the release of waste matter into water resources given that water is partly polluted by poor sanitation. In this case, the focus should not be just on excreta, but also solid waste, household, agricultural and industrial wastewater. Given broader impacts of poor sanitation, sanitation cannot be only the responsibility of an individual sector/ ministry, nor of a single level of government. The fact that sanitation touches on many sectors and line ministries should be used as a strength rather than hampering progress, and clear roles and responsibilities need to be defined. While economic impacts of poor sanitation vary across regions in the country due to demographic situation, environment, and sanitation coverage, local studies should be commissioned to better inform local policy makers on the impacts. In this sense, the methodology used in this study can be of good use. Moreover, local level cost-benefit studies will inform decision makers how to invest efficiently in sanitation Future survey and research work is a key in monitoring progress of improving sanitation in the country. Surveys and government reporting systems should be assessed for extension to include behavior and outcomes related to sanitation. The link between poor sanitation and tourism and foreign direct investment losses is poorly understood, and merits further assessment. 4

9 FOREWORD Foreword Cambodia is developing in all sectors, gradually lifting its people out of poverty as well as improving their living standards. Along with such development, the Royal Government of Cambodia, led by Samdech Akka Moha Sena Padei Techor Hun Sen, Prime Minister of the Kingdom of Cambodia, acknowledged in the National Forum on Rural Sanitation and Hygiene on 13 th 14 th November 2007 the issue of poor sanitation coverage and hygiene practices of the Cambodian people living in rural areas. The Prime Minister Samdech Techor said, In Cambodia, poor sanitation and hygiene is one of the factors contributing to the poverty of Cambodian people and blocking the efforts of the Royal Government in national economic development. The lack of good sanitation and hygiene practices severely affects the lives of rural people, especially poor households and vulnerable people who are at higher risk from waterborne and hygiene-related diseases. Sanitation and hygiene has received very limited attention from relevant institutions within Cambodia. Very limited information exists on the impacts of poor sanitation and hygiene, or the institutional policy options and strategies to improve sanitation and hygiene. Sanitation and hygiene improvement is one of the priorities of the Ministry of Rural Development, who needs better understanding of the impacts of poor sanitation and hygiene both in the present and in the future. Ultimately this will enable the implementation of pro-poor strategies in line with the policies of the Royal Government of Cambodia. For the above reasons, the Water and Sanitation Program of the World Bank, East Asia and the Pacific region, supported the research program Economic Impacts of Sanitation in Cambodia. The study aim is to provide scientific evidence and information related to economic benefits of improved sanitation and hygiene options. The principal focus of this study is to examine the economic and social losses associated with poor sanitation and hygiene, and conversely, the potential economic and social gains of improving sanitation and hygiene. On behalf of the Ministry of Rural Development, as the government institution in charge of rural water supply, sanitation and hygiene, I would like to express my sincere thanks to the Water and Sanitation Program of the World Bank, East Asia and the Pacific region, for including Cambodia as one of the collaborating countries in this useful research program. The results of the research will be valuable for inclusion in the National Strategy on Rural Sanitation and Hygiene Promotion in Cambodia, which the Ministry is planning in the year I would encourage concerned institutions to use the data and information from this study to improve the planning of rural sanitation and hygiene programs in Cambodia. 5
10 ABBREVIATIONS Abbreviations ADB ALRI BOD CATA CBA CDHS CFR CIPS CMDG CNMC COD CSES DHS DO DPWT EAP EASAN Ecosan EIC ESI FAO FDI GDP GNP GRP HH HIS HRQL IPD JMP Kg MAFF MDG MoE MoEYS Asian Development Bank Acute Lower Respiratory Infection Biochemical Oxygen Demand Cambodia Association of Travel Agents Cost-Benefit Analysis Cambodia Demographic and Health Survey Case Fatality Rate Cambodia Inter-censal Population Survey Cambodia Millennium Development Goals Cambodian National Mekong Committee Chemical Oxygen Demand Cambodia Socio-Economic Survey Demographic and Health Survey Dissolved Oxygen Department of Public Works and Transport East Asia and the Pacific East Asia Sanitation Conference Ecological Sanitation Economic Institute of Cambodia Economics of Sanitation Initiative Food and Agriculture Organization Foreign Direct Investment Gross Domestic Product Gross National Product Gross Regional Product Household Health Information System Health-Related Quality of Life Inpatient Day Joint Monitoring Program (WHO,UNICEF) Kilograms Ministry of Agriculture Forestry and Fisheries Millennium Development Goal Ministry of Environment Ministry of Education Youth and Sports 6
11 ABBREVIATIONS MoH MoLVT MoWA MoWRM MPP MRC MRD NBP NGO NSDP OECD OPV PPP PPWSA SEAR-B SEI UNEP UNITAR WHO WPR-B WSP WTP Ministry of Health Ministry of Labor and Vocational Training Ministry of Woman Affair Ministry of Water Resource and Meteorology Municipality of Phnom Penh Mekong River Commission Ministry of Rural Development National Biodigester Program Non-Governmental Organization National Strategic Development Plan Organization for Economic Co-operation and Development Outpatient Visit Purchasing Power Parity Phnom Penh Water Supply Authority WHO Southeast Asia Region epidemiological strata B Stockholm Environment Institute United Nations Environment Program United Nations Institute for Training and Research World Health Organization WHO Western-Pacific Region epidemiological strata B Water and Sanitation Program Willingness To Pay 7
12 ACKNOWLEDGEMENTS Acknowledgments The Sanitation Impact Study was conducted under the Economics of Sanitation Initiative (ESI) in four countries: Cambodia, Indonesia, the Philippines and Vietnam. A study is ongoing in Lao PDR. The study was led by the East Asia and Pacific office of the World Bank s Water and Sanitation Program (WSP-EAP), with the contribution from WSP teams in each of the participating countries. The study took one year to complete, and has undergone two major peer review processes. Guy Hutton (WSP-EAP Senior Water and Sanitation Economist) led the development of the concept and methodology for ESI, and the management and coordination of the country team. The study benefited from the continuous support of other WSP-EAP staff. Isabel Blackett was the task team leader, Jemima Sy, Brian Smith, Almud Weitz and Richard Pollard provided input to the concept development and study execution. Bjorn Larsen (WSP consultant) contributed to the study methodology and provided the figures for malnutrition-related health effects of poor sanitation. The country team in Cambodia consisted of Phyrum Kov (Economic Institute of Cambodia, country lead), Hach Sok (EIC director), Sophanara Roth (EIC) and Kongkea Chhoeun (EIC). Jan Willem Rosenboom (WSP Cambodia) contributed importantly to the study. Sovannra Aing (EIC) assisted with report finalization. The ESI was financed by the regional component of the Sustainable Sanitation in East Asia (SUSEA) program, which is funded by the Swedish International Development Agency (SIDA). The Philippines study received co-funding from the United States Agency for International Development (USAID) Environmental Cooperation-Asia (ECO-Asia) program. WSP and the report authors are grateful to the funding agencies for supporting this study. Elena Strukova, Caroline van den Berg, Anjali Archarya, and Tracey Hart reviewed the methodology study before its implementation. Peer reviewers of the Cambodia country draft report were: Hilda Winarta (UNICEF), Jan Lam (SNV), Chea Samnang (Ministry of Rural Development), Ruud Corsel (Niras-Scanagri, Vietnam), Oun Syvibola (Plan International), Jan Willem Rosenboom (WSP Cambodia), Isabel Blackett (WSP-EAP), and Brain Smith (WSP-EAP). The Cambodia study benefited from peer review conducted simultaneously on other country reports as well as the synthesis report. Peer reviewers of the synthesis draft report were (World Bank staff unless otherwise stated): Eddy Perez, Anjali Acharya, Pete Kolsky, Elena Strukova (consultant), Bjorn Larsen (consultant), and Peter Feldman (Plan International). Peer reviewers of the Philippines country draft report were: Jema Sy and Andy Robinson (consultant). Peer reviewers of the Vietnam country draft report were: Samuel Leibermann, Doan Hong Quang, Pham Khanh Toan (Ministry of Construction), Nguyen Viet Anh (University of Civil Engineering), Nguyen Kim Thai (University of Civil Engineering), Nguyen Van Thuan (Australian Agency for International Development), and John Collett (Plan International). WSP and the country team appreciate the inputs of local stakeholders Department of Rural Health Care of Ministry of Rural Development, Department of Planning of Ministry of Health, Phnom Penh water supply authority, and other institutions. A complete list of key informants is given in Annex E. Reference for citation: Economic impacts of sanitation in Cambodia. Kov P, Sok H, Roth S, Chhoeun K, Hutton G. World Bank, Water and Sanitation Program This technical report is available in shortened form from WSP offices and from asp. 8
13 ACKNOWLEDGEMENTS References for other reports Economic impacts of sanitation in Southeast Asia. Hutton G, Rodriguez UE, Napitupulu L, Thang P, Kov P. World Bank, Water and Sanitation Program Economic impacts of sanitation in Indonesia. Napitupulu L and Hutton G. World Bank, Water and Sanitation Program Economic impacts of sanitation in the Philippines. Rodriguez UE, Jamora N, Hutton G. World Bank, Water and Sanitation Program Economic impacts of sanitation in Vietnam. Thang P, Tuan H, Hang N, Hutton G. World Bank, Water and Sanitation Program
14 CONTENTS Contents Executive Summary 1 Foreword 5 Abbreviations 6 Acknowledgments 8 Contents Introduction Human development and sanitation Sanitation in Cambodia Measuring the economic impact of sanitation Study goal and target audience Study Methodology Overview Levels and units of analysis Scope of sanitation Impact identification and classification Estimation methods for financial and economic costs of poor sanitation Impact mitigation Uncertainty Economic Impact Results Summary of economic impacts of poor sanitation Summary of economic gains from improved sanitation Health impacts Water resource impacts Environmental impacts Other welfare impacts Tourism impacts Sanitation markets Sensitivity analysis Discussion, Conclusions and Recommendations Discussion Overview and interpretation of main results Policy implications of the study results Study weaknesses Gender Conclusions Recommendations 61 Annexes 65 Annex A. Study Methods 66 A1 Health 66 A1.1 Selection of diseases 66 A1.2 Disease burden from diseases directly related to poor sanitation 69 A1.3 Disease burden from diseases indirectly related to poor sanitation 70 10
15 CONTENTS A1.4 Health care cost estimation 75 A1.5 Health-related productivity cost estimation 78 A1.6 Premature death cost estimation 80 A2 Water resources 83 A2.1 Water quality measurement 84 A2.2 Contribution of poor sanitation to water pollution 84 A2.3 Cost implications of water pollution for drinking water supply 86 A2.4 Water quality and domestic uses of water 88 A2.5 Water quality and fish production value 89 A3 Environment 92 A3.1 Aesthetics 93 A3.2 Land quality 93 A4 Other welfare 93 A4.1 Intangible user preferences 94 A4.2 Access time 94 A4.3 Impact on life decisions and behavior 95 A5 Tourism 97 A5.1 Introduction to tourism 97 A5.2 Tourism and sanitation 98 A5.3 Estimation of tourist losses due to poor sanitation 99 A5.4 Tourist sickness 100 A6 Impact mitigation associated with improved sanitation and hygiene 100 A6.1 Health impacts mitigated 101 A6.2 Other economic losses due to poor sanitation 101 A6.3 Market for sanitation inputs 102 A6.4 Market for sanitation outputs 103 A7 Uncertainty analysis 103 Annex B. Algorithms 106 B1. Aggregating equations 106 B2. Health costs related to poor sanitation and hygiene 106 B3. Water related costs associated with poor sanitation and hygiene 106 B4. Other welfare impacts 107 B5. Tourism losses 107 B6. Variable definition summary 107 Annex C. Recommendations for research 110 Annex D. Sanitation coverage by region and rural/urban grouping 111 Annex E. List of Contributing Stakeholders 112 Annex F. References
16 CONTENTS List of Tables Table 1. Improved sanitation coverage statistics for Southeast Asian countries versus other developing 16 world regions Table 2. Comparison of sanitation types and coverage values measured in different national surveys in 18 Cambodia Table 3. Population size and provincial make-up of regions in Cambodia in Table 4. Definition of improved and unimproved sanitation and water supply 24 Table 5. Aspects of sanitation included in the present Sanitation Impact study 24 Table 6. Justification for choice of impacts included in the study 26 Table 7. Categorization of impacts measured in the present study 27 Table 8. Financial and economic costs of poor sanitation measured in the study 28 Table 9. Potential benefits of different sanitation improvement options 29 Table 10. Financial and economic losses due to poor sanitation, Table 11. Table showing rural / urban breakdown for the main impacts, Table 12. Other non-quantified impacts of poor sanitation 34 Table 13. Predicted financial and economic gains from improved sanitation 36 Table 14. Summary health impacts by disease due to poor sanitation and hygiene 37 Table 15. Total health care costs by disease, Table 16. Total productivity costs 1, Table 17. Total costs of premature death, using human capital approach, Table 18. Total health-related costs 40 Table 19. Water resources in Cambodia 41 Table 20. Daily release of polluting substances to inland and ground water bodies 42 Table 21. Selected river water quality measurements in Cambodia from PPWSA sources, Table 22. Selected water quality measurements in Cambodia, from the Mekong River Commission, Table 23. Drinking water access costs 45 Table 24. Water access costs for domestic uses (drinking water excluded) 46 Table 25. Fish catch value current actual and estimated loss 47 Table 26. Annual time spent accessing latrines 49 Table 27. Volume and importance of tourist sector in Cambodia 51 Table 28. Economic impact of lower tourist numbers 52 Table 29. Annual sanitation input market values 53 Table 30. Annual sanitation output market values 53 Table 31. Results of one-way sensitivity analysis economic variables 54 Table 32. Results of one-way sensitivity analysis sanitation links 55 Table 33. Results of one-way sensitivity analysis impact mitigation 55 Table A1. Diseases linked to poor sanitation and hygiene, and primary transmission routes and vehicles 67 Table A2. Importance of sanitation and hygiene-related diseases, total cases and total deaths (2005) 68 Table A3. Distribution of morbidity and mortality by age group, year Table A4. Diarrheal disease incidence in Cambodia 70 Table A5. Current and estimated counterfactual underweight prevalence rates in children under 5 71 Table A6. Relative risk of mortality from mild, moderate and severe underweight in children under five 72 Table A7. Relative risk of illness from moderate and severe underweight in children under five 72 Table A8. Estimated cause-specific annual deaths in children under five in
17 CONTENTS Table A9. Demographic and mortality data in Table A10. Estimated annual cases of illness in children under five (thousand cases) 74 Table A11. Percent of total under-five child mortality attributable to poor sanitation 75 Table A12. Percent of cases of illness in children under five attributable to poor sanitation 75 Table A13. Treatment seeking behavior, by provider 76 Table A14. Estimated numbers of disease cases attributed to poor sanitation and hygiene seeking care 76 from different providers, year 2005 Table A15. Health service use and unit costs associated with outpatient care 77 Table A16. Health service use and unit costs associated with inpatient care 78 Table A17. Variables for estimating amount of time lost from disease 79 Table A18. Comparison of alternative sources of time value (year 2005) 80 Table A19. Estimated number of annual deaths from poor sanitation & hygiene 81 Table A20. Unit values for cost of a premature death 83 Table A21. Selected drinking water quality standards 84 Table A22. Proportion of untreated sewage discharged to water bodies 85 Table A23. Waste load production per capita per day, subdivided by gray water and sewage, for urban 86 households with pipe connection Table A24. Numbers of households by main source of drinking water 87 Table A25. Unit cost of water 88 Table A26. Lack of latrine indicators of defecation conditions 94 Table A27. Toilet access, by geographical location sub-type 95 Table A28. Water and sanitation coverage in schools ( ) 96 Table A29. Male / female participation rates in school and workplace ( ) 97 Table A30. Inputs for calculating the financial losses in tourist receipts 100 Table A31. Summary of meta-analysis results on WSH intervention efficacy for diarrheal disease reduction 101 Table A32. Unit prices of sanitation improvement options (per household) 102 Table A33. Input values for estimation of returns to re-use of human waste 103 Table A34. Alternative assumptions and values used in one-way sensitivity analysis 104 Table A35. Alternative assumptions for links between poor sanitation and impacts 105 Table A36. Alternative assumptions for impact mitigation 105 Table B1. Subscripts used in algorithms 107 Table B2. Variables used in algorithms 108 Table B3. Parameters used in algorithms 109 List of Figures Figure 1. Primary and economic impacts associated with improved sanitation options (human waste) 26 Figure 2. Economic cost of premature death at different unit values for premature death 1 41 Figure 3. Contribution of different costs to total cost, by disease 42 Figure 4. Perceived importance of improved latrine to households 50 Figure 5. Female school drop-out rate vs. school sanitation 51 Figure 6. Modeled relationship between dissolved oxygen levels and fish production (with lower and 93 upper range) 13
 12.3% Female population (% of total) 51.5% Urban population (% of total) 16.")
 447 GDP per capita (PPP) 2,929 Sanitation (2005) % improved rural 15.7% % improved urban 56.1% % urban sewage connection 28.")
18 Basic Information on Cambodia Population (2005) Total population 13,806,974 Rural population 11,565,127 Urban population 2,241,847 Under 5 population (% of total) 12.3% Female population (% of total) 51.5% Urban population (% of total) 16.2% Currency Currency name Riel Year of cost data presented Currency exchange with US$ 4,050 Exchange rate date 1-Jun-07 GDP per capita (US$) 447 GDP per capita (PPP) 2,929 Sanitation (2005) % improved rural 15.7% % improved urban 56.1% % urban sewage connection 28.9% 1 Except tourism loss where the cost is estimated based on 2006 figure
19 1Introduction WSP-EAP Research Report February 2008
20 INTRODUCTION 1.1 Human development and sanitation Pollution and poor health are still major problems in Cambodia, hindering human development in the country. Among others, pollution of water resources and the surrounding environment due to poor sanitation and the improper management of solid waste is still a major challenge. The release of sewage and gray water into water bodies and the seepage of latrines into ground water have contaminated water sources making them unsafe for untreated consumption and affected productivity of water resources. Rates of disease due to poor sanitation and hygiene are amongst the highest in the region. In addition, the mismanagement of solid waste has damaged the aesthetics particularly in urban areas and caused environmental concerns among inhabitants. 1.2 Sanitation in Cambodia Unarguably, sanitation is lagging behind other global development goals. In 2004, 59% of the world s population had access to improved sanitation, which represents a 10% increase from 49% global coverage in However, due to population growth, the global population without improved sanitation has decreased only marginally from 2.7 to 2.6 billion over a 14 year time period [1]. Table 1 shows, according to sanitation coverage data from the WHO/UNICEF Joint Monitoring Program (JMP), that Cambodia has the lowest sanitation coverage in Southeast Asia. Table 1. Improved sanitation coverage statistics for Southeast Asian countries versus other developing world regions Country Rural (%) Urban (%) Total (%) SOUTHEAST ASIA Cambodia Indonesia Lao PDR Malaysia Myanmar Philippines Singapore Thailand Timor-Leste Vietnam TOTAL OTHER REGIONS East Asia South Asia West Asia Oceania Latin America & Caribbean North Africa Sub-Saharan Africa CIS Source: 16
21 INTRODUCTION In 2004, only 8% of the rural population in Cambodia had access to improved sanitation while other countries reached at least 20%. In addition, urban areas of Cambodia have improved coverage of 53% compared to more than 70% in other Southeast Asian countries. In 2004, it is estimated that more than 11 million people are living without access to improved sanitation in Cambodia. Comparing the sanitation coverage with water supply coverage, it is noted that water supply coverage at 41% exceeds sanitation coverage by more than two times. Given that rural coverage of improved sanitation is very much lower than urban coverage, the national policy on rural water and sanitation sets the vision: Every person in rural communities has sustained access to safe water supply and sanitation services and lives in a hygienic environment by Obviously, this vision emphasizes the need for more investment in sanitation in rural areas. What is more, the Cambodia Millennium Development Goal (CMDG) target for sanitation coverage is set to be 30% for rural areas and 74% for urban areas, to be achieved by 2015 [2]. Based on current coverage and existing resource allocations to sanitation, however, it is unlikely that these targets will be reached by It is stated that at the current rates of latrine construction, it will take about 24 years to reach the 2015 target, and another 130 years to reach universal rural sanitation coverage [3]. Therefore, the sanitation improvement efforts need to be sped up if the universal rural sanitation target set by the national policy is to be achieved by It should be noted that the statistics reported by the JMP diverge from national statistics. JMP statistics are compiled according to international standards of what is improved, and are based on a comparison of different coverage sources which use different definitions and are often at variance with each other. It is worth noting that the JMP estimate for 2004, which gave 8% in rural areas in Cambodia, was based on the 1998 Census and the 2000 Demographic and Health Survey. In Cambodia, various data sources are available for sanitation coverage each of which may have different interpretation of improved and unimproved latrine. Three sources of data are listed in Table 2, which are the Cambodia Socioeconomic Survey (CSES) 2004, Cambodia Inter-censal Population Survey (CIPS) 2004, and Cambodia Demographic and Health Survey (CDHS) It is observed that different surveys give different results of sanitation coverage. However, the CDHS tends to be more reliable compared to other source of data. It can be observed that CDHS (2005) has utilized the JMP definitions of improved and unimproved sanitation 1. Moreover, the sanitation coverage figure given by CDHS (2005) is considered as the official figure to be used in Cambodia. According to CDHS, the sanitation coverage also varies by regions in the country. While improved sanitation is largely available in Phnom Penh zone (84% improved), the unimproved sanitation is highest in the Plateau zone (16% improved). 1 The latrine is improved if it is used only by household members and not shared with others, and if the system can separate human waste from human contact. The types of facilities that are likely to achieve this may consist of flush or pour flush to piped sewer/septic tank/pit latrine, ventilated improved pit (VIP) latrine, pit latrine with slab, and composting toilet. The unimproved sanitation facility, however, refers to the shared latrine and other types of latrine which do not effectively separate human waste from human contact. 17
22 INTRODUCTION Table 2. Comparison of sanitation types and coverage values measured in different national surveys in Cambodia Survey House Improved sanitation (%) Unimproved sanitation (%) Septic tank Pit latrine Total Public toilet Pit latrine Open Other Total CSES (2004) Rural Urban Total CIPS (2004) Rural Urban Total CDHS (2005) Rural Urban Total Despite low access to improved sanitation, the National Strategic Development Plan (NSDP), a wellprepared document on the strategies for development of Cambodia, slightly mentions about sanitation in its priority areas. It is noted that while the targets for achieving better access to improved sanitation are clearly defined in NSDP, there is no clear action plan to achieve those targets. Moreover, the budget allocation in sanitation sector is not explicitly given. Based on NSDP, while the budget for sanitation improvement is partly included in water and sanitation sub-sector, the budget for rural sanitation seems to be included in rural development sub-sector. According to the classification, the water and sanitation sub-sector covers more than just water supply and sanitation 2, whereas rural development sub-sector does not clearly include rural sanitation 3. In this sense, it is hardly seen how much the budget is really allocated to sanitation. According to NSDP, the total allocated budget between 2006 and 2010 for water and sanitation and rural development is respectively US$150 million and US$350 million. The former amounts to 4.3% of the total budget of the NSDP, while the latter is roughly 10%. Despite these amounts, it is generally perceived that water supply and sanitation investment lags behind the investment in other sectors, which can be explained by the low political profile of sanitation in terms of government prioritization and funding, limited government budget, the lack of recognition of the many costs to society of poor sanitation, and a higher demand for investments in domestic water supply. As well as lack of top-down investment in the sector, the opportunities for attracting private sector engagement in the financing and provision of sanitation services are not sufficiently enabled, especially the potential for contribution by small-scale entrepreneurs. To date most sanitation investment has been by household self-provision. In this sense, it is important that the sanitation impact study is conducted to provide sound evidence to policy makers about the cost of neglecting the sanitation issue in the country, and the benefits of investing in sanitation. 2 Water and sanitation: sector policy and planning, water supply and sanitation, river development, waste management, education and training, and other (Source: The Cambodia Aid Effectiveness Report 2007) 3 Rural development and land management: rural sector policy and administration, forestry, land management and spatial planning, landmine clearance, and other (Source: The Cambodia Aid Effectiveness Report 2007) 18
23 INTRODUCTION 1.3 Measuring the economic impact of sanitation To generate concrete evidence, the present study will examine some of the major negative economic consequences of poor sanitation. Until now, many of these consequences are understood at a general level, but there is often a lack of data to support assertions that poor sanitation imposes a considerable burden on society, or else data are context specific. Without such information, policy makers are unable to act. Furthermore, while some impacts of sanitation are now better understood, such as health impacts, many of the stakeholders that need to become convinced of the importance of sanitation are not directly concerned with health. Hence a range of potential impacts need to be examined and presented so that stakeholders see the multiple negative impacts of sanitation, and thus become convinced that concerted action is needed from several sectors. The study, therefore, attempts to look into the impact on health, water resource, environment, tangible and intangible user preference, and tourism. Despite the attempt, this study has faced several challenges in attempting to both meet scientific criteria, as well as present evidence that is useful for national as well as local policy makers. Studies examining the economic impact of pollution rely on a whole range of different types of evidence in order to quantify the impact related to one specific cause of pollution. First, there is a severe lack of routine information systems or research studies that indicate the overall level of the impact. Therefore, in the absence of generalisable field studies, relationships must be modeled and assumptions must be made. Second, valuation of impacts in economic terms must rely on sometimes crude techniques, using both market and shadow prices, which can change over time thus adding uncertainty to results. Third, when there are multiple causes of pollution, then a portion of the overall economic impact estimated must be apportioned to the component of pollution (i.e. poor sanitation in the case of the present study). In this regard, methodologies needed to be developed for this present study that allowed estimation of economic impacts that are both realistic and scientifically sound. 1.4 Study goal and target audience The specific goal of the present Sanitation Impact study is to provide decision makers at country and regional level with better evidence on the negative economic impacts of poor sanitation, and to provide tentative estimates of those negative impacts that can be mitigated by investing in improved sanitation. The target audience is primarily national level policy makers with influence the overall allocation of resources to sanitation, including central ministries (budgeting, economics, finance), line ministries (infrastructure, sanitation, water, rural development, urban planning) and external funding and technical partners (multilateral, bilateral and non-government agencies). The study is also targeted at sub-national decision making levels where results and conclusions of this study are also relevant. The study results disaggregate impacts by provincial groupings for each country, as well as providing a rural-urban breakdown. However, to inform local decisions, further studies are needed that disaggregate at provincial, city, and district levels, and below. Hence, the study presented here is a situation analysis, whose primary aim is to mobilize the different stakeholders and partners inside and outside the sanitation sub-sector to use better quality and comprehensive evidence in allocating resources to the sanitation sub-sector. In order to provide timely evidence, the study uses an evaluation methodology that draws largely on existing data sources available from governments, donors, non-government agencies and the scientific literature. The data gaps and weaknesses identified in this study enable recommendations for future strengthening of routine information systems and priority areas for scientific research to allow better estimation of sanitation impact in the future. Separate reports and policy briefs are available for each country (www. wsp.org/pubs/index.asp). This current report provides a synthesis of the major findings from the four participating countries 4. 4 A study on-going in Lao PDR will be published later. 19

24 INTRODUCTION The results of this first study will contribute to the design and execution of a second study under the Economics of Sanitation Initiative, whose primary purpose is to evaluate the comparative costs and benefits of alternative sanitation improvement options in a range of country contexts. This second study is based on the rationale that decision makers need to know which sanitation improvements provide the best value for money, what the overall costs and benefits are, and who is willing or able to finance the improvements. These studies together will provide an improved evidence-base for the efficient planning and implementation of sustainable sanitation options in the East Asia and Pacific region. A focus in this present study on sanitation, and not water per se, is justified for two main reasons: 1. Water has historically received greater emphasis than sanitation, in terms of research, policy development, programmatic support, as well as resource allocation. The WHO / UNICEF Joint Monitoring Programme estimates that in the 1990s, water received US$12.6 billion annually, while sanitation received US$3.1 billion, a factor difference of 4 times [4]. In Asia, the factor difference between spending on water and spending on sanitation in the same period is 5.5 times. As a result of this skewed spending, sanitation is lagging behind other global development goals: 59% of the world s population had access to improved sanitation in 2004, compared to 83% for access to improved water supply [1]. 2. Poor sanitation practice is the starting point for many of the observed negative impacts of poor water and sanitation. For example, water quality is affected by poor sanitation; hence by improving sanitation, the quality of water for human consumption and productive purposes is improved. Also, the major share of water, sanitation and hygiene-related diseases are fecal-oral in nature, which means that they are transmitted because the sanitation practice fails to isolate the pathogens from contact with humans. Hence, this present study is a first attempt to comprehensively evaluate the impacts of poor sanitation in Cambodia. Many of these impacts are quantifiable in economic terms. Other impacts which are less tangible or less easy to evaluate are also potentially important for economic development, quality of life, and political decision making. This study is the first application of a comprehensive sanitation impact evaluation methodology developed by the World Bank Water and Sanitation Program [5]. Based on the experiences of this present study, the methodology will be revised for application in other countries and regions of the world. 20
25 WSP-EAP Research Report February Study Methodology Overview
26 STUDY METHODOLOGY OVERVIEW The Sanitation Impact study follows a standardized peer reviewed methodology in all five countries [5]. Differences in the quality and level of detail of data in the five countries required adaptations to the methodology to arrive at the same output data on economic impacts. This section describes: 1. The levels and units of analysis (2.1). 2. Which aspects of sanitation are included in this study (2.2). 3. How impacts are classified and which are included and excluded in the study (2.3). 4. An overview of how the different economic impacts of unimproved sanitation are measured (2.4). 5. The methods used for predicting the economic benefits associated with improved sanitation ( Impact mitigation ) (2.5). Annex A describes the detailed methods for estimating the economic impacts of unimproved sanitation, and how methodological weaknesses and uncertainty in input variables are evaluated in sensitivity analysis. 2.1 Levels and units of analysis The primary aim of this study is to describe and quantify sanitation impacts at national level, in order to inform policy makers about the overall negative impacts of poor sanitation and the potential benefits of implementing different types of sanitation improvement in Cambodia. The ultimate usefulness of these overall economic impacts of poor sanitation is to serve as the basis for estimation of what impacts can be mitigated from improving sanitation. It is key to note in the interpretation of the results of this study that the gains from improving sanitation will be less than the losses from unimproved sanitation, given that (a) sanitation interventions do not have 100% effectiveness to reduce adverse health outcomes associated with poor sanitation, (b) poor sanitation is one of many causes of water and environmental pollution. The aim of the study is to present impacts in disaggregated form, to aid interpretation and eventually policy recommendations. Geographical disaggregation of results is presented for some types of economic impact, i.e. at the regional level. Rural/urban disaggregations are made for all countries for impacts where feasible. Furthermore, health impacts are disaggregated by age groups for selected diseases and descriptive gender analyses are conducted for selected impacts. The study uses a modeling approach and draws almost exclusively on secondary sources of data. The study presents impacts in terms of both physical units, and converts these to monetary equivalents using conventional economic valuation techniques. Results on economic impact are presented for a single year the latest available data were for 2005 for most variables, while for some variables 2006 was the latest year. Overall impacts are presented in terms of per capita impacts in United States Dollars. For those impacts where quantification in economic terms is not feasible using secondary data sources, the impacts are examined and reported descriptively. Table 3 shows the population size and provincial make-up of each region of Cambodia. 22
 Provinces contained Rural Urban Total Phnom Penh 567 747 1,314 Phnom Penh Plains 5,336 247 5,584 Kg")
27 STUDY METHODOLOGY OVERVIEW Table 3. Population size and provincial make-up of regions in Cambodia in 2005 Zone Population size ( 000) Provinces contained Rural Urban Total Phnom Penh ,314 Phnom Penh Plains 5, ,584 Kg Cham, Kandal, Prey Veng, Svay Rieng, Takeo Tonlé Sap 3, ,255 Banteay Meanchey, Battambang, Kampong Thom, Siem Reap, Kampong Chnange, Pursat Coastal ,041 Kampot, Kep, Sihanoukville, Koh Kong Plateau/ Mountain 1, ,614 Total 11,565 2,242 13,807 Source: Population projection , National Institute of Statistics Kampong Speu, Kratie, Modulkiri, Preah Vihear, Ratanakiri, Stung Treng, Oddormeanchey, Pailin It is noted that two of the five zones the Plains zone and Tonlé Sap zone account for roughly two-thirds of the Cambodian population of 13.8 million in The national population growth rate from 2004 to 2005 is estimated at nearly 2%. It is also observable that Phnom Penh zone has had the highest population growth rate (3.3%) followed by plateau and mountain zone (2.5%), and coastal zone (2.3%). 2.2 Scope of sanitation In conducting an impact study of poor sanitation, it should be clear what aspects of sanitation are being assessed given that sanitation has relevance for many aspects of life. Furthermore, what actually constitutes improved sanitation will vary across countries and cultural contexts. In the international arena, the sanitation target adopted as part of the Millennium Development Goals focuses on the disposal of human waste, thus leading to a narrower understanding of the term sanitation. Table 4 presents definitions used by the WHO/UNICEF Joint Monitoring Programme for improved and unimproved water supply and sanitation. However, this study has recognized that other aspects of sanitation are also relevant to the economic impacts being measured in the present study, and in line with the broader definition of sanitation used in this study: the hygienic disposal or recycling of waste, as well as protection of health through hygienic measures. The broader definition of sanitation refers to management of human and animal excreta, solid waste, other agricultural waste, toxic waste, wastewater, food safety, and associated hygiene practices. 23
28 STUDY METHODOLOGY OVERVIEW Table 4. Definition of improved and unimproved sanitation and water supply Intervention Improved Unimproved 1 Sanitation Water supply Flush or pour-flush to: Piped sewer system Septic tank Pit latrine Ventilated Improved Pit-latrine Pit latrine with slab Composting toilet Piped water into dwelling, plot, or yard Public tap / standpipe Tubewell/borehole Protected dug well Protected spring Rainwater collection Flush or pour-flush to elsewhere Pit latrine without slab or open pit Bucket Hanging toilet or hanging latrines No facilities or bush or field Unprotected dug well Unprotected spring Cart with small tank/drum Tanker truck Bottled water Surface water (river, dam, lake, pond, stream, canal, irrigation channels) Source: This table reflects the updated definition of improved and unimproved sanitation and water supply presented in the 2006 JMP report [1]. 1 Defined as being unimproved due to being unsafe or costly While it is understood that sanitation is often more broadly defined than the components listed above, it was not possible to apply a broader definition in the present study due to time and resource constraints. Hence, issues such as drainage, flood control measures, hospital waste, industrial waste, and broader environmental health such as food hygiene, air pollution and vector control, were not included. Table 5 summarizes the aspects of sanitation included and excluded from this study. Table 5. Aspects of sanitation included in the present Sanitation Impact study Included Practices related to human excreta: Quality, safety and proximity of latrine system Disposal or treatment of waste and impact on the (inhabited) outdoor environment Hygiene practices Practices related to disposal or treatment of gray water Practices related to disposal or treatment of household solid waste Practices related to use or disposal of animal excreta Excluded Drainage and general flood control measures Industrial effluents, toxic waste and medical waste Air pollution unrelated to human excreta Vector control Broader food safety Broader environmental sanitation 2.3 Impact identification and classification Poor sanitation has many actual or potential adverse impacts on populations as well as national economies. On the reverse side of the same coin, different measures for improving sanitation can go some way to mitigating those negative impacts, hence stimulating economic growth and reducing poverty. Figure 1 presents a range of possible impacts of sanitation, as they relate to five key aspects of human excreta management: latrine access, latrine system, hygiene practices, waste disposal, and waste re-use. The major links are shown with arrows: links between the sanitation option and the primary impact (between left-hand and central boxes); and links between the primary impact and the resulting economic impact (between central and right-hand boxes). In the context of Cambodia, 24
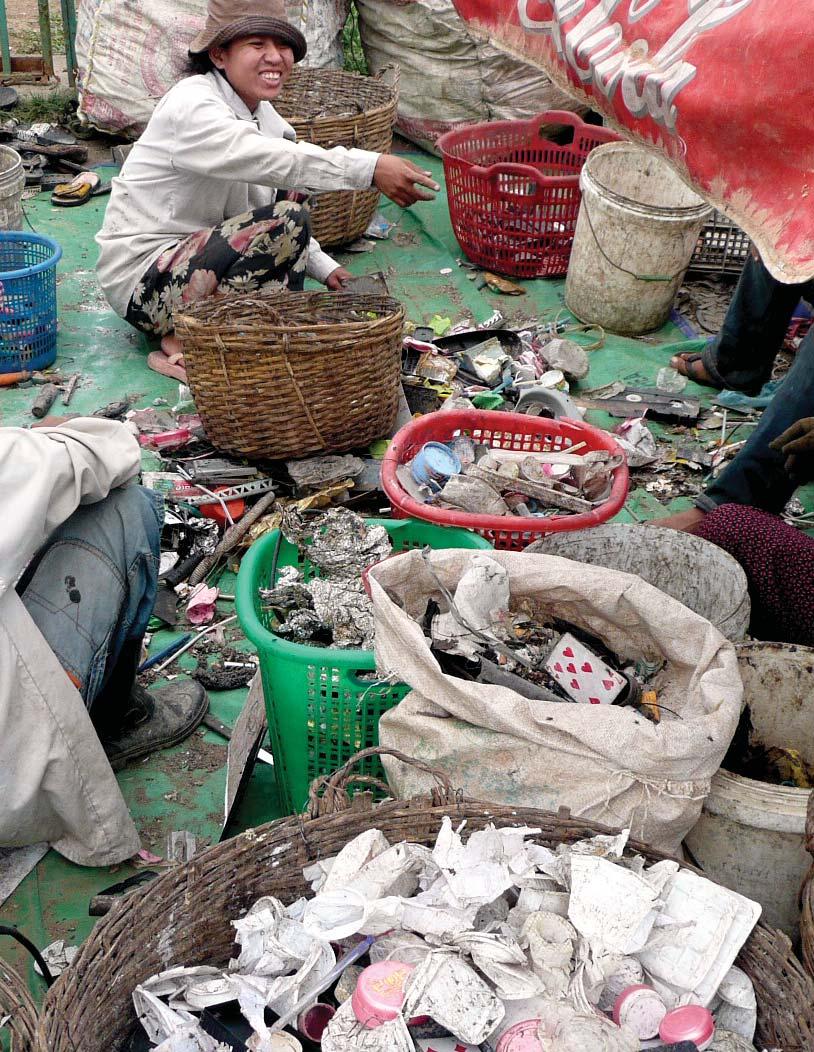
29 STUDY METHODOLOGY OVERVIEW not all impacts are relevant in the present study. The impacts such as entry fee, house price rises, cottage industry, and Foreign Direct Investment (FDI) will not be considered in the study because although important, they are very minor compared to other major impacts of sanitation. Figure 1. Primary and economic impacts associated with improved sanitation options (human waste) 1 Comfort, convenience, security, privacy 2 Visual effects, smells 3 HRQL: health-related quality of life Based on the exhaustive set of impacts shown in Figure 1, a shortened list of negative impacts of poor sanitation to be included in the present study was selected, shown in Table 6 above. These impacts are classified under five main categories: health impacts, water resource impacts, environmental impacts, other welfare impacts, and tourism impacts. Table 6 also provides further justification for inclusion of these impacts in the study, showing the presumptions based on preliminary evidence of importance [6] and discussion with country partners. Based on available evidence, the major anticipated impacts of poor sanitation were on health and water resources, and therefore greater focus was given on data collection for these impacts in Cambodia. Annex A provides further background on these impact categories. 25
30 STUDY METHODOLOGY OVERVIEW Table 6. Justification for choice of impacts included in the study Impact Link with sanitation Justification for inclusion in the present study Health Water External environment Other welfare Tourism - Poor sanitation and hygiene cause diseases, which lead to a range of direct and indirect economic effects - Released human and animal excreta pollutes water resources which affects its usability or productivity and leads to costly averting behavior and/or production impact - Neighborhoods with poorly managed sanitation are less pleasant to live in, and population welfare is thus affected - Poor sanitation results from cultural barriers, low awareness, lack of design options, low income, and lack of home ownership - Poor sanitation in institutions affect life choices, or lead to absenteeism at school or the workplace - Poor sanitation affects the attractiveness of tourist destinations and tourist arrivals; and can lead to holiday sickness - Scientific evidence is available on the causal pathways between unimproved sanitation/hygiene and the causative disease pathogens/hosts - Health information systems, household surveys and economic studies testify to the diseases suffered by the population and the associated costs of disease - Unregulated sewage release into water bodies is a proven significant contributor to inland (and marine) water resource pollution - Water is treated or purchased by households, and undergoes costly treatment by piped water providers for domestic and commercial purposes - Households hauling water themselves travel further to access a cleaner, safer water supply - Fish are unable to reproduce and survive in heavily polluted water. At lower levels of pollution, fish numbers are affected by oxygen depletion and micro-bacteria - Humans are affected when they eat fish that have been exposed to raw sewage - Land and building prices are highly sensitive to environmental factors - Poor people tend to live on marginal land - As income rises, households are willing to pay more for better sanitation services - Household members have to spend time accessing toilet in the open (nature) or queuing to use shared or public facilities - Privacy and convenience are underestimated intangible aspects in sanitation choices - There exists an income gradient in latrine ownership - Sanitation is more important to people who lack voice in household or community decisions women and children - Tourism is an important source of national income and employment, offering high returns on investment - The most popular tourist destinations have clean environments, good toilet facilities, and a lower risk of getting sick Table 7 details the specific impacts to be examined under health, water resources, external environment, other welfare impacts and tourism. The columns indicate the five key components of sanitation assessed (refer to Table 6) for the different impacts. Human excreta management is relevant for all impact areas. Poor hygiene mainly affects health. Gray water mainly affects water resources. Solid waste mainly affects the external environment and tourism. 26
31 STUDY METHODOLOGY OVERVIEW Also, potential impacts of improved sanitation the stimulation of local markets for sanitation inputs (labour, materials) and the reuse of waste for productive purposes are also included in the Table 7. Table 7. Categorization of impacts measured in the present study 1 Impact Sub-impacts Human waste Hygiene practices Gray water Animal waste 1. Health Health status Disease treatment costs Productive time loss Premature death 2. Water resources Water quality Drinking water Domestic uses of water Fish production 3. External Aesthetics environment Land use and quality 4. Other welfare Intangible aspects Time used for toilet access Life choices 5. Tourism Tourist numbers Tourist sickness 6. Sanitation markets Sanitation inputs Sanitation outputs Solid waste 1 A tick shows which impacts were measured in this study. The absence of tick does not indicate that no empirical relationship is anticipated; only that it was not evaluated in this study. 2.4 Estimation methods for financial and economic costs of poor sanitation Policy makers are interested to understand the nature of the economic impacts being measured. For example, do the impacts have immediate implications for expenditure and incomes by households or governments, or are the effects non-pecuniary or longer-term in nature? The answer will naturally affect how the results are interpreted, and what level of support there will be for impact mitigation measures. Hence, while recognizing the difficulties in distinguishing different types of economic impact, this present study attempts to distinguish broadly between two different types of impact financial and economic: Under financial costs, those costs which are most likely to affect quantified indicators of economic activity in the short term were included. Financial costs include changes in household and government spending as well as impacts likely to have real income losses for households (e.g. health-related time loss with impact on household income) or enterprises (e.g. fishery loss). It should be noted that, while these financial costs affect economic activity indicators in the short term, these impacts are not expected to directly affect Gross Domestic Product, due to substitution effect, transfer payments, and so on. Under economic costs, other costs were added to the above financial costs to approximate the overall population welfare impact of poor sanitation. These include the longer-term financial impacts (e.g. less educated children, loss of working people due to premature death, loss of usable land, long-term tourist losses), as well as nonfinancial implications (value of loss of life, time use of adults and children, intangible impacts). 27
32 STUDY METHODOLOGY OVERVIEW Table 8 describes which cost components were included for financial and economic definitions of cost for each subimpact. It should be noted that costs were those attributed to poor sanitation using an attribution factor (variable by impact). Some costs were non-quantified, as indicated in Table 8. The detailed methods of impact estimation are described in Annex A. Table 8. Financial and economic costs of poor sanitation measured in the study Impact category Subimpacts evaluated 1. Health Health care costs 2. Water resources 3. External environment 4. Other welfare Productivity costs Premature mortality Drinking water costs Domestic water uses Fish losses Work/school absence 5. Tourism Tourism costs Financial costs attributable to poor sanitation Marginal health seeking costs, including patient transport, medication cost in public sector, and private sector tariffs Income loss due to lost adult working days due to sickness Short-term household income loss due to adult death (1 year) Financial costs of water treatment and distribution Additional expenditure sourcing water from non-polluted sources Lost sales value due to reduction in fish catch Economic costs attributable to poor sanitation Full costs of health seeking, including full health care and patient transport costs Welfare loss due to adult and child sickness time Discounted lifetime income losses for adult & child death Financial + Time spent hauling water from safe water sources Financial + Time spent hauling water from less polluted sources Lost sales value due to reduction in fish catch Land quality - Economic value of land made unusable by poor sanitation Time loss - Welfare loss due to adult & child latrine travel/waiting time - Temporary absence of women from work and girls from school - Revenue loss from low occupancy rates and failure to exploit long term potential tourist capacity 2.5 Impact mitigation Having estimated the financial and economic costs of poor sanitation, from a policy viewpoint it is important to know by how much these costs can be reduced by implementing improved sanitation options. Indeed, while this study initially presents total costs attributed to poor sanitation, it is unlikely that this total value can be averted by improving sanitation. While there are many types and configurations of sanitation improvement available, this present study aims to estimate potential benefits obtainable for a selected number of features of sanitation improvements. This study provides an initial tentative estimate of the likely gains possible from improving sanitation using different options. It is the aim of the second study of ESI to estimate the costs and benefits of specific sanitation options, which are the most relevant policy options in each country context. Table 9 shows the five main features of sanitation improvement (in columns) assessed in this study, and the relevance of these for each sub-impact category (in rows). The features are described in the table footnotes. The impact mitigation estimation methods are described in Annex A6. 28
33 STUDY METHODOLOGY OVERVIEW Table 9. Potential benefits of different sanitation improvement options Impacts A B C D E F Latrine physical access 1 Improved toilet system 2 Hygiene practices 3 Waste treatment or disposal 4 Waste reuse 5 Tourism Health Water resources Environment Aesthetics Land quality Other welfare Intangible effects Access time Life choices Tourism Sanitation markets Sanitation inputs Sanitation outputs 1 Close and improved latrine for those using open defecation; improved population:toilet ratios through increased coverage of latrines (less queuing time) 2 Improved position or type of toilet seat or pan; safe, private and secure structure: walls / door / roof; improved & safe collection system (tank vault, pit); improved ventilation; improved waste evacuation 3 Availability of water for anal cleansing; safe disposal of materials used for anal cleansing; hand washing with soap; toilet cleaning 4 Improved septic tank functioning and emptying; sealed top of pit latrine to withstand flooding; household connection (sewerage) with treatment; sewers with non-leaking pipes and a drainage system that can handle heavy rains; wetlands or wastewater ponds 5 Urine separation, composting of feces, hygienization; use of human excreta products in commercial aquaculture, composting (fertilizer); biogas production (anaerobic digestion) 2.6 Uncertainty This study has faced several challenges in attempting to both meet scientific criteria and present evidence that is useful for national as well as local policy makers. In order to provide timely evidence on sanitation impact, the present study is based on entirely secondary information collected from a variety of sources, and combined with assumptions where necessary input data were missing. Therefore, in order to fill the gaps in evidence, several innovative and not previously tested methodologies were developed for this present study. Quantitative information were combined using the methodology outlined above and in Annex A to estimate the impacts of poor sanitation and the potential benefits of improving sanitation. A number of impacts were excluded from quantitative estimation, which are described in Chapter 3. Three major types of uncertainty surround the quantitative figures presented in this study: 1 Uncertainty in the input values for the estimation of overall economic impacts, such as in the epidemiological variables (for health) and economic variables such as market prices and economic values. In fact, there is a severe lack of data available from routine information systems or research studies to feed into the quantitative model. Hence, in the absence of these data, relationships were modeled and assumptions made. 2 Uncertainty in the attribution of the overall impact to poor sanitation. For example, when there are multiple sources of pollution, a portion of the overall economic impact estimated must be apportioned to the 29

34 STUDY METHODOLOGY OVERVIEW component of pollution being examined (e.g. domestic waste contribution to overall water pollution). A second example is the importance of poor sanitation in keeping away tourists from a country. 3 Uncertainty in the actual size of impact mitigation achievable. The variables with greatest importance for the quantitative results were evaluated further in one-way sensitivity analysis by varying a single input value over a reasonable range, to assess the impact on overall findings. Alternative values used in the sensitivity analysis are provided in Annex A7. 30
35 WSP-EAP Research Report February Economic Impact Results
36 ECONOMIC IMPACT RESULTS 3.1 Summary of economic impacts of poor sanitation Table 10 summarizes the estimated financial and economic impacts of poor sanitation and hygiene for each impact category in The total annual financial loss due to poor sanitation and hygiene is about US$160 million which is equivalent to US$12 per capita. It is noted that a substantial part of the financial loss due to poor sanitation and hygiene is accounted for by the water access costs (US$147 million) sharing more than 90% of total financial costs. The rest of financial losses are attributed to health impacts which amount to US$13 million. The annual economic loss from poor sanitation and hygiene is estimated at around US$448 million amounting to about 7.2% of the Cambodia s GDP in The per capita economic cost is around US$32 compared to the GDP per capita of about US$450. It should be noted that in contrast to financial losses where health-related losses are much less than water access costs, health cost (US$187 million) is the main contributor (42%) to the economic costs of poor sanitation and hygiene. The water costs are the next major loss in economic impacts of poor sanitation amounting to about US$149 million and making one third of the total costs. The economic loss of tourism due to poor sanitation and hygiene is roughly US$74 million which shares about 16% of the total economic costs. The economic value loss in time use attributed to poor sanitation access is US$38 million, sharing about 9% of the total costs. % Table 10. Financial and economic losses due to poor sanitation, 2005 Financial losses Economic losses Impact Value Per Value Per (million capita % (million capita US$) (US$) 1 US$) (US$) 1 Health costs Health care costs Productivity costs Premature death costs Water costs Drinking water Domestic water uses Fish production Other welfare Tourism TOTAL Per capita refers to the total value divided by the total population in 2005 Table 11 shows the financial and economic losses of poor sanitation by rural/urban breakdown. However, since not all impacts are available for the breakdown some costs are non-assigned to rural/urban (i.e. health, fish, and tourism). 5 Except tourism loss where 2006 figure is used. 32
37 ECONOMIC IMPACT RESULTS Table 11. Table showing rural / urban breakdown for the main impacts, 2005 Impact Value (million US$) Financial losses Per capita 1 (US$) % Value (million US$) Economic losses Per capita 1 (US$) Health costs Water costs Rural Urban Non-assigned Other welfare Rural Urban Tourism TOTAL Rural Urban Non-assigned Per capita loss for rural-urban breakdown and non-assigned is equal to loss divided by total population. % As well as quantified, monetized impacts, there are a number of other key impacts which have not been valued in this present study, and which should be taken into account in interpreting the quantitative impacts discussed above. These non-monetized impacts include suffering from disease, intangible aspects of environmental impacts (aesthetics) and other welfare, time loss from seeking private place for urination (especially women), loss from marine fisheries, the non-use value of clean water resources such as existence and bequest values, and the losses to wildlife from polluted water resources and an unclean environment. Other impacts with less clear linkages with poor sanitation include the use of water for irrigation purposes and hence agricultural productivity, the impact of poor sanitation on foreign direct investment, and impact of unimproved sanitation (and running water) in institutions which affect life decisions of the population, especially the decision of women to take employment and of girls to enroll in or complete school. Table 12 below shows the non-quantified impacts of poor sanitation. Together, the quantified and unquantified financial and economic losses will affect the overall economic situation in a country, including economic growth. The main effects are likely to be through sickness time and income loss associated with premature death, and household expenditure on health care and clean water, including water treatment. The production and sale of sanitation options can also give a stimulus to the local economy through local employment; and re-use of human and animal excreta can lead to cost savings and higher productivity at household level. Property prices also may rise due to better living standards brought by improved sanitation. However, given the weak empirical evidence on the direct economic effects of improved sanitation, this study did not move beyond a partial equilibrium analysis to examine redistributive effects. Therefore, the empirical link between poor sanitation and macro-economic indictors such as gross domestic product (GDP) is still not known. 33
38 ECONOMIC IMPACT RESULTS Table 12. Other non-quantified impacts of poor sanitation Impact Sub-impact Excluded items 1. Health Quality of life Sanitation-related diseases cause pain and suffering beyond the purely economic effects. Disability-adjusted life-years (DALY), which attempt to capture quality of life loss, indicate 2. Water resources 3. External environment 4. Other welfare Other sanitationrelated diseases Household water use Fish production Water management Irrigation Aesthetics Land value Intangible impacts Time loss Life decisions and absence from daily activities The following disease and health conditions have been excluded, but in some contexts are potentially important: 1. Helminthes 2. Reproductive tract infections for women bathing in dirty water 3. Dehydration resulting from low water consumption from lack of access to private latrines (especially women) 4. Specific health problems suffered by those working closely with waste products (sanitation workers, dump scavengers) 5. Health impacts due to flooding that are not in reported national health statistics 6. Education impacts of childhood malnutrition 7. Food poisoning due to contaminated fish (e.g. E Coli) 8. Animal and insect vectors of disease (e.g. rodents, mosquitos) 9. Animal health related to human sanitation 10. Avian influenza Household time spent treating drinking water, including boiling, maintaining rain water collection systems, replacing filters, etc. The study included only the value of recorded freshwater fish production. However, the following are not included: 1. Non-recorded marketed freshwater fish 2. Marine fish 3. Subsistence fishing losses 4. Nutrient losses Economic losses associated with flooding from lack of drainage Polluted surface water may lead to extraction of scarce groundwater, or use of polluted water has implications for plant growth, animal health, and eventually human health Welfare loss from population exposure to open sewers and open defecation Economic value of land made unusable by poor sanitation Welfare loss from lack of comfort, privacy, security, convenience, status, prestige Time for urination, especially women Poor sanitation in schools and the workplace affect daily attendance, especially of girls and women 1. Loss of time from temporary absence of women from workplace 2. Welfare loss from school absence 3. Work decisions and early drop-out of girls from school 5. Tourism Tourist sickness Expenditure by tourists becoming sick and welfare loss of sick tourists 6. Other Foreign direct investment Companies seeking to make investments may be affected in their decision, among other factors, by the sanitation situation in a country; tangible secondary evidence is however very limited. 34
39 ECONOMIC IMPACT RESULTS Economic growth results from the combination of many of the benefits listed above. The main effects are likely to be through lower disease rates, increased time availability, easier access to and reduced treatment of suitable water sources for domestic, agricultural and industrial use, and more tourism and foreign direct investment. The production and sale of sanitation options can also give a stimulus to the local economy through local employment; and re-use of human (and animal excreta) can lead to cost savings and higher productivity at household level. Property prices also may rise due to better living standards brought by improved sanitation. However, given the weak empirical evidence on the direct economic effects of improved sanitation, and the lack of studies linking local effects to the macro-economy, the empirical link between sanitation and macro-economic indictors such as gross domestic product (GDP) is not known. 3.2 Summary of economic gains from improved sanitation Besides looking at the economic loss due to poor sanitation and hygiene, it is also important to look into the possible economic gain from improved sanitation and hygiene. Five options are given in the Table 13 below where each option corresponds to the benefit only to some impact categories. In general, all of the costs measured in Section 3.1 can be averted from one or more or the improvement options; except that is, the health benefits, given that basic improved sanitation or hygiene only reduces by a proportion of 30-50% of the overall sanitation and hygiene related diseases. In addition, the results from the sanitation market studies (inputs and outputs) are presented in more detail here. From the table, it can be seen that: Hygiene practices bring US$6 million financial gain and US$84 million economic gain, through reducing by 45% the measured health impacts. Better physical access of latrines and more private as opposed to shared latrines and open defecation practice bring nearly US$38 million economic gain, through saving time for those whose time access is not already minimized. Moreover, the input market for construction of latrine leads to financial and economic benefits of US$0.3 million. Improved toilet system leads to more than US$4 million financial gain and US$60 million economic gain, mainly through the reduction by 32% of the measured health impacts. Sanitation markets are included under category C, leading to both significant financial and economic benefits of about US$1 million. Treatment or disposal of human excreta leads to US$147 million financial gain and close to US$223 million economic gain, reflecting the total reversal of the estimated losses due to water and tourism impacts of poor sanitation. The reuse of human excreta is estimated to lead to nearly US$2 million financial and economic gains where US$1.3 million is the input market benefit (biodigester construction) and the rest is the gain from the use of biogas for cooking and lighting. This estimate is based on relatively conservative assumptions about the numbers of households using biodigesters, and utilizing the commodity prices shown in Annex A6.3 and A6.4 35
40 ECONOMIC IMPACT RESULTS Table 13. Predicted financial and economic gains from improved sanitation Impact area (million US$) A B C D E Hygiene practices Latrine physical access Improved toilet system Treatment or disposal Reuse Fin. Econ. Fin. Econ. Fin. Econ. Fin. Econ. Fin. Econ. Health Health care Productivity Premature death Water Drinking water Domestic uses Fish production Other welfare Time use Tourism Tourist numbers Sanitation markets Input markets Output markets TOTAL Improved sanitation generally means improved physical access, improved toilet system and treatment or disposal, all of which have implications for health status. For the purposes of reporting, the sanitation benefits are included only under improved toilet system, to avoid confusion over double-counting. 2 Other welfare impacts discussed and presented in Chapter 4.5 are all presented here under latrine physical access but some of these are also likely due to improved toilet system. 3 Tourist numbers will also be related to hygiene practices and toilet systems used, but the benefits are reported here under treatment and disposal, as this has the major environmental implications. 4 All interventions involve a market value Given that sanitation improvements (see Table 4 in section 2.1) have several features of the above categories, it is possible to add together the savings associated with the categories above. For example, by installing a private sanitary pit latrine would lead to benefits A and B; and with sewage treatment would add D. Ecosan could lead to A, B, D and E. Adding hygiene interventions enhances (increases) the health effect from sanitation improvements alone. For example, research shows that hygiene interventions have an average 45% reduction in diseases, compared to 32% reduction for sanitation (latrine) interventions alone (see Annex A6.1). In practice, there exists uncertainty in the extent of savings, because in some cases the improvement is not fully effective in mitigating the costs, especially in the case of water resources: Water for drinking and domestic uses. The study apportioned sanitation-specific costs of water pollution using an attributable fraction, based on the release of BOD from different sources. However, this is an imperfect indicator, especially of household behavior in relation to mitigation measures concerning domestic water supply. Various extreme arguments could be put forward concerning the degree of costs mitigated. 36
41 ECONOMIC IMPACT RESULTS o On the one hand, it could be argued that households will still treat their water even in the absence of human waste and bacterial risk, due to habit, taste, and other water pollutants, both natural (e.g. silt) and manmade (e.g. pesticides, industry). Hence very few costs may in fact be mitigated through complete isolation or treatment of sewage. o On the other hand, the bacterial content of water is one of the major health risks from the majority of water sources, including groundwater. The absence of sewage release may make it less necessary for households to treat their water, depending on other types of pollutants in the water that can be effectively removed at the household level. It should also be noted that water sources used by treatment plants that contain sewage can increase considerably the unit costs of treatment, which are passed onto the consumer. Fish production. This study has found (a) considerable uncertainties in the link between water pollution from poor sanitation, dissolved oxygen levels, and fish production, and (b) weak routine information systems linking monitoring stations for water quality indicators with physical locations of fish farming. Hence, fish production impact was difficult to estimate scientifically; and by implication, it is difficult to know the expected gains to fish production from reducing the fecal load in fishing waters. On the other hand, the more direct link fish contamination through exposure to sewage and its fish and human health implications was not measured in this study, but could be a considerable impact associated with the isolation of human excreta. 3.3 Health impacts Poor sanitation and hygiene in Cambodia remains a substantial impact on health causing morbidity and deaths as shown in Table 14. It is estimated that the number of cases associated with poor sanitation and hygiene in 2005 totaled roughly more than 9.5 million cases. Of those cases, 97% are diarrheal diseases. Moreover, it is observed that the total deaths related to poor sanitation and hygiene is conservatively close to 10,000 in 2005, most of them are resulted from diarrheal diseases (67%), while the rest are from ALRI (18%), malaria (10%), and measles (4%) respectively. In addition to data on cases and deaths, these diseases can have other significant impacts on the quality of life of sufferers, in the sense that the pain and suffering of the diseases make people uneasy and uncomfortable. In more severe cases, the diseases can restrict the daily activities and cause economic costs. Other long-term effects of associated health problem can be also foreseen as having economic costs. For instance, malnutrition which is also sourced from diarrheal infections attributed to poor sanitation and hygiene may also affect children educational attainment and work performance in the future. Table 14. Summary health impacts by disease due to poor sanitation and hygiene Disease Cases Deaths Reported 1 Estimated Total 1 Reported 2 Estimated Total 1 Diarrheal diseases 621,353 9,364, ,600 Skin disease 101, , Malnutrition ALRI 50, , ,786 Measles Malaria 1,295 19, ,033 1 With adjustment for attribution to poor sanitation and hygiene 2 Without adjustment for attribution to poor sanitation and hygiene 37
42 ECONOMIC IMPACT RESULTS Table 15 presents the total costs of health care related to treatment seeking for diseases related to sanitation and hygiene. From the table, the health care cost related to poor sanitation and hygiene is nearly US$11 million for financial loss and more than US$13 million for economic loss. It is observed that health care cost involving private clinics is the highest loss, both financially and economically. It shares about 66% of the financial loss and about 53% of the economic loss. What is more, the diarrheal diseases which are strongly related to sanitation and hygiene appear to incur the largest economic cost among other diseases. It incurs financial losses of up to approximately US$10 million and economic losses of US$12 million. The latter shares roughly 92% of the total health care cost (economic) attributed to poor sanitation and hygiene. Table 15. Total health care costs by disease, 2005 Disease Financial costs (thousand US$) Public clinics Private clinics Total Public clinics Economic costs (thousand US$) Private clinics Transport Transport Selftreatment Diarrhea 789 6,810 2,288 9,887 2,041 6,810 2,288 1,161 12,300 Skin disease Malnutrition ALRI Measles Malaria Total 1,021 7,056 2,632 10,709 2,511 7,056 2,632 1,188 13,388 Total Table 16 presents the total costs of productivity related to days off daily activities for diseases related to sanitation and hygiene. It is noted that costs are incurred for all age groups. For children, the diseases may keep them away from school which has some economic costs. For adult population, the diseases will have financial and economic costs as they may lose their working time when getting sick. However, not all adults suffer direct financial implications by losing income due to sickness, as some may still be able to go to work despite the disease. In this case, only 70% of sick adults are assumed to directly lose income due to day taken off sick (see Annex A1.5 for further details). It can be observed from the table that the productivity loss due to poor sanitation and hygiene related diseases is roughly US$2.5 million financial loss, and US$5 million economic loss. It is also noteworthy that the economic cost induced by the loss of productivity mainly occurs among adults of over 15 (US$2.8 million) which accounts for nearly 55% of the total loss. This loss is followed by the productivity losses among under-five children and their caretakers which contribute about 37% to the total economic costs. In terms of disease, diarrhea appears to be the main disease incurring the highest economic cost amounting to 98% of total productivity cost. Table 16. Total productivity costs 1, 2005 Financial costs Economic costs, by age group (thousand US$) Disease (age group 15+) (thousand US$) Total Diarrhea 2,459 1, ,775 4,972 Skin disease Malnutrition ALRI Measles Malaria Total 2,459 1, ,775 5,070 1 Value of time is average wage approximated by average compensation of employees 2 Perspective of the household only actual earnings lost of working adults 38
43 ECONOMIC IMPACT RESULTS Table 17 presents the total costs of premature death from diseases related to sanitation and hygiene. The value of premature death is based on the human capital approach. The financial costs of premature death are assumed to be one year loss of income, for adults only. In this sense, it is estimated that premature death associated with poor sanitation and hygiene costs about US$168,000 in financial losses, and US$169 million in economic losses resulting from deaths of both children and adults. The financial loss of premature death is only caused by diarrhea as this involves only adults over 15 years of age, with malnutrition and malnutrition-related diseases for adults being omitted from the study. For the economic loss, however, the main disease leading to high premature death cost is diarrhea sharing about 67% of the total economic cost. The diseases which follow are those associated with malnourished children under five years such as ALRI (18%), malaria (11%), and measles (4%). Additionally, it can be noted that the premature death among under-five children imposes the highest economic cost among other age groups. According to the table below, it shares about 92% of the total economic cost. Regarding diarrheal deaths, the under-five age group appears to also impose the highest economic loss compared to other age groups amounting up to US$100 million while it is only US$13 million for other age groups combined. One of the reasons for the high cost of under-five death from diarrhea is the fact that the prevalence of diarrheal disease in the under-five is significantly higher than the over-five age group, while the value of life estimated from human capital approach is in a comparable range. Table 17. Total costs of premature death, using human capital approach, 2005 Financial costs Economic costs, by age group (thousand US$) Disease (age group 15+) (thousand US$) Total Diarrhea ,030 9,103 3, ,849 Skin disease Malnutrition ALRI - 30, ,767 Measles - 7, ,234 Malaria - 17, ,793 Total ,824 9,103 3, ,643 Figure 2 shows the variation in cost of premature death by using different values for premature death. The losses estimated using the human capital approach give the most conservative value. The willingness-to-pay approach using the value-of-statistical-life (VSL) estimated at purchasing power parity (PPP) with income elasticity 1.0 gives the highest estimate which is up to US$1.4 billion compared to only US$0.17 billion for human capital approach. The Willingness to Pay (WTP) approach estimated at official exchange rate (OER) with income elasticity of 0.6, 0.8, and 1.0 give the value of premature death costs of US$1.25, US$0.5, and US$0.2 billion respectively. Therefore, the losses are highly sensitive to the method used. 39
44 ECONOMIC IMPACT RESULTS Figure 2. Economic cost of premature death at different unit values for premature death 1 Total cost of premature death (million US$) 1,600 1,400 1,200 1, VSL (OER) with I.E. 1.0 VSL (OER) with I.E. 0.8 VSL (OER) with I.E. 0.6 VSL (PPP) with I.E. 1.0 Human capital approach 1 Refer to Table 19 for unit values used. VSL = Value of saved life; I.E. = income elasticity; OER = official exchange rate; PPP = purchasing power parity Table 18 shows a summary of the financial and economic costs of different health impacts due to poor sanitation and hygiene in Cambodia. The estimation shows that total health-related financial cost is US$13 million, while the economic cost is US$187 million. Health care cost accounts for more than 80% of the financial loss, while it accounts for only 7% in the economic loss. The majority of economic cost is accounted for by premature death which shares up to 90% (US$169 million) of the health-related economic costs. In terms of disease, diarrhea is the main financial loss accounting to 94% of the total financial losses. In addition, it is also a major contributor to economic costs amounting to nearly 70% of total costs. ALRI and malaria are the next contributors to the total economic losses sharing 17% and 10% of the total costs respectively. Table 18. Total health-related costs Disease Total financial costs (million US$) Total economic costs (million US$) HC PROD DEATH Total HC PROD DEATH Total Diarrhea Skin disease Malnutrition ALRI Measles Malaria Total Note: HC = Healthcare costs; PROD = Productivity costs; DEATH = Premature death costs Figure 3 shows the contribution of different costs to overall cost, by disease. It is seen that premature death is the main economic cost for diarrhea and diseases associated with malnutrition (indirect effects). More notably, the premature death takes the extremely high share for malnutrition-related diseases compared to other health-related costs. However, health care costs are the most important costs for malnutrition and skin diseases. It is also remarked that the losses which take patients or caretakers away from productive activities have mere contribution to the economic costs of any disease. 40
45 ECONOMIC IMPACT RESULTS Figure 3. Contribution of different costs to total cost, by disease 100% 80% 60% 40% 20% 0% Diarrhea Skin disease Direct Malnutrition Malnutrition related diseases DEATH PROD HC 3.4 Water resource impacts The economic impacts of polluted water resources depend on three main factors: the extent of water resources in the country, the release of polluting substances in water resources, and the actual or potential uses of water in the country. Table 19 presents a summary of the water resources in Cambodia. The Mekong River and Tonlé Sap lake are the main sources of water for both drinking water supply and freshwater fishing in the country. Table 19. Water resources in Cambodia Rivers & major canals Regions Length (km) Surface area (km2) Flow (m3 per second) Mekong River Plains 540 N/A Sesan River Plateau 252 N/A Sekong River Plateau N/A N/A Sre Pok River Plateau N/A N/A Tonlé Sap Lake Tonlé Sap N/A 13,000 (wet) 2,500 (dry) 66,700 (wet) 1,250 (dry) 1,125 (wet) (dry) 1 2,292 (wet) 428 (dry) 924 (wet) 241 (dry) 70 billion m 3 total volume Source: Ministry of Environment, Institute of Geography of Vietnamese Institute of Technology, Mekong Secretariat; 1 Voeun Sai Station Despite the fact that Cambodia has many water resources surface water, ground water and rain water most landbased water resources suffer from pollution due to human activities. The water bodies near the cities or populated areas are usually more polluted than the remote water body due to excessive discharge of pollutants generated by densely populated human settlements. To estimate the total pollution of water sources both surface water and ground water, Table 20 below gives the volume of the major polluting substances associated with human excreta. Based on the assumption of sewage leakage discussed in Annex A2.2, it can be estimated that there is more than 230 tons of feces and more than 2,300 m 3 of urine released to the water bodies every day. The release of human 41

46 ECONOMIC IMPACT RESULTS waste generates about 500 tons of BOD per day to the water bodies in the country. Moreover, more than 8,000 m 3 of gray water is discharged to water bodies every day through sewage system. Table 20. Daily release of polluting substances to inland and ground water bodies Region Total release (volume) 1 Polluting substances Feces (Tons) Urine (m 3 ) Graywater (m 3 ) BOD (Tons) Phnom Penh Plains , Tonlé Sap , Coastal , Plateau , Total 234 2,335 8, Assumption on sewage leakage is given in Table A22 All of the substances given above are considered the main pollutants to water resources from poor sanitation. However, given the large volume of water in the country, these pollutants may be partly diluted naturally. Despite this, the water quality of the surface water body is still unsafe for untreated consumption due to the presence of bacteria. Table 21 and 22 show the water quality measurement in Cambodia from various surface water sources from two different institutions, namely Phnom Penh Water Supply Authority (PPWSA) who supply drinking water to Phnom Penh citizens, and the Mekong River Commission (MRC) who tests water quality at different locations along the Mekong river and its tributaries. According to PPWSA data presented in Table 21, the DO levels at 3 different locations appear to vary from 3.4 to 5.5 mg/l. This low DO indicates the sign of pollution in the surface water bodies. Moreover, the presence of high thermotolerant coliform in the water proves that the water sources in Cambodia are contaminated by bacteria originating from human and animal feces. While the standard requires thermotolerant coliform be zero to make water safe to drink (See Annex 2.1 Table A21), the water bodies that are used to supply Phnom Penh citizens have the thermotolerant coliform ranging from 400 to 3,500 cfu/100ml in dry season and from 1,300 to 9,000 cfu/100ml in wet season. The amount of thermotolerant coliform also varies by location of water sources, and the closer the water sources to the cities the more is thermotolerant coliform concentrated. 42
47 ECONOMIC IMPACT RESULTS Table 21. Selected river water quality measurements in Cambodia from PPWSA sources, 2006 Location Chroy Changva Wet season Dry season Water body characteristics Mekong River (Upstream Phnom Penh) Water level: 2-10m Flow: m 3 /s Water level: 2-5m Flow: m 3 /s ph DO (mg/l) Water quality indicators TSS (mg/l) Total coliform (cfu/ 100ml) Thermotolerant coliform (cfu/ 100ml) ,121 1, , Chamkamon Bassac river (Downstream Phnom Penh) Wet season N/A 7.6 N/A ,750 2,994 Dry season N/A 7.4 N/A ,871 1,241 Phum Prek Tonlé Sap (Dual flow) 1 Wet season Water level: 2-9m Flow: m 3 /s ,509 8,693 Dry season N/A ,162 3,476 Source: PPWSA 2006 for water quality, and MoWRM for river characteristics 1 The flow direction of Tonlé Sap is from the Mekong toward the lake in wet season, and from the lake toward the Mekong in dry season. N/A refers to the fact that data are not available. Based on data from the Mekong River Commission (MRC) presented in Table 22, the DO levels at various water body locations vary from 5.1 to 7.5 mg/l in dry season and from 6.3 to 7.4 mg/l in wet season. Although this DO is still lower than the standard requirement (See Annex 2.1 Table A21), the values measured by MRC appear to be higher than that of PPWSA for the same water source location. This can be caused by the different time of test or location of sampling. The similar pattern that can be observed in the two data sources is that the Total Suspended Solid (TSS) in all water locations is higher in wet season than in dry season. This can be explained by the fact that in the wet season, due to flood and rain, more soil is flushed into the Mekong river thus leading to increased TSS. It is noted that TSS, although contributed by the release of human excreta, may be caused by the erosion as a result of deforestation in Cambodia and the upstream. 43
48 ECONOMIC IMPACT RESULTS Table 22. Selected water quality measurements in Cambodia, from the Mekong River Commission, 2005 Location and date Water body Characteristics ph Water quality indicators DO (mg/l) CODMN (mg/l) TSS (mg/l) Phnom Krom Tonlé Sap Lake Lake Wet season Dry season Prek Kdam Tonlé Sap (Dual flow) River Wet season Water level: 2-9m Flow: m 3 /s Dry season N/A N/A Kratie Mekong (upstream) River Wet season WL: 17-21m Flow: m3/s Dry season WL: 6-11m Flow: m3/s Chroy Changva Mekong (midstream) River Wet season Water level: 2-10m Flow: m 3 /s Dry season Water level: 2-5m Flow: m 3 /s Takhmao Bassac River Wet season Dry season Khaom Samnor Mekong (downstream) River Wet season Dry season Source: Mekong River Commission, 2005 One of the major impacts of polluted water in wells, springs, rivers and lakes is that populations and water supply agencies will have to treat water, or treat water more intensively, for safe human use. Alternatively, populations and water supply agencies can access cleaner water from more distant sources, thus increasing access costs. Those who do not take precautionary measures are exposed to higher risk of infectious disease, or poisoning due to chemical content. Table 23 shows the costs attributed to poor sanitation of access to drinking water, based on an assumed minimum daily intake of 4 liters per capita. It is also important to note that this attribution may overestimate the costs actually associated with poor sanitation, as in the absence of poor sanitation, the costs may not be reduced given there still exist other sources of water pollution. The table below indicates that, due to poor sanitation, the drinking water access costs nearly US$93 million financially and about US$94 million economically in Of all those costs, household water treatment costs have the largest share in both financial and economic costs, which are more than 85% of the total. The costs for purchased non-piped water appear to be the next contributors to financial and economic costs amounting to close to US$12 million (13% of total costs). The welfare loss of hauling water due to the polluted local source is roughly US$1 million. 44
49 ECONOMIC IMPACT RESULTS Table 23. Drinking water access costs Water source Financial (million US$) Economic (million US$) Value % Value Purchased piped water Rural Urban Purchased non-piped water Rural Urban Household water treatment Rural Urban Hauled water Rural Urban Total Rural Urban As well as water for drinking, water is required by households for basic living cooking, laundry, household cleaning and washing up of utensils, personal hygiene activities (showering, bathing), and sanitation (if water is used to flush waste away). The study used an estimated minimum requirement of 28 liters per person per day. However, since the volume of water used also depends on how people get the water, it is sensible to assume that those purchasing non-piped water need only 14 liters per person per day. This assumption will lead to a more conservative estimate of the domestic water access costs (see Annex A2.4). Households may in fact use more than this for these basic items, as well as for other purposes such as watering plants, domestic animals, leisure activities, and rituals. Table 24 shows the costs attributed to poor sanitation of accessing domestic water from improved water sources. Although there are not the same strict requirements for water quality, households still may walk further for improved water and pay companies to deliver or piped water for non-drinking domestic uses. In spite of this, it is uncommon for Cambodian people to treat their water for non-drinking purpose. From the table, it can be seen that the water access costs for domestic uses is roughly US$10 million in financial term and US$11 million in economic term. The purchase of non-piped water accounts for the majority in both financial costs and economic costs which shares about 88% and 79% successively of the respective costs. Purchased piped water constitutes 12% of financial losses and 11% of economic losses. Hauling water from distant sources also induces the welfare losses which worth of US$1.1 million contributing 10% to the total economic costs. 45
50 ECONOMIC IMPACT RESULTS Table 24. Water access costs for domestic uses (drinking water excluded) Water source Financial (million US$) Economic (million US$) Value % Value % Purchased piped water Rural Urban Purchased non-piped water Rural Urban Hauled water Rural Urban Total Rural Urban The third aspect of water quality assessed quantitatively is the potential impact of poor water quality on fish catch in inland (freshwater) water bodies. As stated above, Cambodia has abundant water resources which provide favorable conditions for fishing and aquaculture, and which makes the fishery sector a key economic sector in the country, with high contribution to GDP as well as to subsistence living. In Cambodia, all inland water sources are amenable for fish production. The Tonlé Sap lake is the water body with the highest yield in fish catch. According to the Economics Institute of Cambodia (EIC), the fishery sector contributes about US$525 million to the GDP in With the exported volume of 12,000 tons of fresh water fish in 2006, the export value is estimated to be worth about US$20 million. Table 25 below shows the actual value of fish catch in different regions compared with the predicted fish catch under optimal water conditions. A portion of fish catch is not reflected here due to the omission of subsistence fishing and fish caught and bartered locally. To evaluate the fish catch loss due to poor sanitation and hygiene, it is crudely assumed that the contribution of poor sanitation to water pollution is 65%. It is important to note that the DO value given in Table 25 is only indicative as it is based on the average DO for the latest available year. Indeed, MRC data on dissolved oxygen reflects a single day measurement per month; since the DO level may vary from one day to another, the monthly DO data are not necessarily fully reflective of average DO levels. Also, impact on fish is also determined by minimum DO levels reached, and for how long these levels remain, and therefore average DO levels are only a very crude indicator of the state of the water bodies for fish production. Furthermore, fish are affected by more than just DO, but other parameters such as temperature, water flow, water depth, and the availability of food also affect fish production. From the table, the fish loss from pollution due to poor sanitation is worth of roughly US$44 million. 46
51 ECONOMIC IMPACT RESULTS Table 25. Fish catch value current actual and estimated loss Estimated Region Actual value of Fish catch Dissolved Fish catch value of fish lost compared Oxygen in 2005 fish catch from poor to optimal (mg/l) (Tons) (million sanitation (%) US$) 1 (million US$) Plains Region 50, Phnom Penh , Kandal , Kampong Cham , Prey Veng , Takeo , Tonlé Sap Great Lake Region 78, Kampong Thom , Siem Reap , Banteay Meanchey , Battambang , Pursat , Kampong Chnang , Upper Mekong Region 5, Stung Treng , Kratie , Total inland fishery production 134, Source: MAFF for fish catch; MRC for Dissolved Oxygen 1 Estimation of fish value is based on Consumer Price Index Environmental impacts Based on interviews with stakeholders, it is confirmed that solid waste management in Cambodia has gradually been improved, although there is a lot more to be done to keep the country environmentally clean. Many areas of Cambodia s cities, including Phnom Penh, are still without adequate waste collection service. Many tons of wastes are dumped into rivers and ponds, burned, or left uncollected to be scattered by animals, thus blocking the drains and creating unsanitary conditions. Waste collection is relatively weak in outlying areas of the cities, and unplanned settlements that are home to thousands of the city s poorest families. Moreover, it is very common to see piles of waste at many market places dumped by the sellers and the households nearby. Besides, the official designated dump site of solid waste, particularly in Phnom Penh city where nearly 1,000 tons of waste is dumped everyday, has reached its capacity. This mismanagement of solid waste is known to cause an unpleasant living environment for many inhabitants. In addition, there are health hazards for the population from poorly disposed of solid waste, which until now has not been quantified. The present study, therefore, attempts to qualitatively assess the impacts of solid waste in terms of aesthetics and land quality. 47
52 ECONOMIC IMPACT RESULTS The greatest perceived impact of solid waste on aesthetics is the fact that waste produces odor, and spoils visual appearance, especially in towns and cities. In most towns and cities of Cambodia, household solid waste is usually disposed of in front of houses, on sidewalks, or in some cases on open land. Those wastes sometimes decompose prior to being picked up by waste collectors, thus producing bad smells to the surrounding environment. This polluted air quality creates unpleasant atmosphere to not only the households nearby, but also the pedestrians, the travelers, and particularly the tourists passing by the areas. In addition to the odor, the scattered wastes have damaged the visual aesthetics of many cities of the country, which make the cities less attractive to tourists (see Section 3.7). Besides household solid waste, the management of waste at most marketplaces has been very poor. In most cases, the wastes are untidily scattered around the sellers and at best loaded on the edge of their stall or in the entrance to the market. More often than not, those wastes produce bad odors and transform the market place into an unregulated dump sites for the households situated nearby. While a market should be a pleasant place which needs to be attractive to customers, the market with improper waste disposal keeps away its customers. This may have some economic losses to the sellers in the market. In addition to scattered household and market wastes, the impact of the so-called designated dumpsite on the nearby residents is even more severe. The ten-hectare dumpsite in Phnom Penh is situated not far from the residential areas. While bad odor from the dumpsite is disturbing the livelihood of the residents, the smoggy air pollution due to burning of waste can be harmful to the health of the residents as well as dumpsite scavengers. In addition, the dumpsite may contaminate ground water quality, and damage local land quality through the penetration and spillover of waste and chemically-contaminated water. It should be also noted that in Cambodia the designated dump sites are only available in urban areas. In rural areas, however, the waste is normally burnt or buried into the ground for disposal. It is argued that the land used for dump site is normally hard to convert to agriculture land. This is because the waste is usually mixed between the composted waste and the non-composted waste such as plastics and other materials. However, the conversion of the dump site for other selected non-agriculture purpose may be possible. Therefore, although the environmental impact is not easily quantifiable, its effects on human well-being, livelihood, and health are still considerable. Moreover, the loss of land value due to the unproductive post-dump site land may be significant. 3.6 Other welfare impacts According to a recent study by Water and Sanitation Program (WSP) in three selected provinces and Phnom Penh, it is found that hygiene and cleanliness is the main perceived benefits of latrine [7]. It is noted that although the study covered only a small number of provinces, it is stated that the rural and urban areas in those selected study sites are broadly representative of rural and urban areas of Cambodia considering socio-economic and environmental conditions. Based on the study, more than 80% of urban and 70% of rural citizens recognize that improved latrine will provide better hygiene and a generally clean environment for living (Figure 4). In addition, comfort, health improvement, safety, and convenience are the next most perceived benefits of improving latrine. It is also claimed that privacy, improved family status and prestige are other advantages of having a latrine at home. Referring to Figure 4 below, rural and urban people tend to have similar pattern of perception regarding the benefits of latrine. Based on the figure, however, there are less proportion of people in urban areas perceiving improved health and improved status/prestige than those in rural areas. For other perceived benefits, however, there is higher proportion of urban people than rural people. 48
53 ECONOMIC IMPACT RESULTS Figure 4. Perceived importance of improved latrine to households Hygiene/clean More comfortable Improved health Improved safety Convenience/save time More privacy %Urban % Rural Improved status/prestige 0% 10% 20% 30% 40% 50% 60% 70% 80% 90% Source: Demand assessment for sanitary latrines in rural and urban areas of Cambodia, 2007 [7] As indicated in the WSP study, a latrine is perceived to save time for around 40% of Cambodian households [7]. Based on the time saving assumptions used in this present study, the total time spent in accessing for both open defecation and shared facility is calculated. According to Table 26, it is estimated that the total annual (2005) economic value lost of time spent accessing open defecation is about US$37.5 million and of shared facility is roughly US$0.7 million. These costs include both the adults and children s welfare losses assuming adult s time value is 30% of income, and children s time value is 50% of adult s. It should be noted that the evaluation of toilet access time provided below does not include the time for urination which can be a time-consuming daily activity for women. If this has been included, the access time cost would be much higher than the current estimate. Table 26. Annual time spent accessing latrines Location Population size (million) Shared facility 1 Open defecation Total access time (million hours) Shared facility Open defecation Shared facility Value (million US$) Open defecation Rural Urban Total Refers to population with shared facilities who are assumed to have inadequate toilet. Using by many people, the shared facilities cause waiting time to users. Besides access time loss, poor sanitation in schools also has potential implications for participation of girls in education rates of enrolment, rates of school drop-out, and absenteeism. While there are many different reasons for school drop-out among school girls, the lack of toilet facility at school is potentially one of the reasons. However, according to the information collected, this factor has not been examined previously in Cambodia. Hence this current study attempts to explore this relationship by comparing across provinces the drop-out rate with absence of latrines in schools. According the Figure 5 below, it is interesting to note that the drop-out rates among school girls are high in the province with high rate of without-toilet schools. It can be noticed also from the figure that the Total 49
54 ECONOMIC IMPACT RESULTS impact tends to be more sensitive for secondary school students as the drop-out rate is higher than that of the primary school students. This can be explained by the fact that when the girls are getting older, more privacy for toilet going is needed. It can be noted that in addition to Cambodia s cultural values towards toilet-going, the lack of latrines at schools causes difficulties for female adolescents after menstruation has begun; hence lack of privacy for toilet-going during their the menstruation period may cause absences and eventually be a determining factor, among others, for female drop-out of school in Cambodia. Therefore, although this is not easily quantified, the fact that girls cannot participate actively in the society will likely undermine their ability to independently make income in the future leading to various social problems and economic slow-down. Figure 5. Female school drop-out rate vs. school sanitation Drop-out rate (%) Primary school Secondary school % of school without latrine Source: Ministry of Education Youth and Sports, 2006 Besides school sanitation problem, there are many other factors such as budget allocation by government, school distance, poor age-appropriate entry, etc. which may explain the drop-out of school among pupils. The inadequate budget allocation to the education sector has led to little improvement in education system discouraging students from going to school. The number of schools is yet to be enough to accommodate the increasing number of population making classroom overcrowded with the pupil-class ratio of 43 nationwide in In addition, many schools being distant from the communities coupled with poor road infrastructure contribute to high drop-out rate of students, especially among female. Not only does poor sanitation negatively impact on education sector, but also on workplace where adequate sanitation and hygiene facility is important. It is recognized that poor sanitation affects the health of workers or employees, which in turn reduces the productivity of workers 6. Therefore, while poor health negatively affects the quality of life of workers, the reduced productivity may have some economic costs for the employers and the country as a whole. In addition to poor toilets at schools and workplaces, public toilets in market places are often unpleasant for their unhygienic condition and odor. This unfavorable situation mainly affects the welfare of the sellers who spend most of their daytime in the market, and frequently use those public toilets. 6 An interview with an official at the Ministry of Labor and Vocational Training 50
55 ECONOMIC IMPACT RESULTS 3.7 Tourism impacts The growth in the number of tourist arrivals has contributed to the recent high economic growth in Cambodia [8]. The share of tourism in GDP has expanded from 11% in 2004 to nearly 15% in In absolute term, income from tourism has quickly grown from only US$580 million in 2004 to more than US$1 billion in In addition, the tourism sector has provided employment to 225,000 people in Cambodia contributing to about 3% of total employment in It is also seen that in addition to the increasing number of tourist arrivals, the average daily expenditure per tourist has been also increasing from US$87 in 2004 to US$95 in The average length of stay has also increased from 6.3 days per tourist in 2004 to 6.5 days in In addition, private investment in tourism sector has experienced sharp increase during the past few years. The total private investment reached US$352 million in 2006 which is more than three times the investment in 2005 and more than six times that in Table 27 below shows the importance of the tourism sector in Cambodia. Table 27. Volume and importance of tourist sector in Cambodia Variable Visitors arrivals to Cambodia by country of residence (million) ASEAN 183, , ,459 Asia & Oceania 413, , ,967 Europe 242, , ,194 The Americas 122, , ,429 Africa & Middle East 26,017 76,644 80,301 Others 6,000 Preah Vihear 1 67,843 88, ,691 Domestic tourists 4,251,270 5,278,113 7,901,039 Av. Expenditure per tourist (US$) Average length of stay (days) Tourist income total (million US$) As % of GDP 10.9% 13.3% 14.6% Private sector investment in tourism- fixed assets (million US$) Establishments supporting tourism Hotel Guesthouse Restaurants Massages Sporting Clubs Souvenir shops Travel agency and Tour operator Employment in tourism 180, ,000 - As % total employment - 3% Source: Ministry of Tourism 1 Preah Vihear is a tourism attraction (temple) on the Cambodian-Thai border. Most tourists come to this area through Thailand as road infrastructure in Cambodian side is less accessible. 51
56 ECONOMIC IMPACT RESULTS Given the tourism growth and its potential growth in the near future, it is important to address some of the challenges facing the tourism growth in Cambodia. One of them is sanitation. Poor sanitation in the country generally, and in tourist sites specifically, can have important implications on number of tourists visiting the country and their length of stay. Also, once tourists are on-site, they may get sick from a sanitation or hygiene-related disease, and thus experience a reduction in enjoyment of their holiday. Getting sick is a bad experience in itself, but it also wastes time in their holiday, and may incur some expenses related to treatment. Besides this, tourists having their enjoyment with the environment may be also spoiled due to bad sights and smells, if the area is polluted by human waste or solid waste. So, the tourists will be discouraged to come again, or the bad experience is spread among their friends and families which, in the long-run, results in less tourists coming to the country. According to Cambodia Association of Travel Agents (CATA), it is important that attractive places with high tourism potential be developed first. If the tourist places are not clean, less tourists will visit or tourists will be discouraged to come back again, so people living in that area will earn less income for their living. It is also highlighted that a common health problem occurring among most tourists in Cambodia is diarrhea which is related to unhygienic practice and poor food preparation in the country. Table 28 below shows some estimates for potential economic impacts nationwide of lower tourist number attributed to poor sanitation and hygiene. However, there is no information on the attribution of tourism to sanitation. In this case, it is assumed that the attribution of lower than optimal tourist hotel occupancy rates to poor sanitation is 10%. The annual tourist number increase is 20% and the target occupancy rate is 80% (see Annex A5.3 for further details). The economic cost is estimated using the gap between the current and potential tourist numbers through a faster growth rate in tourist numbers due in part to improved sanitation. Moreover, the annual discount rate of 3% is assumed in the estimation of present value of economic impacts. In this case, the economic cost is about US$74 million. It should be noted that the economic cost of the number of tourists getting sick attributed to poor sanitation is not evaluated in this study due to lack of data. Yet, it can be assumed that the fact that tourists falling sick will undermine Cambodia s tourism prospects which, in the long-run, will affect the country s economy as a whole. Table 28. Economic impact of lower tourist numbers Region Current tourism value (million US$) Hotel occupancy rate (%) Current Target Potential value (Million US$) Attribution to sanitation Annual economic loss 1 (million US$) Cambodia 1, ,786 10% 73.7 Source: Ministry of Tourism 1 Calculated as the gap between current and potential, multiplied by the attribution to sanitation 3.8 Sanitation markets Table 29 below shows the potential annual market size for sanitation inputs, based on market prices. From the table, the total annual input market value is about US$2.8 million including both labor and materials. It is noteworthy that the input market value of the EcoSan (biodigester plant construction) is very high compared to others sharing about 45% of the total input market value. It is also important to note that there is more economic gain than just the financial gain given in Table 29 below. This can be explained by the fact that once there is a need to improve latrine, more employment is generated for latrine providers and builders. This employment generation will provide income opportunity for local people which benefits the community and the country as a whole. 52
57 ECONOMIC IMPACT RESULTS Table 29. Annual sanitation input market values Variable Simple pit latrine VIP Market value (thousand US$) Septic tank EcoSan (Biodigester Plant) 1 Piped sewer connection Households receiving each improvement 16,171 8,085 8,085 4,225 8,085 Total value , ,823.4 Superstructure Slab Underground This involves only with the construction of the biodigester plant. The biodigester plant functions with the use of animal dung and human excreta. Table 30 below shows the potential annual benefits of sanitation outputs (biogas), based on the cash saving by using biogas. This gain is mainly through the own use of biogas and not from the sale, as biogas is currently not commercially practical. In general, the total annual financial gain from biogas (cooking and lighting) is about US$577,500. This value is also considered as the economic gain of biogas from EcoSan. It is noted that economic benefit should be actually more than the financial one if the time spent on collecting firewood, especially in rural areas, and the replacement of chemical fertilizer by biodigester s products are included in the estimation. Table 30. Annual sanitation output market values Biogas (thousand US$) Annual total value for biogas (thousand US$) Sales of gas and sludge Own use Financial Economic Considering the potential input and output market, it is estimated that the annual economic gains from combined input and output market may be US$3.4 million. This gain is spread between input US$2.8 million and output US$0.6 million. While input market, in this sense, refers to the possible construction of sanitation facilities and biodigester plants, output market is for the reuse of biogas produced by animal and human waste. 3.9 Sensitivity analysis The present study is based on secondary information, which was combined in a model to estimate the impacts of poor sanitation and the potential benefits of improving sanitation. Two major types of uncertainty surround the figures presented above: Uncertainty in the values and assumptions used for the included variables (data uncertainty) Uncertainty due to the fact that some hypothesized impacts were not included ( model uncertainty) Table 31 and 32 below show the sensitivity analysis of the economic impact results based on the uncertainty of economic variables and the attributable fractions. For Table 31, the high estimate is assumed to be the highest value corresponding to each of the economic variables evaluated for uncertainty, while low estimate is considered as the lowest range of the selected economic variables. In Table 32, the high and low estimates correspond to the highest and lowest values respectively of economic impacts given the assumed highest possible of attributable fraction. The variable values used in the sensitivity analysis are given in Table A34 and A35 in Annex A7. Based on Table 31, the estimate of financial loss of health attributed to poor sanitation and hygiene ranges from US$11 million to US$15 million with base case US$13 million, and the economic loss ranges from US$149 million to Total 53
58 ECONOMIC IMPACT RESULTS nearly US$1.3 billion with base case US$187 million. This range actually varies based on the assumption of diarrheal incidence, time value of adults and children as well as the estimation of premature death cost. For water pollution losses, the sensitivity analysis is based on different assumptions of the relationship between fish catch and dissolved oxygen levels. In this case, while the lowest estimate of economic impact is US$108 million for the case where fish is less affected by low DO, the highest estimate is US$195 million where fish is more affected by low DO. The base case of economic cost of water access is about US$149 million. It is also seen from the table that the economic cost of time loss for improper toilet going ranges from US$20 million to US$57 million (base case US$38 million). This variation is largely influenced by the assumption on time spent for journeying to open defecation site, and the value of time used for adults and children. In addition, the tourism (economic) impact may range from US$18 million to US$89 million with base case of US$74 million. This range is attributed to the assumption on the prospects of tourism growth, and hotel occupancy rate in the country. Among all the above variables, health impacts have the largest variation of economic costs. This is mainly influenced by the different methods used for the estimation of premature death which provides significant variation in death costs. Table 31. Results of one-way sensitivity analysis economic variables Variables selected Financial (million US$) Low Base case 1 High Low Economic (million US$) Base case 1 Health Diarrheal incidence Hourly value of non-income earning time economic only Hourly value of productive time for children Premature death ,276.4 Water Fish production impact Other welfare Time access Value of time Tourism Future growth in tourist number Base case shows impact-specific results i.e. under the health impacts, the base case shows the total health impacts; under the water impacts, base case shows total water impacts only In Table 32, high estimates show the economic impact resulting from assuming the highest attribution of each variable to poor sanitation and hygiene. Similarly, low estimates are those resulting from assuming the lowest attribution (see Table A35). It is seen that different assumptions on attribution give different impact values. Health impact costs vary from US$11 million to US$14 million financial cost, and US$149 million to US$202 million economic cost. The water pollution related costs may range from US$138 million to US$153 million in economic values. The impacts of inadequate sanitation and hygiene on tourism also vary from US$37 million to US$111 million depending on how sanitation and hygiene situation affects tourists visiting Cambodia. High 54
59 ECONOMIC IMPACT RESULTS Table 32. Results of one-way sensitivity analysis sanitation links Financial (million US$) Economic (million US$) Variables selected Base Low case High Low Base case High Health Disease incidence attributed to poor sanitation and hygiene (diarrhea) Water Water pollution attributed to poor sanitation Tourism Tourist numbers impact attributed to poor sanitation Table 33 below shows the range of economic gains of impact mitigation. The high estimate refers to the highest economic gain based on the highest effectiveness of mitigation measure, and vice versa for low estimate (see Table A36). According to the table below, the economic gains from improving sanitation and hygiene practice strongly depend on how mitigation measure can reduce the impact. Based on different assumption of achievable impacts, it is estimated that the gain in health improvement ranges from nearly US$2 million to US$8 million financially, and from US$24 million to US$112 million economically. For water cost gain, the range is between US$119 million to US$147 million in financial gain, and between US$121 million and US$149 million in economic gain. The economic gain of tourism is estimated to range from US$52 million to US$74 million. The economic gain in sanitation market also values from US$3 million to US$3.5 million according to the number of households using bio-digester. Table 33. Results of one-way sensitivity analysis impact mitigation Variables selected Low Financial (million US$) Base case 1 High Low Economic (million US$) Base case 1 Health Impact mitigation sanitation Impact mitigation hygiene (relative risk) Water Water pollution impact on drinking water N/A N/A Water pollution impact on fish production N/A N/A Tourism Tourist numbers increased with improved sanitation - - N/A N/A Sanitation markets Sanitation output coverage (households using biodigester) Base case shows impact-specific results i.e. under the health impacts, the base case shows the total health impacts; under the water impacts, base case shows total water impacts only N/A Not tested Based on sensitivity analysis above, it is clear that the economic impacts of any impact-specific variable fall somewhere in the range provided in the tables above between the low and high range. This range undoubtedly affects the overall economic impacts meaning that the estimated economic impacts are largely affected by the underlying assumption of some variables which are, due to lack of scientific evidence, uncertain in nature. In the impact mitigation analysis, the range of economic cost mitigated is also given in a range which is heavily based on the effectiveness of mitigation measures. High 55
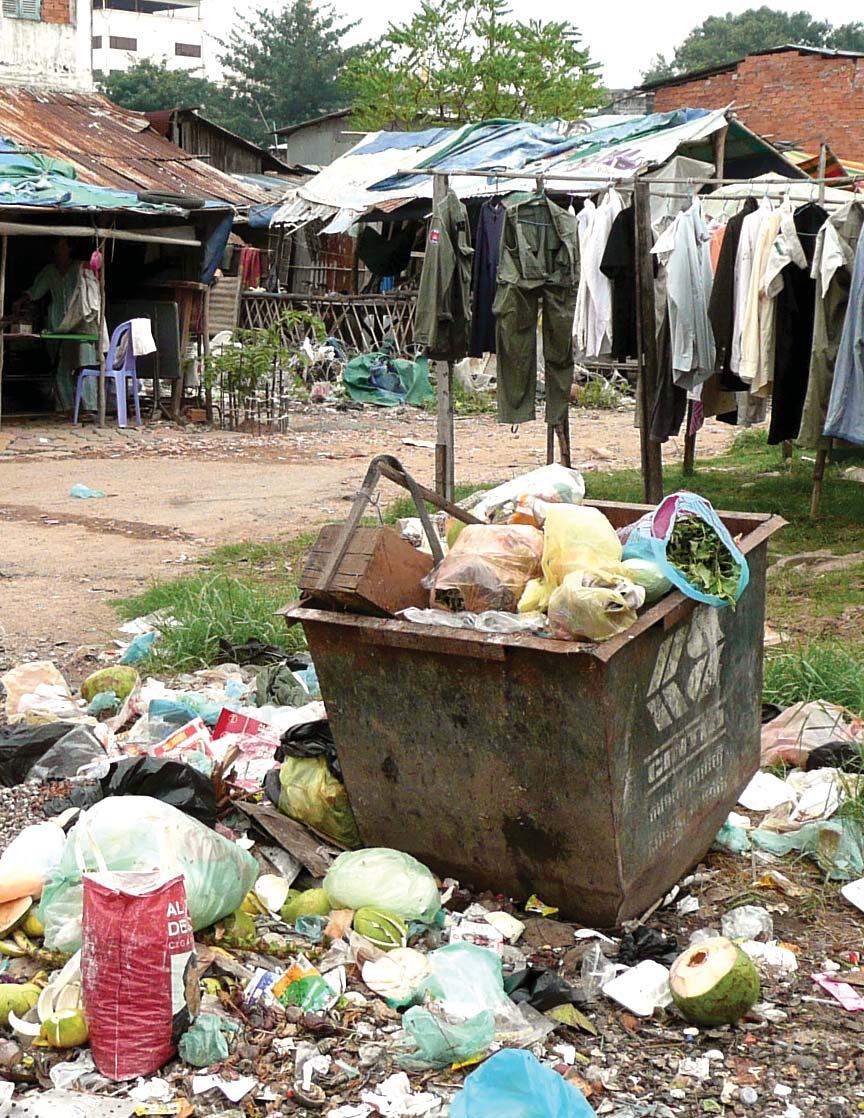
60
61 Discussion, Conclusions and 4Recommendations WSP-EAP Research Report February 2008
62 DISCUSSION, CONCLUSIONS AND RECOMMENDATIONS 4.1 Discussion Overview and interpretation of main results The impact evaluation given in the study has clearly highlighted the economic costs of poor sanitation and hygiene in Cambodia. The impacts which are included in the study are health impacts, water resource impacts, other welfare impacts, and tourism impacts. It is estimated that the total financial loss and economic loss due to poor sanitation and hygiene cost the country about US$160 million and US$448 million respectively in This economic loss amounts to nearly 7.2% of the GDP in Per capita loss due to poor sanitation and hygiene is over US$32 in economic terms and nearly US$12 in financial terms. While the per capita economic loss is equivalent to five weeks of average wage loss, the financial loss represents about nearly two weeks of wage loss of a working adult. Moreover, at the household level, the annual economic and financial loss amounts roughly to US$160 and US$60 per household respectively. It should be noted that although the study uses the best available secondary data to estimate impacts of poor sanitation and hygiene, there is considerable uncertainty associated with these results. In this sense, to avoid overestimation of the losses associated with poor sanitation and hygiene, the study uses conservative input values. For some impacts, the basic data was missing or contained uncertainties for the estimation of the total impact. Therefore, the values such as some attributable fractions are more a matter of opinion and expert judgment than one of scientific proof. In addition, it should also be noted that the applied methodology was developed for the present study, with only limited peer review and experience to validate the results. The majority of economic loss is due to the health problem which costs the affected people the spending on health care, the loss in productive time, and the loss due to premature death. It can be remarkable that the economic cost due to premature death alone is about US$170 million taking about 38% of the total economic cost meaning that a lot need to be done to prevent the death from sanitation and hygiene related diseases. In the financial loss, however, premature death cost appears to be the lowest which amounts to only US$0.2 million. This is because the financial loss of premature death refers only to the short-term household income loss of adults for one year. It is also important to note that the health problem associated with poor sanitation and hygiene is normally much more diverse than those included in the study. The non-inclusion of other diseases such as helminthes, hepatitis A, trachoma, etc will underestimate the impacts of sanitation on health-related costs presented in this study. Besides health-related costs, water costs are the next major contributor of economic costs followed by tourism loss, and access time loss. The water pollution related cost is estimated to be nearly US$150 million annually. It can be noted that poor sanitation has accumulated the pollution in the water source which is not safe for drinking and other domestic use, and not favorable for fish production. Polluted water costs the consumers and users the energy for treatment or the purchase of other sources as well as the time accessing cleaner water sources which may be farther than the local sources. In this regard, the cost accessing drinking water and domestic water is totaling US$105 million being 70% of the water costs. Besides, the cost of lower fish production is also significant which amounts to nearly 10% of the total economic cost and 30% of the water costs. It should be noted that if the nutrient loss from the loss of fish production is included in the estimation, the economic cost would be higher. In this sense, while fish is the main nutrient for most Cambodian people, this cost highlights the importance of the impacts of sanitation on water resource. In estimating financial losses, it is revealed that the water resource impacts of sanitation stand to be the highest in the total financial costs which amounts to US$147 million sharing more than 90% of total financial losses. This huge loss is mainly due to the impacts on drinking water followed by fish production. Despite the results, the overall assumption of contribution of sanitation to water resource pollution largely influences the results, which is 65% in this study. The losses from lower tourism potential are the other economic losses, which accounts for over 16% of the total economic cost (US$74 million). It is important to also note that the impacts of tourism loss would be more significant, 58
63 DISCUSSION, CONCLUSIONS AND RECOMMENDATIONS if the welfare loss of tourists is included. A point that should be noted in this study is that the estimation of economic impacts of tourism due to sanitation are mainly made based on an assumption of optimal occupancy rate and the potential scenario of tourism growth. Moreover, the estimation is drawn based heavily on an assumption of 10% attribution of poor sanitation and hygiene on tourist number reduction. The economic cost of poor access (access time lost) to sanitation is about US$38 million sharing nearly 9% of the total economic costs. It is noted that this economic cost of other welfare impacts refers only to the time used for toilet going for those who do not have their own toilet. There are other dimensions of welfare losses which have not been quantified in this study such as privacy, security, prestige, and so on. If these losses are quantified, then the economic cost of welfare impacts would be more significant. The economic gains from improved sanitation and hygiene can be achieved through different improvement options: 1) hygiene practice, 2) latrine physical access, 3) toilet system, 4) treatment or disposal, and 5) reuse of waste (animal dung). However, it is important noting that a program aiming at improving sanitation and hygiene may cover a number of options above. In other word, the options above may be implemented together. However, this study identifies which component of sanitation and hygiene improvements are expected to bring the greatest benefits. In option 1 where the benefit is mainly on health improvement, the economic benefit from the improvement is about US$84 million and the financial benefit is US$6 million. For option 2, however, the benefit in terms of time use for toilet going and input markets is totaling US$39 million. While more than US$38 million (99%) in this cost comes from the time use loss, the input market is only US$0.3 million. Option 3 involving the improvement of toilet system can induce economic gains for health and input market which amounts to US$61 million for economic gains and US$6 million for financial gains. Option 4 which mitigates impacts on water pollution and tourism can provide economic gains of up to US$223 million and financial gains of US$147 million. Option 5 relates to the input and output market of waste can induce gains of US$1.8 million both economically and financially. This gain is from the input market for biodigester s builders and household saving by using biogas. It should be noted that, except health benefits, those gains may be over estimated due to the assumption that the improvement will lead to 100% reduction of loss, which in reality may not be achievable. An important point to note in the present study is that throughout the presentation of results, distinction has been made between financial losses and economic losses. While attempts were made to follow conventions used in economic evaluation techniques, it was in practice difficult to distinguish between financial and economic. Whether a loss is felt as a real financial cost (involving immediate monetary transaction) or as affecting resource use and longterm behavior, and hence income, is largely context-specific, which could not be fully reflected in a methodology that was developed. Hence, policy makers should interpret with particular caution the financial cost estimates, which would not necessarily lead to a changed financial situation in the short term if sanitation is improved Policy implications of the study results As shown in the present study, sanitation (and hygiene) are strongly linked or associated with other development issues related to Cambodia Millennium Development Goals (CMDG). Improved sanitation has positive effects on child and adult health, gender equality, hunger, environmental sustainability, and water resources (clean drinking water). It is proved that poor sanitation and hygiene cause wide range of and huge economic costs to the country. Therefore, it is important that sanitation receives greater attention from Cambodian policy makers as well as other stakeholders. Since lack of appropriate latrine is mainly the rural phenomenon, these losses are concentrated in rural areas which host more than 90% of the poor. While those people already have very small income, the economic costs attributed to poor sanitation and hygiene will impose more burdens hampering them moving out of poverty. 59
64 DISCUSSION, CONCLUSIONS AND RECOMMENDATIONS Given that poor sanitation has multi-dimensional impacts, various policy makers of different institutions need to work together. In this sense, programs to improve sanitation should involve various stakeholders working on different sectors such as health, rural development, water resource management, education, tourism, and environment, among others. Although these sectors work on different issues, they are highly complimentary. For instance, to improve hygiene practice among people, it is important that health sector, education sector, and rural development sector jointly work on promoting hand washing. In this way, the cooperation across sectors will lead to optimal achievement of improved sanitation and hygiene in Cambodia. Therefore, a clear strategy and actual implementation of that strategy to improve sanitation, particularly in rural areas are very much needed. More importantly, it is also crucial that improving sanitation and hygiene be part of the strategies to sustainable poverty alleviation in Cambodia. In this regard, strongly integrating sanitation in the National Strategic Development Plan (NSDP) is one the key priority area Study weaknesses Although the study attempts to follow scientific methods, this study is conducted using mainly official secondary data and statistics as well as a number of key assumptions, which is likely to lead to imprecision in economic impact estimation. Moreover, some sub-impacts were not included in the quantitative estimates due to the lack of information and data. Therefore, the results presented in this study may be both overestimated (due to incorrect data inputs and assumptions) as well as underestimated (due to omission of impacts). In terms of health impact, there are more diseases than those included in this study due to the fact that they are not available in the government reporting system. In addition, the attribution fraction of skin disease to poor sanitation and hygiene is crudely assumed which can lead to bias. For water resource impact, fish production impact is largely based on a modeled relationship between fish production and DO level. On the other hand, the attributable fraction of water pollution to poor sanitation used in the estimation is also based on expert opinion. In the estimation of impact of time use in other welfare impacts, the present study uses the productive time value in the evaluation of economic loss of time loss. In other word, the study tends to assume that the time that people are journeying to toilet can be used in a productive way although it is not necessarily true in real life. This time can instead be used for other leisure activities, rather than the productive ones, which may have less economic value. While estimating impact on tourism, the study attempts to assume the optimal occupancy rate of tourism which is not likely achievable despite the presence of adequate sanitation condition. To offset these limitations, the study has included several sensitivity analyses to examine the consequence of different assumptions Gender Besides economic cost, poor sanitation is also likely to have impacts on gender in Cambodia as it may constrain women from getting a better employment. While many more men are moving into a better-paid position, women are still limited to garment industry and other informal sectors 7 requiring less skill. This phenomenon can be explained by the fact that most men are better educated than women so that the chance for women to compete with men for a well-paid job is very low. In this sense, it is important to see what factors influence girls to be absent from or drop out of school, and to what extent poor sanitation influences their choices. This impact may be more apparent when girls get older (secondary school girls). With the cultural value, Cambodian girls and women find themselves more difficult than men to go to the open field for practicing defecation, especially at the day time at schools or workplace. In this case, in addition to 7 0,,contentMDK: ~menuPK:502969~pagePK: ~piPK: ~theSitePK:502940,00.html 60
65 DISCUSSION, CONCLUSIONS AND RECOMMENDATIONS the family s poverty and distance from school, the lack of latrine at school can worsen the girls motivation to go to school. The less girls going to school, the less chance they get for better job opportunity and the greater the gender inequality becomes visible. Given this sequence of reasons, it is always worth to address the poor sanitation problem, particularly in schools, work places, and public places, if Cambodia is to achieve greater gender equality in the society. 4.2 Conclusions The study highlights the significance of the economic costs of the poor sanitation with the range of US$448 million, which currently lags behind other development in Cambodia. While the traditional thought of the impact of poor sanitation is mainly on health, this study shows that there are other dimensions beyond health impact, i.e. water, welfare, and tourism. Those impacts are also substantial in economic costs although not comparable to the health impact. It is found that, except health, the next major impacts of poor sanitation are water resource and tourism impact. Another impact which is not significant in economic terms but is important to the welfare of the people is access time loss and other welfare impacts. Moreover, the study also analyzes the flip side of the coin in showing the potential benefits of improving sanitation and hygiene through various options. It is seen that each option will provide different benefits in relation to the impact it mitigates. In the light of the findings, the study findings should emphasize the point that sanitation is not a sole health issue, but a cross-sectoral issue which need participation of all stakeholders. As well as the health sector, there is a role to play for those involved in other sanitation-related sectors such as rural development, water resource management, education, tourism, and gender, among others. In this sense, a policy to address sanitation effectively can be done through a well coordinated effort among the institutions mentioned. 4.3 Recommendations The central aim of this present study was to generate an evidence base to enable recommendations to be made for improved sanitation policies. This study has identified a broad range of impacts of poor sanitation, and quantified those impacts most amenable to secondary analysis. The following policy recommendations are based on eight major findings of the study: Major finding 1. Poor sanitation causes significant losses to the national economy This study has found that poor sanitation is responsible for at least US$448 million economic losses per year in Cambodia or an average of 7.2% of annual GDP. Of these costs, at least US$160 million are financial in nature (2.5% of GDP), involving additional expenditure or actual income loss for the population. In addition to these quantified impacts, a range of other negative economic and social effects of poor sanitation result. By improving sanitation, significant proportion of socio-economic impacts is mitigated. Recommendation 1. Decision makers from various sectors are advised to act now Sanitation players are advised to act now, otherwise the negative impacts of poor sanitation will increase over time. The Government of Cambodia and other stakeholders should jointly reassess the current and planned spending levels in the sanitation and related sectors, covering health, water resources, environment, rural and urban planning and development, fisheries, and tourism. Increased political importance and budget allocations should be given to sanitation. Sanitation decision makers should use an evidence-based approach to design efficient sanitation policies and implementation strategies, to increase value-for-money from public and private investments into sanitation. 61
66 DISCUSSION, CONCLUSIONS AND RECOMMENDATIONS Major finding 2. Poor sanitation has greater impact on the poor and vulnerable A considerable socio-economic burden of poor sanitation falls on the population currently without improved sanitation health impacts, time access, water pollution, aesthetics, and land use hence causing inequities in society. The population group unserved with improved sanitation tends to be the poorer and more vulnerable members of society. A disproportionate share of the burden falls on women, children and the elderly, especially health burden, intangible welfare impacts and life decisions. Recommendation 2. Governments must define and target the needs of priority groups Governments should give priority to the populations with no latrine, recognizing that effective demand may be low in these groups due to low incomes and poor awareness of the benefits of investing in sanitation. As well as stimulating demand through public health and latrine advocacy messages, governments should target programs, financing mechanisms and any subsidies to the most disadvantaged population groups. Major finding 3. Negative impacts result from several poor sanitary practices Economic impacts occur not just through the use of unimproved latrines (CMDG target), but also through poor hygiene practices, poor isolation of wastewater from the environment and water sources, and poor broader environmental sanitation. Cambodia tends to fall short of meeting broader environmental standards. Recommendation 3. Players should broaden the scope of sanitation beyond latrines Investments should not be made just in sanitation hardware programs, but in improved sludge, water and solid waste management, and in hygiene programs to raise population awareness on personal and community hygiene issues. Major finding 4. Health related economic impacts take a significant toll on society This study has confirmed that the major and most tangible impact of poor sanitation is an increased risk of infectious disease and premature death. In Cambodia, of those diseases included in this study, at least 10 million disease episodes and 10,000 deaths are attributed to poor sanitation annually. One third of these deaths are from the indirect diseases resulting from poor sanitation through childhood malnutrition. This study has shown that economic losses of over US$187 million result from health care costs, health-related productivity costs and premature mortality costs, or US$14 annually for each and every person in Cambodia. Recommendation 4. Health aspects of sanitation programs deserve central focus The Government of Cambodia should focus on the easy health wins from improved sanitation, through targeting children and focusing on safe but simple latrine designs, improved excreta isolation measures, and improved hygiene practices. Given the key role of hygiene practices in health improvement, high-impact hygiene components should be integrated in the planning and implementation of sanitation programs. In this case, in addition to Ministry of Rural Development, the Ministry of Health should play a central role in the health aspects of sanitation programs. Major finding 5. High water pollution levels are partially caused by poor sanitation The majority of human excreta eventually find their way to water bodies; so do gray water, animal excreta, solid waste and industrial wastewater. Together these cause significant water pollution in Cambodia with associated high economic losses. Quantified economic losses associated with polluted water from domestic sources reach US$149 million in Cambodia (US$11 per person per year), while other impacts include loss of aesthetics, leisure activities, and tourism. Recommendation 5. Sanitation solutions should focus on reducing water pollution Governments should urgently implement sanitation standards that reduce the release of waste matter into water resources. Low technology, low cost and effective options should be explored as a matter of priority. Focus should not be just on excreta, but also solid waste, household, agricultural and industrial wastewater. The contamination of groundwater with microbiological pathogens should be averted through better planning, increased resource allocation, and awareness raising. Water quality monitoring should be conducted to assess the extent and nature of water pollution and to inform populations of which water sources are safe to use. 62
67 DISCUSSION, CONCLUSIONS AND RECOMMENDATIONS Major finding 6. Sanitation is linked with sustainable development in many ways Sanitation has a major role in sustainable development, due to its links to other development goals (e.g. CMDGs). Sanitation plays a key but unrecognized role in population welfare, economic growth and poverty reduction. Impacts not fully explored in this study in particular the investment climate are potentially major arguments for improving sanitation in countries, and suggest the adoption of a broader understanding of the term sanitation. Recommendation 6. Several coordinated measures are needed to improve sanitation Sanitation cannot be only the responsibility of an individual sector/ministry, nor of a single level of government. The fact that sanitation touches on many sectors and line ministries should be used as a strength rather than hampering progress, and clear roles and responsibilities need to be defined. The development of a policy and regulatory framework for environmental and health protection is crucial and imperative in the context of rapid industrialization and high economic growth in Cambodia. While further progress is needed at the highest levels to ensure political support and resource allocations for sanitation, greater emphasis is needed on the implementation levels where sanitation demand must be stimulated and affordable and attractive solutions for sanitation must be available. Major finding 7. Variability is expected in the actual impacts of poor sanitation The national per capita costs in rural and urban areas in Cambodia have significant difference. In addition, there will exist significant variation in the impacts of poor sanitation between different geographic locations depending on sanitation coverage, demographics, environment, and practices related to health and water consumption. Recommendation 7. Local as well as national studies should inform sanitation policy The study indicates that impacts are likely to vary between different population groups, varying based on geographical and physical features, sanitation coverage, demographics, and practices related to health, hygiene and water consumption, among others. Major finding 8. Existing data sources are weak for quantifying sanitation impact This study has used a number of available data sources, but has been limited by lack of specific information on outcomes related to sanitation. With the exception of basic latrine coverage indicators, surveys tend not to include questions related to sanitation, such as expenditure, preferences, access time, health-related time loss, sanitation and hygiene practices, and gender. Questions related to broader sanitation coverage (e.g. waste disposal, environmental quality) are largely left out. Routine government reporting systems such as health indicators and health service use, and water quality monitoring, only imperfectly capture the substantial impacts of poor sanitation. Water quality is known to be important for fish reproduction, growth and safety for human consumption, but little is known about the exact relationships, and the role poor sanitation plays. Recommendation 8. Future survey and research work is key in monitoring progress Surveys and government reporting systems should be assessed for extension to include behavior and outcomes related to sanitation. Selected research studies could fill important gaps in knowledge about the economic and welfare effects of poor sanitation. Further research is required on the population benefits of improved sanitation, and what levels of benefit different types of sanitation option can deliver. A gender perspective is key in understanding the effectiveness of different sanitation options. The link between poor sanitation and tourism and foreign direct investment losses is poorly understood, and merits further assessment. Country-specific studies on the value of time and the value of life will allow a better understanding of the importance of the identified health impacts Detailed recommendations for research are outlined in Annex C. 63
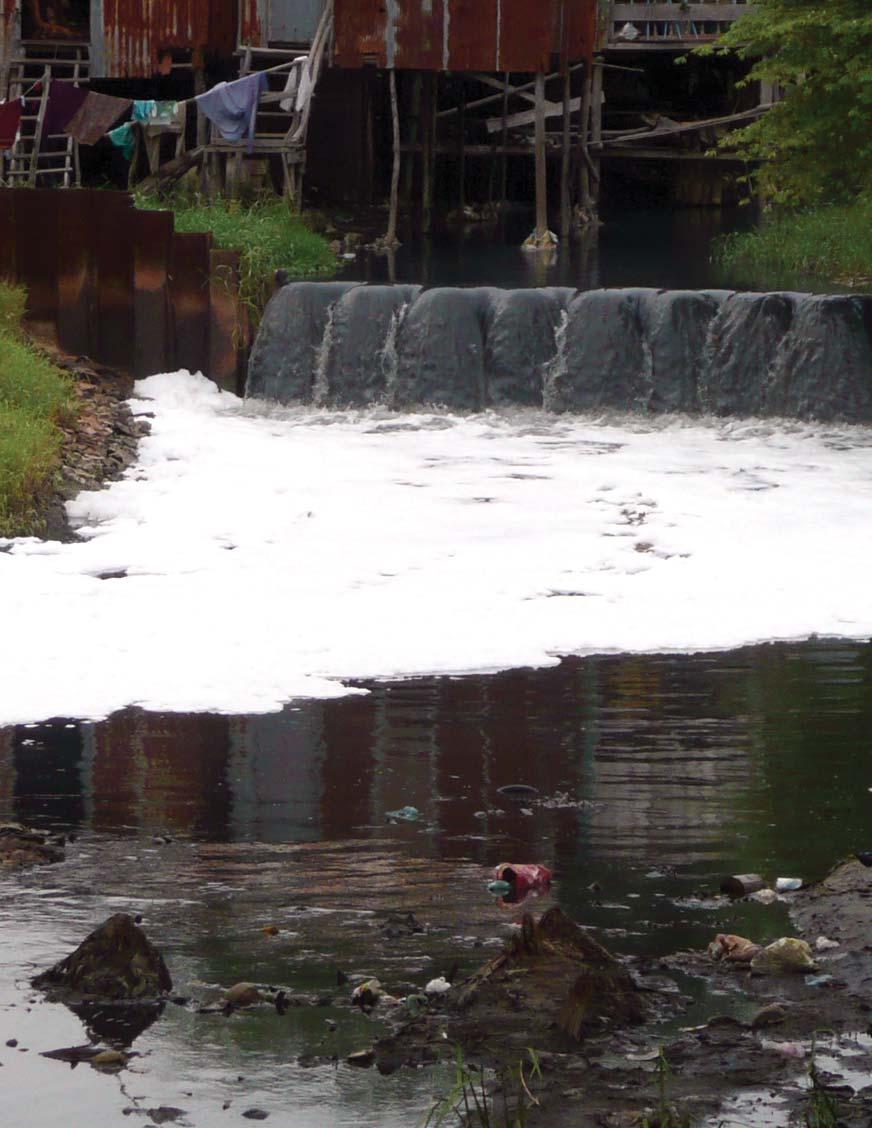
68
69 Annexes WSP-EAP Research Report February 2008
70 ANNEXES Annex A. Study Methods A1 Health Health impacts are usually considered to be one of the most significant impacts associated with poor sanitation and hygiene. There are many diseases associated with poor sanitation and hygiene practices, among them diarrhea, dysentery, cholera, salmonellosis, shigellosis, typhoid fever, hepatitis A, trachoma, and some parasitic diseases (ascariasis, trichuriasis, hookworm, schistosomiasis). Not only do diseases have direct implications for population welfare through health-related quality of life (HRQL), but diseases also have financial and economic impacts, which include spending on health care, loss of income or production, and in the case of premature death, the value of loss of life. A1.1 Selection of diseases There are many diseases associated with exposure to human waste due to poor sanitation and poor hygiene practices. These are presented in detail in Table A1. Diseases related to poor sanitation and hygiene can be viral, bacterial, parasitic, protozoal, helminth, and fungal in nature, and have many pathways: fecal-oral, urine-oral, and fecal-eye; the main one being fecal-oral [9, 10]. According to the F-diagram, pathogens can be passed from the feces through fluids, fields, flies and fingers [11]. In addition, food can act as an intermediary for all of these four direct transmission pathways. The principle poor practices which support heightened transmission of disease from human waste include an unsanitary toilet area, poor personal hygiene practices following toilet-going, open defecation in the fields or water sources, lack of protection or treatment of drinking water, poor food preparation practices, and lack of latrine and water-source protection in flood-prone areas. Furthermore, exposure to household solid waste, agricultural and industrial wastes can also lead to disease and premature death, from contact with toxic materials or otherwise dangerous substances. Poor sanitation is directly and indirectly affecting population health. Directly, poor sanitation causes diarrheal infections and other health effects which in turn lead to mortality especially in young children. Indirectly, poor sanitation contributes to child malnutrition through the effect of diarrheal infections on nutritional status. Malnutrition, or poor nutritional status, increases the risk of child mortality from disease as well as increases the incidence of disease (Fishman et al., 2004). This indirect effect of sanitation mainly affects children under the age of five years old, while the direct effect of sanitation affects the whole population. Given the large number of diseases and health effects due to poor sanitation, this present study selected the key health impacts based on their epidemiological and economic importance. The availability of health data from national statistics, local research studies and international sources also played an important role in determining which diseases to include. Table A2 below presents data available from the national health information system (HIS) in Cambodia on number of cases and deaths from key sanitation and hygiene-related diseases. Although these data are not representative of the total disease burden at national level due to underreporting, these data do provide an indication of which diseases are of most significance nationally to aid selection of diseases to include in this present study. 66
71 ANNEXES Table A1. Diseases linked to poor sanitation and hygiene, and primary transmission routes and vehicles Disease Pathogen Primary transmission route Vehicle Diarrheal diseases (Gastrointestinal tract infections) Rotavirus diarrhea Virus Fecal-oral Water, person-to-person Typhoid/ Paratyphoid Bacterium Fecal-oral and urine-oral Food, water. + person-person Vibrio cholera Bacterium Fecal-oral Water, food Escherichia Coli Bacterium Fecal-oral Food, water. + person-person Amebiasis (amebic dysentery) Protozoa 1 Fecal-oral Person-person, food, water, animal feces Giardiasis Protozoa 1 Fecal-oral Person-person, water (animals) Salmonellosis Bacterium Fecal-oral Food Shigellosis Bacterium Fecal-oral Person-person. +food, water Campylobacter Enteritis Bacterium Fecal-oral Food, animal feces Helicobacter pylori Bacterium Fecal-oral Person-person. + food, water Protozoa Other viruses 2 Virus Fecal-oral Person-person, food, water Malnutrition Caused by diarrhoeal disease and helminthes Helminths (worms) Intestinal nematodes 3 Roundworm Fecal-oral Person-person. + soil, raw fish Digenetic trematodes (e.g. Schistosomiasis Japonicum) Flukes (parasite) Fecal/urine-oral; fecal-skin Water and soil (snails) Cestodes Tapeworm Fecal-oral Person-person. + raw fish Eye diseases Trachoma Bacterium Fecal-eye Person-person, via flies, fomites, coughing Adenoviruses (conjunctivitis) Protozoa 1 Fecal-eye Person-person Skin diseases Ringworm (Tinea) Fungus Touch Person-person (Ectoparasite) Scabies Fungus (Ectoparasite) Touch Person-person, sharing bed and clothing Other diseases Hepatitis A Virus Fecal-oral Person-person, food (especially shellfish), water Hepatitis E Virus Fecal-oral Water Poliomyelitis Virus Fecal-oral, oraloral Person-person Leptospirosis Bacterium Animal urineoral Sources: WHO and [12, 13] Water and soil swamps, rice fields, mud 67
72 ANNEXES 1 There are several other protozoabased causes of GIT, including Balantidium coli dysentery, intestinal ulcers Cryptosporidium parvum - gastrointestinal infections Cyclospora cayetanensis - gastrointestinal infections Dientamoeba fragilis mild diarrhea Isospora belli / hominus intestinal parasites, gastrointestinal infections 2 Other viruses include: Adenovirus respiratory and gastrointestinal infections Astrovirus gastrointestinal infections Calicivirus gastrointestinal infections Norwalk viruses gastrointestinal infections Reovirus respiratory and gastrointestinal infections 3 Intestinal nematodes include: Ascariasis (roundworm - soil) Trichuriasis trichiura (whipworm) Ancylostoma duodenale / Necator americanus (hookworm) Intestinal Capillariasis (raw freshwater fish in Philippines) Table A2. Importance of sanitation and hygiene-related diseases, total cases and total deaths (2005) Disease Cases in 2005 Reported morbidity Rate (cases per population) Annual reported deaths Diarrheal diseases (total) 706, Diarrhea 395, Dysentery 310, Typhoid fever 1 10,408 (IP) Cholera (IP) Skin diseases 202, Malnutrition - underweight in 1, , children <5 Diseases associated with 1,029, ,209 malnutrition in children <5 4 ALRI 964, Measles 1, Malaria 63, Source: Health Information System 2005, MoH 1 The total morbidity cases are not available. So, the figure indicates only the number of inpatients (IP). This figure is not added up in the diarrheal diseases. 2 The figure is based on Health Center and National Hospital data for underweight cases taken from HIS (2005). 3 Sourced from CDHS (2005) 4 Total cases, not yet attributed to poor sanitation and hygiene It can be seen from the table that the diarrheal diseases and skin disease amount to more than 0.7 million and 0.2 million cases, respectively. The malnutrition rate among under-five children has a close relationship with poor sanitation and hygiene. In 2005, the recorded number of malnutrition is 1,147 cases according to the HIS; and estimated over half a million according to the CDHS (2005). It is useful to note that in the case of malnutrition, only under-weight is the main focus in the study as it reflects the suffering of children from both chronic and acute malnutrition. The number of reported disease cases that are related to malnutrition such as ALRI (Acute Lower Respiratory Infection), measles, and malaria totaled roughly one million cases among under-five children. The fact that malnutrition and its associated diseases are considered in this study is because poor sanitation and hygiene indirectly contributes to malnutrition through the effects of diarrheal infections on nutritional status. More importantly, malnutrition increases the incidence of diseases and the risk of child mortality from diseases such as ALRI, measles and malaria. 68
73 ANNEXES The reported deaths in Table A2 above reflect only the deaths in public health establishments as the data from private clinics is largely unaccounted for, and deaths outside medical establishments is excluded. Thus, this figure is underreported in the sense that the actual number of death may be much higher than the figure given. Given the importance of these diseases and the availability of data in HIS, only the diseases listed in Table A2 above are considered in present study. To understand better the burden of disease by age group in public health service, Table A3 below shows the distribution of morbidity and mortality by age group. This table, however, does not reflect the actual disease burdens in Cambodia. From the table, it can be observed that nearly half of diarrheal diseases occur among population of over fifteen years of age followed by under-five children where one third of diarrheal diseases occur. For the case of ALRI, it is observed that the morbidity is highest for the population above 15 years of age, followed by the under-five children. However, the death from ALRI is more predominant among under-five children than 15+ population. Table A3. Distribution of morbidity and mortality by age group, year 2005 Condition Morbidity (% cases) Mortality (% deaths) Diarrheal disease Skin disease Malnutrition ALRI Measles Malaria Source: Health Information System, Ministry of Health, Note that malnutrition figures are only available for the 0-4 category, but that malnutrition also occurs in older age groups From the table, it is important to note that although ALRI, measles, and malaria involve population of all age groups, the present study only focuses on the under-five population. This is because those diseases are linked with poor sanitation and hygiene through malnutrition attributed to diarrheal infections (See A1.3). A1.2 Disease burden from diseases directly related to poor sanitation In order to estimate the full impact of diseases on the daily activities of the afflicted person, it is necessary to estimate the total number of episodes, and not just the episodes seeking treatment, as indicated imperfectly from routine health information systems. As shown by household surveys such as the Cambodia Demographic and Health Surveys (CDHS) and the Cambodia Socio-Economic Survey (CSES), a proportion of the sick do not seek official care, and can approach an informal carer, or they may self-treat by visiting the local pharmacy, or they wait to see if the disease gets better with no action 8. For diarrheal disease incidence in the under fives the age group on whom the major disease burden falls CDHS data were used for under fives. Given that CDHS does not normally report diarrheal disease prevalence for population over five years of age, available WHO regional data were used for this population (see Table A4). In this case, the WHO s WPR-B region is applied for Cambodia. CDHS usually report prevalence during a two-week recall period based on self-diagnosis 9. It is important to note that the national averages from CDHS data presented in the table 8 As shown by the regional and socio-economic disaggregations of these survey data, treatment seeking behaviour varies significantly between different populations, and depends on such factors as geographical proximity to health services, out-of-pocket costs of treatment and transport, attitudes towards health providers, and cultural factors. 9 The calculation is to take the proportion of children with diarrhea in the past 2 weeks, and scale up to a year period by multiplying by 52 (weeks) and dividing by 2.5 (recall period 2 weeks, but cases recalled 2 weeks ago would have contracted diarrhea up to half a week before that). 69
74 ANNEXES hide a considerable variation by age group (from 2.04 for month children to 6.61 for 6-11 month children) and geographical location (from 2.11 in Coastal zone to 4.56 in Plains zone). In estimating total cases, an attributable fraction of diarrheal disease to poor sanitation and hygiene of 88% was applied to the rates in Table A4 [9]. Table A4. Diarrheal disease incidence in Cambodia Sanitation Cases of diarrhea per person, by age group condition 0 to to to Improved Unimproved CDHS 2005 data used for children under five years. Based on DHS data of 2-week recall, the calculation is to take the proportion of children with diarrhea in the past 2 weeks, and scale up to a year period by multiplying by 52 (weeks) and dividing by 2.5 (recall period 2 weeks, but cases recalled 2 weeks ago would have contracted diarrhea up to half a week before that). 2 WHO (WPR-B) regional estimates for population over five years of age. A1.3 Disease burden from diseases indirectly related to poor sanitation 10 The approach used here to estimate the indirect health effects of sanitation (via malnutrition) in children is as follows: (a) the effect of diarrheal infections on children s nutritional status is first determined from a review of the research literature; (b) counterfactual nutritional status is then estimated, i.e., the nutritional status that would have prevailed in the absence of diarrheal infections; and (c) health effects of currently observed nutritional status and health effects of counterfactual nutritional status are estimated. The difference in health effects of observed versus counterfactual nutritional status is then the indirect health effects of diarrheal infections, caused largely by poor sanitation. Commonly used indicators of poor nutritional status are underweight, stunting and wasting 11. Underweight is measured as weight-for-age (WA) relative to an international reference population 12. Stunting is measured as heightfor-age (HA), and wasting is measured as weight-for-height (WH). Underweight is an indicator of chronic or acute malnutrition or a combination of both. Stunting is an indicator of chronic malnutrition, and wasting an indicator of acute malnutrition. Underweight status is most commonly used in assessing the risk of mortality and morbidity from poor nutritional status. A child is defined as mildly underweight if his or her weight is in the range of -1 to -2 standard deviations (SD) below the weight of the median child in the international reference population, moderately underweight if the weight is in the range of -2 to -3 SDs, and severely underweight if the child s weight is below -3 SD from the weight of the median child in the reference population. The standard deviations are also called z-scores and noted as WAZ (weight-for-age z-score). 10 This section is largely based on Larsen B. Cost of environmental health risk in children under 5: Accounting for malnutrition in Ghana and Pakistan. Background report prepared for the World Bank study on malnutrition and environmental health Washington DC: World Bank. 11 Micronutrient deficiencies are not explicitly evaluated here, but are found in other studies to have a significant cost (World Bank, 2006; Horton and Ross, 2003; Horton, 1999). Also, Alderman and Behrman (2006) find a significant cost associated with low birth weight, which in part is caused by low maternal pre-pregnancy body mass index (Fishman et al, 2004). 12 The international reference population is defined by the National Center for Health Statistics (NCHS standard), United States or by the World Health Organization s international reference population. 70
75 ANNEXES Repeated infections, and especially diarrheal infections, have been found to significantly impair weight gains in young children. Studies documenting and quantifying this effect have been conducted in communities with a wide range of infection loads in a diverse group of countries such as Bangladesh [14-16], Gambia [17, 18], Guatemala [19], Guinea-Bissau [20], Indonesia [21], Mexico [22], Peru [23], Philippines [24], Sudan [25], and Tanzania [26]. These studies typically find that diarrheal infections impair weight gains in the range of percent. A mid-point i.e., 35% of children s weight deficit - is here attributed to diarrheal infections to estimate the indirect disease burden from sanitation 13. So in the absence of weight retarding infections, the weight-for-age z-score (WAZ) of an underweight child would be approximately 40 percent greater than the observed z-score (i.e., observed WAZ*(1-0.4)) 14. For instance, if a child has a WAZ=-3, then in the absence of weight retarding infections, the child s WAZ would be Prevalence of underweight malnutrition rates in Cambodia are presented in Table A5. Current rates are estimated for the year It should be noted that CDHS report does officially report the prevalence of severe and moderate-tosevere underweight, but not mild underweight. Mild underweight is however important in relation to increased risk of child mortality [27]. This rate was then calculated from the original data in CDHS Counterfactual prevalence rates of underweight, i.e., prevalence rates in the absence of weight retarding infections were calculated using the original household data in the CDHS This was performed through the following procedure: Counterfactual WA z-scores were calculated for each underweight child in the survey using the formula discussed above (i.e., WAZ reported for each child in the survey multiplied by (1-0.4)). Counterfactual underweight prevalence rates were then tabulated using the counterfactual WA z-scores. The results are presented in Table A5 below. Table A5. Current and estimated counterfactual underweight prevalence rates in children under 5 Prevalence rate in Cambodia Current prevalence rates Severe underweight ( < - 3 SD) 6.6% Moderate underweight (-2 to -3 SD) 29.1% Mild underweight (-1 to -2 SD) 38.5% Non-underweight ( > -1 SD) 25.9% Counterfactual prevalence rates Severe underweight ( < - 3 SD) 0.07% Moderate underweight (-2 to -3 SD) 3.0% Mild underweight (-1 to -2 SD) 47.7% Non-underweight ( > -1 SD) 49.2% Source: Estimated based on CDHS 2005 Based on the table, in the absence of diarrheal infections, it is estimated that practically no children would be severely underweight and the prevalence of moderate underweight would be as low as 3%. The prevalence of mild underweight, however, would increase significantly. Various health and debilitating effects from malnutrition are documented in the research literature. This includes long term chronic illnesses from low birth weight, effects of iodine, vitamin and iron deficiencies, and impaired cognitive development (United Nations, 2004; World Bank, 2006). The focus here is on mortality and morbidity in under-five children years associated with underweight. 13 A child s weight deficit is the difference in weight between the child s observed weight and the weight of the median child in the international reference population. 14 This is calculated using the WHO Anthro 2005 software. 71
76 ANNEXES Fishman et al (2004) present estimates of increased risk of cause-specific mortality and all-cause mortality in underfive children with mild, moderate and severe underweight from a review of available studies. Severely underweight children (WA < -3 SD) are five times more likely to die from measles, eight times more likely to die from ALRI, nearly 10 times more likely to die from malaria, and twelve times more likely to die from diarrhea than non-underweight children (WA > -1 SD). Even mild underweight doubles the risk of death from major diseases in early childhood (Table A6). Table A6. Relative risk of mortality from mild, moderate and severe underweight in children under five Weight-for-age (WA) < - 3 SD -2 to -3 SD -1 to -2 SD > - 1 SD Pneumonia/ALRI Diarrhea Measles Malaria Other causes of mortality Source: Fishman et al (2004). 1 Not including mortality from perinatal conditions. Child underweight also increases the risk of illness. Fishman et al (2004) present estimates of increased risk in under-five children with moderate and severe underweight (WA < -2 SD). The largest increased risk of illness is for pneumonia/alri. No increased risk of measles is confirmed (Table A7). Table A7. Relative risk of illness from moderate and severe underweight in children under five Weight-for-age (WA) < - 2 SD > - 2 SD Pneumonia/ALRI Diarrhea Measles Malaria Source: Fishman et al (2004). These relative risk ratios can be applied to the underweight prevalence rates in Table A5 to estimate attributable fractions (AF) of mortality and morbidity from diarrheal infections through their effect on nutritional status (underweight status) 15. The following formula is used to calculate attributable fractions of ALRI, measles, malaria, and other causes of mortality, and attributable fractions of ALRI and malaria morbidity incidence from diarrheal infections: AF n P RR i i i= 1 = n i= 1 i n i= 1 P RR P i C i RR i (1) 15 The attributable fraction of mortality or morbidity from malnutrition is the percent of deaths or percent of cases of illness (e.g., percent of ALRI deaths or cases of ALRI) caused by malnutrition. 72
77 ANNEXES where RR i is relative risk of mortality or morbidity for each of the WA categories (i) in tables A6-A7; P i is the current underweight prevalence rate in each of the WA categories (i); and P i c is the counterfactual underweight prevalence rate in each of the WA categories (i). This formula is also called the potential impact fraction because it estimates the mortality or morbidity that would have been avoided for a different counterfactual population distribution (e.g., less children being underweight) exposed to those levels of risk of mortality or morbidity. For a further discussion of this formula, see Ezzati et al. (2004). For diarrheal mortality and morbidity the AF estimation procedure would be different because there are two risk factors, i.e. the direct effect of sanitation and the indirect effect through malnutrition. As already 88 % of diarrheal infections and mortality is estimated to originate from sanitation (or mediated from sanitation through water), the additional effect of malnutrition is minimal and is therefore ignored here 16. Annual cases of mortality and morbidity from diarrheal infections caused by poor sanitation, through the effect of infections on nutritional status, are estimated as follows: M = c j = m j= 1 0 AF j M j (2) where AF j is the AF in eq. (1) for each cause of mortality or type of disease j, M j 0 is the current total annual cases of mortality or disease incidence in each of the categories in tables A2-A3, and c is the fraction of diarrheal infections caused by poor sanitation (88%). Most recent available estimates of annual cases of mortality (M j0 ) in children under-five are presented in Table A8. These estimates reflect under-five child mortality rates in 2005, and the structure of cause-specific deaths is estimated from WHO country estimates of cause-specific mortality in 2002 [28]. Table A8. Estimated cause-specific annual deaths in children under five in 2005 Disease Annual deaths Diarrheal disease 6,600 ALRI 4,800 Measles 1,400 Malaria 2,600 PEM 800 LBW 3,500 Other perinatal conditions 6,000 Other causes 4,900 Total 30,600 Source: Adjusted to 2005 from WHO country estimates of mortality by cause in 2002 (WHO, 2004a), by applying child mortality rate in See Larsen (2007) for methodology and estimation of environmental health effects from multiple environmental risk factors in Ghana and Pakistan. 73
78 ANNEXES Table A9. Demographic and mortality data in 2005 Variable Cambodia Mortality rate, under-five children (per 1,000) 1 83 Population, total 2 13,806,974 Number of under-five children 2 1,694,990 Estimated annual births 3 369,682 Source: 1 CDHS 2005; 2 Population projection , NIS; 3 Estimated from the number of children u5. Complete records or statistics on annual cases of ALRI and malaria in under-five children are not available in Cambodia. This is due to many reasons, including incomplete reporting and record systems, cases never treated at health care providers, and incomplete or potentially incorrect case identification and diagnostic. Annual cases therefore need to be estimated. WHO provides regional estimates of ALRI for the year 2002, the most recently available [29]. These data suggest that the incidence of ALRI in under-five children in Asia is on the order of 0.35 to 0.7 cases per child per year. In this regard, an annual incidence of 0.5 cases of ALRI is applied to Cambodia while it is only 0.35 for some ESI countries namely Indonesia, the Philippines and Vietnam. The reason for that is because Cambodia still faces more health challenges than many of the other countries in the region. Annual ALRI incidence in all under-five children is the incidence per child multiplied by the number of children (Table A10). The incidence of malaria is likely more uncertain than the incidence of ALRI. The regional WHO data for 2002 suggest that the incidence of malaria in SEAR-B is 0.07 cases of malaria per child per year. Indonesia holds a large share of the population in this region. The incidence of malaria in WPR-B is only per child per year, as China constitutes more than 80 percent of the population in this region and has very low incidence of malaria. A recent paper by WHO estimates that the global incidence of malaria in 2004 was 6 times higher than recorded in national health information systems, and around 17 times higher in non-african countries [30]. The estimated country population incidence in Korenromp (2005) indicates that the incidence in under-five children could range from 0.16 cases per child per year in the Philippines, 0.27 cases in Vietnam, 0.39 cases in Indonesia, and 0.8 cases per child in Cambodia 17. These estimates are, however, very uncertain. A much more conservative estimate would be to assume that the incidence in under-five children in Indonesia is 0.07 cases per child per year (as reported for SEAR-B for the year 2002) and that the incidence in the other countries are in the same proportion relative to the estimated incidence in Korenromp (2005). This approach gives an estimated incidence of 0.14 in Cambodia. Using this incidence rate, annual cases of malaria in under-five children in Cambodia are presented in Table A10. Table A10. Estimated annual cases of illness in children under five (thousand cases) Disease Annual cases ALRI 847 Malaria 240 Sources: Estimated from regional WHO incidence data (WHO, 2004b) and Korenromp (2005). Applying equation (2) to the cases of mortality and illness in Table A8 and Table A10 provides an estimate of mortality and morbidity from poor sanitation. Based on the estimates, in Cambodia, the under-five mortality directly attributable to poor sanitation (i.e., diarrheal mortality) constitutes 19% of total under-five child mortality. Mortality attributable to sanitation from malnutrition (i.e., the indirect effect of infections through malnutrition) constitutes 18% of total under-five child mortality. Total 17 Korenromp only present population incidence. The WHO regional data indicate that the incidence in under-five children in SEAR-B is 4.5 times higher than the population incidence. This ratio is applied to the estimated population incidence in Korenromp to estimate incidence in under-five children. 74
79 ANNEXES attributable mortality to sanitation is 37% of total under-five child mortality (Table A11). For morbidity in children under five years, ALRI attributable to sanitation from malnutrition constitutes 19% of annual cases, and malaria attributable to sanitation constitutes 8% of annual cases (Table A12). Table A11. Percent of total under-five child mortality attributable to poor sanitation Category % of total under-five child mortality Directly attributable mortality to sanitation 19 Attributable mortality to sanitation from malnutrition 18 Total attributable mortality to sanitation 37 Table A12. Percent of cases of illness in children under five attributable to poor sanitation Diseases % of total child morbidity ALRI attributable from malnutrition 19 Malaria attributable from malnutrition 8 Despite the fact that poor sanitation causes several indirect diseases among under-five children, the subsequent calculation of economic costs of indirect diseases includes only diarrheal diseases, ALRI, measles, and malaria. The reason is that those diseases have more reliable data for estimation. A1.4 Health care cost estimation Health care costs result from diseases associated with poor sanitation and hygiene. In order to estimate health costs related to disease, it is necessary to compile information on disease rates for the selected diseases, treatment seeking rates, as well as health systems variables such as treatment practices and unit costs. Health care costs can fall on both the patient and the public health system, depending on where the sick person seeks care from and the tariff rates in public facilities. Private health care is assumed to be fully financed by the patient. Costs are both financial and economic in nature. Financial costs include the marginal cost to treat patients at public facilities (mainly drugs), patient transport costs, as well as the full costs of treatment in private clinics or selftreatment. In the absence of data on the actual production costs of health care provided by the private sector, the tariffs are taken to reflect the health care costs. Economic cost includes the financial costs plus the short-term fixed costs of public health facilities such as staff, capital items and overheads. In order to estimate the costs of health care, it is necessary to know the total number of cases seeking health care from different providers. Given that government statistics are often incomplete, public facility treatment seeking figures were adjusted to reflect the total cases seeking care. Table A13 shows CSES data (2004), which shows where households seek care from, by diseases. It is assumed that these data are the most reliable given the lack of alternative data on treatment seeking by disease. The data from CSES appears to provide a different perspective on health treatment seeking behavior than the CDHS data (2005). While CDHS indicates the majority of treatment sought in private clinic (60%), CSES shows that most sanitation and hygiene related diseases patients seek treatment at public hospital or self treatment. Yet, since CDHS provides only the data of treatment seeking for all diseases or injuries combined, it can be assumed that CSES is more useful and reliable in this sense. In CSES, the information on treatment seeking behavior of various diseases can be extracted, where sanitation and hygiene related diseases are also included. 75
80 ANNEXES Table A13. Treatment seeking behavior, by provider Disease Public provider % seeking treatment from: No Private clinic (formal) Private informal Self-treatment (pharmacy, other) treatment (%) Other (%) Diarrheal diseases Skin diseases ALRI Measles Malaria Source: CSES 2004 Based on the number of reported cases in the public health system, and the place of treatment seeking (from Table A13 above), the total cases seeking treatment can be estimated for each health care provider, and for each region of the country. Table A14 below presents the figures after they have been adjusted for attribution to poor sanitation and hygiene: 88% for diarrhea [9], 50% for malnutrition [10], and 50% for skin disease. For ALRI, measles, and malaria, the estimation method is mentioned in Annex A1.3 above. The reported cases have been adjusted by underreporting of the system due to poor record keeping and some health facility reports being delayed or not sent, and hence not included in national reporting. Table A14. Estimated numbers of disease cases attributed to poor sanitation and hygiene seeking care from different providers, year 2005 Disease Reported cases ( 000) Public sector % underreported (%) Estimated actual cases ( 000) Formal clinic ( 000) Private sector Informal care ( 000) Selftreatment ( 000) Diarrheal diseases , ,134.5 Skin disease Malnutrition ALRI Measles Malaria Source: HIS (2005) for reported cases; CSES (2004) for Health Seeking Behavior 1 Estimated based on CDHS 2005 incidence for under-five children and WHO for over-five population 2 Estimated based on WHO and other studies (see Annex A1.3) In order to calculate the costs associated with the cases seeking health care, it is necessary to know the treatment practices, the proportion of cases that are admitted for inpatient stay, and the costs associated with health care. Table A15 shows these variables for treatment seekers who receive their care on an outpatient basis from public providers, formal private providers (private hospitals and private clinics), informal carers (doctor/nurse s home, traditional treatment), and self-treatment. 76
81 ANNEXES Table A15. Health service use and unit costs associated with outpatient care Provider and disease Average patient tariff (US$) 1 Financial cost (US$) 1 Full unit cost (US$) 1 Other patient costs (US$) 1 Public provider Diarrheal diseases Skin disease Malnutrition ALRI Measles Malaria Formal private provider Diarrheal diseases Skin disease Malnutrition ALRI Measles Malaria Informal private provider Diarrheal diseases Skin disease Malnutrition ALRI Measles Malaria Self-treatment Diarrheal diseases Skin disease Malnutrition ALRI Measles Malaria All cost figures reflect the cost per outpatient consultation Note: The exchange rate as of June 1, 2007: 1US$= 4,050 Cambodian Riels The tariff and financial cost of disease is obtained from a survey conducted by the Economic Institute of Cambodia (EIC) and interviews with staff from a health center. It is also assumed that drug provided in private care is exactly the same as the drug given in public service for all diseases. Moreover, the calculation of financial cost for private clinics also includes a consultation fee, which is 10,000 Cambodian Riels (US$2.47) for formal private care and 5,000 Cambodian Riels (US$1.23) for informal private care. The economic cost of public service facility is assumed to be 3991 Cambodian Riels (US$0.985) per outpatient visit, sourced from regional unit cost data from WHO 18. It is assumed that the average number of outpatient visits per case is one
82 ANNEXES Table A16 below shows the same variables for inpatient care for public and formal private providers, including the proportion of cases admitted, average length of stay per patient, and associated costs per inpatient day. The tariff and financial cost of disease was obtained from an interview with staff of health center. It is also assumed that drug provided in private care is exactly the same as the drug given in public service. The only difference is the hospitalization fee per day in private care. The economic cost of public service facility is assumed to be 6,587 Cambodian Riels (US$1.626) per bed for inpatient 19. Moreover, the hotel component of formal private provider ranges from US$10 to US$20 with an average of US$ Moreover, other patient costs refers to the transportation cost to and from healthcare service taken from CDHS (2005). Regarding the admission rate, due to the lack of information concerning private hospital, it is assumed that the admission rate of private hospital is the same as the public hospital. Table A16. Health service use and unit costs associated with inpatient care Provider and disease % cases admitted (%) Days admission per patient Average patient tariff Per inpatient day (US$) Financial cost Full unit cost Other patient costs (US$) Public provider Diarrheal diseases Skin disease Malnutrition ALRI Measles Malaria Formal private provider 1 Diarrheal diseases Skin disease Malnutrition ALRI Measles Malaria This includes private clinics and private hospitals The exchange rate as of June 1, 2007: US$1 = 4,050 Cambodian Riels A1.5 Health-related productivity cost estimation Disease takes people away from their occupations and daily activities, and regular sickness-related absences from school affects the ability of children to keep up with the curriculum and complete their education. Therefore, time lost from work, school or daily activities has a value. Given that time off work is determined by the severity of the disease, as well as whether the case was treated or not, assumptions were made on the proportion of cases that are severe, and the treatment seeking behavior associated with these cases. Table A17 below shows the proportion of severe and non-severe cases based on the categorization of disease and the severity level given in CDHS, and the day-off daily activities by severity of disease. The following assumptions are made to compute the table below: Obtained from an interview with private medical staff 78
83 ANNEXES For all diseases, except malnutrition, the severe and non-severe cases is assumed according to the CDHS 2005 where the severe cases are about 12% and non-severe cases (slight to moderate) are 88%. The severe case rate of malnutrition is taken separately from CDHS 2005 where there is 7% severe, and 93% non-severe. It is assumed that all the severe cases will seek treatment at any healthcare service. So, there is no severe case which is not treated. More importantly, for treated cases, only severe cases will seek hospitalization. In this case, the day-off activities will be two days more added to the length of hospitalization to reflect the consultation and traveling to healthcare service. The episode of disease for non-severe cases but treated is assumed to be 50% of the day-off activities of severe cases, and productive time loss from this non-severe disease is only 2 hours a day, except malnutrition where 4 hours a day (half day) is assumed. This productive time lost is applied to each day of disease episode. Moreover, another half day productive time loss is added to reflect the time spent for consultation and traveling for the non-severe cases. For the untreated cases, the number of days off daily activities is assumed to be the same as the episode of the treated non-severe cases. Hence, the number of days off normal activities of untreated cases is equal to the days lost of treated non-severe cases less the traveling time to healthcare service of half a day. Table A17. Variables for estimating amount of time lost from disease % cases Days off daily activities (days) Disease Nonsevere Severe Non-severe Non-severe Treated Not treated Severe Diarrheal diseases Skin disease Malnutrition ALRI Measles Malaria Given that time off work has an opportunity cost, and in some instances a real financial loss, time away from daily activities needs to be given a unit value to estimate overall financial and economic losses associated with disease. A commonly applied economic valuation technique for time loss is the human capital approach (HCA), which values time loss according to what the sick person could be earning in productive employment. Even when the person would not be earning income (especially in the case of children), time for leisure and other activities can be assumed to have a value greater than zero [31-34]. A second common approach, which measures the sick person s willingness to pay to avoid disease, can more accurately reflect the welfare effects of disease, but due to lack of data on willingness to pay in Cambodia, this approach is not used in this study. Hence HCA is used as it is simple and it reflects the time loss component of disease. This study distinguishes between financial and economic cost. For some adults, time spent away from productive activities will have a direct income-loss, while for others the salary may be paid for a maximum number of sick days per year. Given the self-employed and/or agricultural nature of agrarian societies in Cambodia, loss of time from productive activities may not have immediate financial loss, but may lead to income-losses in the future unless a family member or business partner replaces their lost labor. In order to be conservative, financial cost is estimated as immediate income loss for those not paid their wage or earning an income from time lost due to sickness. In Cambodia, 70% of adults are crudely assumed to actually lose income by not working when getting sick. For those not directly losing income, there will also be a welfare loss, which may include longer-term incomeearning potential as mentioned above. In estimation of economic cost, this study recognizes the value of time lost from daily activities, whether productive working time, school time, or leisure time. Given that value of time varies 79
84 ANNEXES according to what the person is doing with their time, economic welfare losses are valued at less than the financial losses described above. Research studies have shown a whole range of results on the value of time. This present study takes the economic value of time as 30% of the unit value of time. Furthermore, this study distinguishes between the value of adults and of children s time, given that children do not generally have the same values as adults. On the other hand, children s time is not worthless, given that children are or should be at school learning and hence time away from school would mean lost education and eventually lower income levels [35]. Also, for young children of non-school age, sickness will involve more time input from a carer, and hence incur a cost. In study countries, caring for a child is mostly the mother s task and thus ill children are more likely to take the time of women than men, thus hindering women from working. Given the limited empirical work on the value of children s time, and very few precedents in terms of valuing children s time, a time value of 50% of adults time is given in this present study [36]. Table A18 shows some alternative sources of economic value by region, comparing Gross Regional Product (GRP) per capita, compensation of employees, minimum wage and average wage. The annual value was converted to hourly value by assuming 8 working hours per day, and 236 working days (public holiday subtracted). Hourly minimum and average wages were converted to annual figures by using the reverse calculation. Compensation of employees was considered the most appropriate global figure to reflect the average value of time, given that it reflects the amount paid to all formal employees. Compensation of employees per capita was calculated at regional level by multiplying national compensation of employees by the ratio of GRP per capita at regional compared to national level, and dividing by the total employment. Table A18. Comparison of alternative sources of time value (year 2005) GDP per capita (US$) Average compensation of employees (US$) Minimum wage (US$) 1 Average wage over all sectors (US$) 2 Annual Hourly Annual Hourly Annual Hourly Annual Hourly Phnom Penh 1, , Plains Tonlé Sap Coastal Plateau National Sources: Compiled using data from National Institute of Statistics 1 Minimum wage for garment factory workers (US$50 per month) 2 Estimated by Economic Institute of Cambodia A1.6 Premature death cost estimation Cost of premature death is calculated by multiplying the number of deaths by the unit financial and economic value of a death. Data on the number of premature deaths from health information systems are unreliable, due to underreporting as well as misdiagnosis. For example, the annual number of reported deaths in Cambodia using HIS for under fives is only 954, while the predicted numbers of deaths based on under-five child mortality rates and birth rate is about 30,600. Clearly, the figures appear to grossly underestimate the actual death rate. Therefore, Table A19 below is the estimated death due to poor sanitation and hygiene by disease. It should be noted that the figures presented in the table for under-five children are estimated based on WHO data and other studies described in Annex A1.3. The diarrheal mortality for population over five years are estimated based on the 80
85 ANNEXES WHO s global burden of disease regional data, where about 10% of the total diarrheal deaths are among over-five population. Moreover, the number of deaths by age group among over-five population is allocated by using the WHO data for WPR-B for diarrheal case fatality rate which are for 5-14, for 15-59, and for adults 60 years and over. According to the data in Table A19, the number of under-five children deaths from poor sanitation and hygiene accounts for about 30% of the total child mortality in Cambodia. This figure may be much higher if other indirect diseases are included (i.e., 37% according to Table A11). Table A19. Estimated number of annual deaths from poor sanitation & hygiene Disease Age grouping Total Diarrheal diseases 5, ,600 Skin diseases N/A N/A N/A N/A Malnutrition N/A N/A N/A N/A ALRI 1 1,786 N/A N/A 1,786 Measles N/A N/A 420 Malaria 1 1,033 N/A N/A 1,033 1 Estimated based on WHO and other studies (See method in Annex 1.3) N/A Not available or estimated Premature death affects society in a number of ways, and has proven to be difficult to value with any degree of precision. As a result, economists have employed a range of methods for valuing premature loss of human life [37]. The most tangible economic impact of premature death is the loss of a member of the workforce, with implications for the economic outputs generated. Hence, this approach, what has been termed the human capital approach (HCA) approximates the welfare loss by estimating the future discounted income stream from a productive person, from the time of death until the end of (what would have been) their productive life. However, this technique has been criticized for the fact that it values human life exclusively for its productive potential. Empirical evidence indeed proves that life has a value beyond the productive worth of a human, which both society as a whole and individuals are willing to pay for in order to safeguard [38, 39]. Various other methods are available to estimate this broader economic as well as inherent worth of human life. Two major methods are used to value life: (1) observations about actual market and individual behavior with respect to what they pay to reduce the risk of death (e.g. safety measures) or what they are willing to accept for an increase in the risk of death (e.g. wage premium for risky jobs). This approach is known as hedonic pricing. (2) Stated preference from individuals exposed to risk, using interview technique. This approach is known as contingent valuation. Both these approaches estimate directly the willingness to pay of individuals, or society, for the reduction in the risk of death, and hence are more closely associated with actual welfare loss compared with the human capital approach. The problem in valuing life is that the alternative methods can give very different estimates of the value of life, and applications of the same techniques to different contexts can also reveal very different implicit values in reducing the risk of death. For example, willingness to pay studies generally show greater value of life than the human capital approach. These variations and differences will affect the credibility of economic studies when used for policy decisions, and hence considerable care is needed in estimating and presenting the economic impact of premature loss of life to policy makers. Therefore, in order to sound more plausible to policy makers, this present study uses the more conservative human capital approach, described below. Sensitivity analysis explores the implications of alternative values for loss of human life using the willingness to pay approach. 81
86 ANNEXES Human capital approach The human capital approach summates the future years of income at the average age of death. Given lack of data on exact age of death, three time points of death were used: 2 years of age for the 0-4 age group; 9 years of age for the 5-14 age group; and 40 years of age in the 15+ age group. The discount rate applied was 3%, reflecting the social rate of time preference approximated by the long-term real interest rate. Also, given that per capita income grows over time, a presumed long-term per capita income growth of 2% was applied to future incomes. Average income was taken from the average compensation of employees, and adjusted to sub-national level by applying GRP per capita ratios. For the younger age groups who will not be in the work force for several years, the net present value of future earnings are further discounted to take this into account. Values are shown in Table A20. Financial costs of premature death were approximated using the human capital approach by assuming a coping period following the loss of an adult member of the family. The coping period could be the period after which the income of the lost adult is expected to be replaced. A period of one year is conservatively used in this study. Therefore, the average compensation of employees for a single year is applied to the number of adult deaths to estimate the financial impact of premature death. In this case, the average compensation of employees used is US$489 for Cambodia. Willingness to pay approach Given the lack of estimates of willingness to pay for avoiding death in developing countries, and Southeast Asian countries in particular, the benefits-transfer method was applied for the willingness-to-pay method. This essentially involves taking value-of-statistical-life (VOSL) values from a meta-analysis of studies in developed countries and transferring the value directly using an adjustment for differences in income. While this approach has many weaknesses [40], the absence of data from developing countries justified the benefit transfer approach. The VOSL reported in North American and European studies was highly variable, ranging from around US$1 million to more than US$10 million [38, 41-45]. A meta-analysis of 40 VOSL studies reported by Bellavance et al in 2007 reported average VOSL of US$9.5 million and median VOSL of US$6.6 million [46], similar to the mean estimate of US$5.4 million found by Kochi et al (2006) [47]. Developing country studies are few. A study of the Indian labor market found VOSL varying from roughly US$0.14 to US$0.38 million [48]. Given the large number of studies from OECD countries, an adjusted benefit transfer is justified, using a highly conservative VOSL estimate of US$2 million. This value is significantly lower than the values presented in the meta-analyses conducted by Bellavance (2007) [46] and Kochi (2006) [47], but consistent with the mid-range in the meta-analysis conducted by Mrozek and Taylor (2002) [49]. This value also reflects the lower end of the US$2 million to US$4 million recommended by Abelson for public policy [38]. The VOSL of US$2 million is transferred to Cambodia by adjusting downwards by the ratio of GDP per capita in Cambodia to GDP per capita in the USA. The calculation is made at both official exchange rates (more conservative) as well as at purchasing power differences (less conservative), and assuming an income elasticity of 1.0. Direct exchange from higher to lower income countries implies an income elasticity assumption of 1.0, which may not be true in practice. Therefore, the benefits transfer from OECD studies was also made at income elasticity of 0.8 and 0.6. Values are shown in Table A20. 82
87 ANNEXES Table A20. Unit values for cost of a premature death Variables Values (US$, year 2005) Low Base case High Human capital approach (economic) years 12,098 17,223 36, years 14,913 20,328 40, years 9,569 10,795 13,895 Human capital approach (financial) Willingness to pay using benefits transfer method 2 VOSL Income elasticity 1.0 at OER 10,219 20,439 40,878 VOSL Income elasticity 0.8 at OER 25,559 51, ,236 VOSL Income elasticity 0.6 at OER 63, , ,692 Input values Value of a Statistical Life (VSL) in USA 1,000,000 2,000,000 4,000,000 GDP p.c. in Cambodia (using OER) GDP p.c. in USA (using OER) 43,740 43,740 43,740 GDP p.c. in Cambodia (using PPP) 2,929 2,929 2,929 GDP p.c. in USA (using PPP) 41,950 41,950 41,950 1 Low and high values are produced by using income per capita growth of 1% and 4% (base case 2%) 2 Low and high values are produced by using US$1 and US$4 million as VOSL (base US$2 million) A2 Water resources The 2003 United Nations Report Water for people, Water for life states that many rivers, lakes and groundwater resources are becoming increasingly polluted, and that human excreta is one of the most frequent sources of pollution [50]. In Southeast Asian countries, a significant proportion of human excreta is flushed directly into water resources due to low coverage of sewage treatment for piped sewerage, or else human excreta eventually finds its way into water resources through open defecation, leaking septic tanks or seepage from pit latrines. As a result, levels of suspended solids in rivers in Asia have risen by a factor of four over the last three decades and Asian rivers have a higher biological oxygen demand and bacterial content than the global average [50]. The results of polluted water on human activity are many: previously safe drinking water sources are rendered unusable, and water becomes less productive or less usable for agricultural purposes including fish production, or for industrial and domestic uses. According to the Asian Development Bank, the threat to fish production is especially important, given the economic importance, subsistence value as well as nutritional value of fish in the Southeast Asian region [51]. Domestic sources contribute importantly to water pollution in most developing countries, where the majority of households do not have their sewage or wastewater safely disposed of or treated. However, the presence of other sources of water pollution means that overall economic impact of polluted water cannot be attributed to poor sanitation alone. Pollutants which affect water-related economic activity include microorganisms, organics, chemicals, solids, gases and heat [52]. Pollution originates from a variety of sources: Households (sewage and grey water from bathing, laundry, cooking) Small industries (garments, washing, brewery) Manufacturing industries (production or processing) Other offices, hospitals, etc. Chemical fertilizers, pesticides, and treatment of acid-sulfate soils Animal waste Silt release following build-up behind dams Salinity intrusion from coastal areas 83
88 ANNEXES Major categories of water use include drinking water, domestic uses, crop and fish production, energy production, industry, recreation and transport. For some of these activities, good quality water is important such as for drinking while for other uses water quality standards are not so strict such as for agricultural and some industrial uses. Therefore, only selected impacts of polluted water are examined in this present study, with selection of uses of water where there is a strong proven association between poor sanitation and the associated costs. Annex B3 provides full algorithms for estimation of economic impacts of water resource. A2.1 Water quality measurement Inland water quality is affected by many variables, the two main ones being the quantity of polluting substances released and the overall quantity of water resources for absorption of the pollution load. Hence, water quality indicators will need to be interpreted based on these two variables, as well as the multitude of factors that determine these variables. Furthermore, the economic impact of polluted water depends on what productive and non-productive uses the different water resources have, or could have assuming improved water quality. Water quality monitoring is limited in Cambodia. Different organizations or agencies are interested in different uses of water, and hence measure different water quality indicators. In Cambodia, Phnom Penh Water Supply Authority (PPWSA) conducts water quality tests for the purposes of supplying water to Phnom Penh residents, covering 3 locations close to the city: Chroy Changva on the Mekong, Phum Prek on the Tonlé Sap river, and Chamkamon on the Bassac river. The Mekong River Commission (MRC) conducts water quality tests in many locations in Cambodia which are mainly on the Mekong river (upstream, midstream, and downstream locations) and the Tonlé Sap Lake. Table A21 below shows selected drinking water quality standards, comparing the figure based on WHO guideline with Cambodia standards. Some of the main implications for drinking water are pollution from infectious pathogens (microbial agents) such as E Coli, dangers from heavy metals, bad odor due to organics, turbidity caused by solids, and bad taste due to low ph and solids. Table A21. Selected drinking water quality standards Indicator Unit CNDWQS 1 WHO 2 Color Pt/Co 5 15 ph value Unit Suspended solids mg/l - 1 Turbidity NTU 5 5 Total dissolved solids mg/l Dissolved oxygen mg/l - <10 Total coliform cfu/100ml 0 0 Thermotolerant coliform cfu/100ml 0 0 N-Ammonia (NH3-N) mg/l Source: Phnom Penh Water Supply Authority, Cambodian National Drinking Water Quality Standard 2 The figures are adopted by PPWSA based on WHO guideline. These figures were used by PPWSA before the existence of CNDWQS. A2.2 Contribution of poor sanitation to water pollution Water pollution from domestic sources can be estimated from the annual release or eventual seepage of untreated feces, urine and gray water into inland water bodies. It is estimated by applying the number of population with unimproved sanitation, the proportion of sewage released to water bodies, and average human (and animal) waste production per year. Table A22 presents the figures and assumptions behind the release of human waste to water 84
89 ANNEXES bodies. Pollution load from human waste is based on an assumption of an average 0.15 kg feces production and 1.5 liter urine production per person per day. Table A22 shows the assumptions used in this study for estimating the amount of untreated sewage that is discharged to water bodies in Cambodia. According to the Municipality of Phnom Penh (MPP), it is estimated that more than 80% of household waste water in the capital is discharged to the wetland nearby Phnom Penh. The rest goes directly to the ground and water bodies. It is stated that the sewage water treated by wetland is considered safe to discharge to the water body 21. Based on the data from the Phnom Penh Department of Public Works and Transport (DPWT), the wetland can reduce the pollutants in sewage water such as suspended solids by 72%, BOD by 83%, and COD by 86%. According to Cambodian standards, this reduction of pollutants makes the waste water discharged from the wetland not overly harmful to the environment, or specifically to the receiving water body. On average the pollutants can be reduced by 80%. So for the purpose of this study, 20% is assumed for the sewerage system leaking to water bodies from the zone of Phnom Penh. For other zones, however, all sewerage system (100%) are assumed leak. In Cambodia, the majority of open defecation is to land (99%) and only 1% directly in water bodies 22. For septic tank, it is assumed that 90% of them are not properly managed or poorly designed without conforming to engineering standards. In addition, 40% of the effluents find their way to ground water. For pit latrines, 50% of the effluents are assumed to leak to the ground water bodies. Table A22. Proportion of untreated sewage discharged to water bodies Region % sewage discharged directly into water body % Sewerage systems leaking % septic tanks not managed properly % Total % of which to groundwater 1 % leaking pit latrine to groundwater 1 Phnom Penh Plains Tonlé Sap Coastal Plateau Total Source: Discussion with MRD and DPWT: leaking sewage, septic, and pit latrine 1 A crude assumption is made regarding the proportion of leak of septic tank and pit latrine that find their way to the ground water. It is assumed to be 40% for septic tank and 50% for pit latrine. Table A23 shows the assumptions on polluting substances discharged per day, reflecting urban households with piped water connection. Rural households without piped water connection are conservatively assumed to have zero gray water, but the same amount of sewage as urban households. According to interviews with an official of the Ministry of Environment (MoE), it is assumed that domestic waste accounts for somewhere between 60% and 70% of total water pollution in Cambodia. In this case, the attributable fraction of pollution to poor sanitation is therefore assumed to be 65%. In addition, approximately 75% of water uses are transformed into household waste water in the form of both gray water and sewage. In general, 50-80% of the total residential waste water is gray water 23. For the purpose of this study, however, 65% is assumed. 21 An interview with a lecturer of Royal University of Agriculture 22 Demand assessment for sanitary latrines in rural and urban areas of Cambodia, retrieved on October 29,
90 ANNEXES Table A23. Waste load production per capita per day, subdivided by gray water and sewage, for urban households with pipe connection Source Biological Oxygen Demand (grams) Chemical Oxygen Demand (grams) Nitrogen (grams) Total Suspended Solids (grams) Gray water Sewage Total Source: [53] A2.3 Cost implications of water pollution for drinking water supply Both water consumers and water providers treat water because water sources are not clean. Some households, particularly the more wealthy, purchase more expensive bottled water which is either chemically treated or from a protected (mineral) source. The more polluted the water source, the more likely the household will take some form of precautionary measures, which leads to higher unit cost of treatment. In some cases, households will not haul water from more polluted water sources if less polluted sources are available, but this may lead to additional time or financial costs. Given that drinking water sources are polluted from several sources and not just from poor sanitary practices, by removing the human (and animal) waste component of polluted water, the need to treat water is not altogether removed. However, the removal of human and animal waste content from water sources may reduce the necessity for treatment and/or it lowers the unit cost of treatment. This present study compares selected indicators from the water quality guidelines presented in Table A21 with available water quality measures to conclude how polluted water is for drinking purposes. Some of the main indicators which will cause households to purchase, treat or walk further to access cleaner water are perceived or actual presence of infectious pathogens (microbial agents) and heavy metals, bad odour due to organics, turbidity caused by solids, and bad taste due to low ph and solids. For the purposes of cost estimation, household drinking water sources are sub-divided into three categories (see Table A24 below): 1. Households receive piped water supply, sourced either from water treatment companies or from open community water sources. 2. Households purchase water from other non-piped suppliers, such as tanker truck, water by the bucket, or bottled water. 3. Households collect water from free or low cost community or public sources. Table A24 presents national level data with rural/urban breakdown. From the table, it is observed that about 282,000 households in Cambodia have piped water as their source of drinking water, while nearly 2.5 million households haul water from various sources. It is also noted that about 1.8 million households treat their water prior to consuming by using different methods. 86
91 ANNEXES Table A24. Numbers of households by main source of drinking water Location Piped water ( 000) Treatment plant Other source Other purchased water ( 000) Vendor Bottled water Hauled water ( 000) Households treating water themselves ( 000) Rural , ,491.7 Urban Total , ,843.6 Source: CDHS (2005) According to national data, households receiving their water supply from all sources tend to treat their water for drinking purposes, even when the water sources have been protected or properly treated. Several methods exist for household water treatment, including chemical treatment, filtration, boiling, and solar disinfection. However, national surveys indicate that the main treatment method in Cambodia is boiling (CDHS, CSES). In addition to households, some industries may also have to treat water that does not conform to the required properties for certain industrial processes. However, these costs are excluded in this present study due to the lack of information. Various methods are available to estimate costs to avoid drinking polluted water. The lower bound on financial cost could be reflected by identifying specific actions by water providers and households to remove bacteria, such as chemical treatment for piped water, open wells, and household treatment. The upper bound on financial cost of water pollution can be reflected by apportioning to poor sanitation a fraction of the total cost of water treatment and purchase. However, it is noted that households choose more convenient but more costly water sources for a variety of reasons, which include (but are not limited to) water pollution, convenience of access, time savings and no other available water supply. Hence the tariffs paid by households are adjusted downwards by a further 50% to account for these other benefits of piped water supply. This adjustment factor is referred to as Factor A. The economic costs of accessing (clean) drinking water includes not only the financial cost, but also the efforts made by households to access cleaner drinking water sources, such as walking further to protected wells or boreholes, and the time taken to treat water in the home. For accessing rainwater, however, the study assumes zero access cost. Algorithms used to calculate financial and economic costs of avertive behavior to avoid consumption of unclean water for drinking purposes are provided in Annex B3. Algorithms were applied at sub-national (regional) level, using data available on drinking water sources, prices, and household water treatment practices The minimum drinking water per capita per day was assumed to be 4 liters, taken from WHO sources [54]. For hauled water, the proportion of households traveling further to access cleaner water was crudely assumed to be 10% to reflect the proportion of populations living close to polluted water sources which are unusable for drinking water purposes (lakes, rivers and polluted groundwater); while additional journey time was taken from surveys of time for collecting drinking water i.e. from CDHS The value of time reflecting the welfare loss for those traveling to fetch water for drinking is assumed as 30% of an adult s income. The attribution to poor sanitation of the overall costs of sourcing clean water was made differently for the different water sources: Overall attributable water pollution to poor sanitation (Factor B): a judgment is made about this fraction based on available data on releases from industry, agriculture and domestic sources. It is assumed that this attributable fraction is 65%. Attributable fraction of water purchased due to poor sanitation (Factor C): given concerns of households about bacteria in water available from open sources, this fraction may be higher than the fraction above. Other characteristics of water available from local sources (taste, color, cloudiness) are also taken into account, which often account for switching sources. It is assumed that this fraction is 70%. 87
92 ANNEXES Attributable fraction of water treated (Factor D) at the household level due to poor sanitation is assumed to be 70%. In addition, due to the scarcity of data on costs that are used for the estimation of economic costs of water resource, some assumptions are made to enable estimation. The assumptions are, however, based on discussion with stakeholders, local citizens, and experts. Table A25 shows the assumed unit cost of water and water treatment (boiling). According to the table, piped water tariff is US$0.07 per m 3 in urban areas, while it is more than US$0.3 per m 3 in rural area. This can be explained by the fact that water supply in urban areas is more efficient than in rural areas. The water tariff for purchased water from vendor is roughly 15 times more than piped water tariff in rural areas, and 35 times that in urban areas. The bottle water is even more expensive with average cost of US$43 per m 3 calculated from a standard 20-liter bottle water. The water treatment cost is calculated for boiling method as it is the main method used in Cambodia. According to the table, the cost of boiling water in urban area is roughly US$16.5 per m 3 while it is only US$8 per m 3 in rural areas due to abundant fuel wood in rural areas which can be used for boiling water. Table A25. Unit cost of water Type of water use Unit cost (US$/m 3 ) Piped water tariff Rural 0.34 Urban 0.07 Purchased water (vendor) Rural 4.94 Urban 2.47 Purchased water (bottle) Rural Urban Water treatment cost Rural 8.23 Urban Source: Author s estimate based on actual market price A2.4 Water quality and domestic uses of water In addition to the uses of surface and groundwater sources for domestic use, industrial use, fisheries and agriculture, water is an essential ingredient to many other human and non-human activities [55]. In the present study, it is not possible to conduct an exhaustive analysis of all the different uses of water. However, the following three categories were assessed for relevance: Non-commercial household (domestic) activities Leisure activities [56] Wildlife, covering flora and fauna and animal species. Non-commercial activities are concentrated at the household level, and include water for cooking purposes, washing clothes and kitchenware, and personal hygiene. Also, some traditional customs as well as leisure activities are closely related to water. Again, some of these require good quality water given it will be ingested, while others do not require quality water. 88
93 ANNEXES Activities affected by below standard water quality were assessed in the following way: Proportion of households and population that use untreated or unprotected surface or ground water for cooking, washing and bathing. Even though, the quality of water for non-drinking purpose may be lower than that for drinking, the water quality for domestic used needs to be at an acceptable level. The polluted water can contaminate the human body through these activities. However, in many areas in Cambodia, people usually use well, pond or open river for washing and bathing. Proportion of households and population that switch water source due to the preference to have clean water for domestic activities. For example, for laundry and bathing, purchased water (via pipe or vendor) may be used rather than using local water bodies. Although this case may exist, the fact that people choose other sources is not mainly because the local water source is polluted by poor sanitation and hygiene. The main reason for this is that the local water bodies in some regions of the country contain some minerals creating unfamiliar smell to users and coloring clothes after laundry 24. Extent of other cultural and leisure activities related to water, and that require water of a minimum quality standard, including swimming. Wildlife, large and small, is dependent on water resources. For plants and trees, much of the water need is met from rainfall, and hence water pollution is not an issue. Some plants and trees, most animals and all aquatic life depend on surface water and therefore can be affected by water polluted from different anthropogenic sources. Despite the importance of water use in the three categories above, in this study only the costs of accessing domestic water are evaluated quantitatively. For the purpose of estimation, the study adopts the domestic water use of 28 liters per day 25 (including drinking water of 4 liters), which is based on minimum requirements defined by WHO. It is, however, assumed that purchased water users use water twice less than those using piped water, i.e. 50% of water used by piped water users. A2.5 Water quality and fish production value Fisheries in Cambodia Fisheries play a very important role in Cambodia in providing employment, income and food security to many people. The vast majority of people in Cambodia depend upon fish as a central part of their diet from which they obtain protein and vital nutrients and vitamins. It is estimated that 90% of animal protein consumed by the people in central Cambodia is from fish [57]. On average, however, the protein from fish accounts for 75% of the total animal protein [58]. It is estimated that 11% of the households in the fishing-dependent communes around the great lake and along the Mekong and Bassac Rivers are engaged in full-time fishing and related activities, while other 35% are engaged in part-time [58]. Currently, the fisheries sector employs around 259,000 people and contributes 7.3% to the country s GDP in As of 2006, Cambodia exported 12,000 tons of fresh water fish, 7,500 tons of marine water fish, and 6,835 tons of other seafood 26. Pollution and fish production Pollution and river diversion have driven freshwater fisheries into collapse worldwide, and the extinction of freshwater species far outpaces the extinction of mammals and birds [59-61]. Fish populations are affected by a multitude of changes taking place due to human interventions, such as hydroelectric dams, water diversions for agriculture, flood control levees, dredging, water pollution, and habitat degradation such as logging. According to the Food and Agriculture Organization (FAO), the long-term productivity of fish stocks is related to the carrying capacity of their environment, which alters as a result of natural variability and of changes induced by human activity, such as coastal habitat degradation, destructive fishing methods and pollution. (page 47, [62]). Environmental degradation has been cited as one of the key threats to inland fish producers in countries of the lower Mekong basin [63]. Of 24 An interview with Dr. Chea Samnang, Ministry of Rural Development 25 State of the Environment report 2004, MoE (p.77) 26 Ministry of Agriculture, Forestry and Fisheries 89
94 ANNEXES particular concern for water quality for fish production in Southeast Asia are suspended solids, dissolved oxygen, heavy metals and pesticides [64]. However, as one of the few publications on water quality and fish production in Asia notes (writing in 1986) data on the effect of water quality on Asian species of fish are not readily accessible (page 15, [64]). Furthermore, it is difficult to predict the exact impact of water pollution on fish production given variations between fish species and the multiple other determinants of fish production such as food availability, water depth, flow, and temperature. Domestic sources contribute importantly to water pollution, largely through the biological oxygen demand (BOD) exerted by organic matter which reduces dissolved oxygen levels [65] 27. Fish living below a sewage treatment plant have a significantly higher mortality rate than fish upstream [66-68]. Pharmaceutical discharge in urine can affect fish health directly. The scientific literature testifies, albeit incompletely, to the adverse effects of sewage release on fish reproduction and fish growth. One key determinant of fish health which has received attention from scientists is the level of dissolved oxygen [66-76]. For example, experiments undertaken in Canada on native fish and benthic macroinvertebrate species showed that exposure to low dissolved oxygen and low temperatures caused delays in hatching of eggs, reduced mass of fish post-hatch, and depressed feeding rates and lowered survival of fish [72]. Additionally, micro-organisms contained in human and animal waste such as parasites and bacteria have a number of implications for fish health [63, 70, 71, 75, 76], as well as safety of fish for human consumption [66, 69, 77-80]. Common illnesses from contaminated fish and shell fish include typhoid, salmonellosis, gastroenteritis, infectious hepatitis, Vibrio parahaemolyticus and Vibrio vulnificus infections, paralytic shellfish poisoning (PSP), and amnesic shellfish poisoning (ASP). A further consideration that needs to be addressed is the fact that, in many contexts, the nutrients from sewage act as a source of food for fish, and hence positively affect the production of fish. This happens both intentionally, when sewage is fed to farmed fish in a regulated way, and unintentionally when fish in open water bodies are exposed to untreated sewage disposed upstream. Hence, in recognizing the benefits of sewage for fish production, the impact analysis addresses only unregulated, unintentional, pollution of water with sewage. It should be noted, though, that sewage-fed farmed fish may not be optimally managed, and negative health effects may result. Methods for modeling the relationship between sewage release and fish production Given the lack of empirical evidence linking water quality and fish production in Cambodia, this study uses innovative methods to examine the likely importance of sewage release for fish production. While the following three key links are identified, only the first is assessed quantitatively in this study: The proven link between sewage and dissolved oxygen levels, and the resulting impact of lowered dissolved oxygen levels on fish production A major determinant of fish reproduction, growth and survivability is dissolved oxygen (DO). When an organic waste is discharged into an aquatic system, a biological oxygen demand (BOD) is created. BOD is a measure of the oxygen required to break down organic compounds, and high BOD levels significantly deplete the amount of dissolved oxygen in surface water. Consequently high BOD levels have a detrimental effect on the health of aquatic species that require elevated levels of DO. From human waste, damages result from direct biological oxygen demand, as well as increased growth of algae from nitrates and phosphorous contained in human waste. The algae biodegrade the nutrients, thus reducing the amount of DO available. 28 Dissolved oxygen was selected as the key water quality parameter because aquatic organisms require oxygen in specified concentration ranges for respiration and efficient metabolism, and because dissolved oxygen concentration changes above or below this range can have adverse physiological effects. Even short-lived anoxic and hypoxic events can cause high mortality rates of aquatic organisms. Exposure to low oxygen concentrations can have an immune suppression effect on fish which can elevate their susceptibility to diseases for several years. Moreover, the toxicity of many toxicants (lead, zinc, copper, cyanide, ammonia, hydrogen sulfide and pentachlorophenol) can double when DO is reduced from 10 to 5 mg/l. The amount of oxygen available in the water also decreases with temperature and when plants die. Oxygen requirements increase at a higher temperature (e.g. an increase in water temperature from 10 to 20 C at least doubles the oxygen demand). The presence of other pollutants such as nitrogen and marine life overcrowding reduce DO levels. In cloudy conditions, plants use up more of the available DO. Plants proliferate with the presence of nitrate and phosphates from agricultural run-off, sewage and excess fish feed. 90
95 ANNEXES The proven link between micro-biological contents of water and fish disease, and hence survival. The link between micro-biological contents of water inhabited by fish and the transmission of disease to humans via fish consumption, due to inadequate de-contamination of fish prior to consumption. This study assesses the water quality indicators available for different freshwater locations where fish are (or used to be) farmed or caught, and assesses the various issues related to fish reproduction, fish populations, and overall fish health, and attributes estimated economic impact to poor sanitation (sewage and grey water release) as one of several sources of water pollution in those water bodies. The focus of this study is on freshwater fish, given that dissolved oxygen is more affected in water bodies where oxygen depletion is more acute, resulting from release of untreated sewage into freshwater. It is recognized that the impact of poor sanitation on fish stock, fish growth and eventual fish catch is extremely difficult to quantify. Coefficients linking water body pollution and yield reduction have not been developed. For a crude quantification of the possible loss in fish value due to water pollution, a modeled relationship based on assumptions is used, represented in Figure 6. The Figure shows the estimated reduction in volume of fish caught at lower levels of dissolved oxygen, for an average fish species in Cambodia. The amount of oxygen needed for the survival of fish varies with time of year and species. Oxygen needs vary even with the life stage of a species. Young species tend to be more sensitive to low oxygen conditions than adults. Also important is the duration of periods with low oxygen. Most species can survive short periods of reduced oxygen, but suffer during longer periods. According to Meck [74] and others, the minimum limiting oxygen concentrations for a fish is dependent upon its species, physical state, level of activity, long term acclimation, and stress tolerance. A research study from the USA examined the lowest DO at which different fish species survived for 24 hours, varying from 6.0 mg/l down to 3.3 mg/l [73]. Usually larger fish are affected by low DO before smaller fish. Given the lack of published studies on the empirical relationship between these two variables, the following assumptions were made based on a mixture of available scientific literature, internet sources, and expert opinion. A range is assessed in sensitivity analysis, shown by dotted line in Figure 6. Water with an oxygen concentration of less than 3.0 mg/l will generally not support fish. When concentrations fall to about mg/l, fish start gasping for air at the surface or huddle around water falls or higher concentration points. Numerous scientific studies suggest that parts per million (ppm) of DO is the minimum amount that will support a fish population for short periods of hours. Above 5.0 mg/l, almost all aquatic organisms can survive indefinitely, provided other environmental parameters are within allowable limits. When there are too many bacteria or other aquatic organisms in the area, they may overpopulate, using DO in great amounts [67]. Levels of 6.0 mg/l and above support spawning, and above 7.0 mg/l support growth and activity [72, 73]. The DO level in good fishing waters generally averages about 9.0 parts per million (ppm). In order to assess likely impacts of polluted water on fish production, geographical locations of the principal fish catches and water quality indicators are matched for major selected inland water bodies. Based on the observed DO levels in these water bodies, the function in Figure 6 is applied that estimates the loss of fish catch due to lower than optimal levels of dissolved oxygen. The current fish production levels are adjusted upwards to predict what the fish catch would be in the presence of optimal DO levels, using algorithms provided in Annex B3. 91
96 ANNEXES Figure 6. Modeled relationship between dissolved oxygen levels and fish production (with lower and upper range) Dissolved oxygen (mg/l) Fish production (% optimal level) Source: Authors own estimates Notes: the upper line represents the maximum effect of reduced DO levels on fish production volume, with linear reduction from 8mg/L to 4mg/L. In the base case, the linear reduction from 7.5mg/L to 3mg/L, while for the least effect, the linear reduction from 6mg/L to 2mg/L. Impact on fish reproduction and growth due to water pollution is assessed by spatially comparing actual yields under current pollution levels and potential yields under a situation of good water quality, based on a water quality fish production function. Where fish yields have dropped close to zero, historical records were sought for when fish were previously caught in the given water body. The focus of the initial analysis is on fish production that is officially recorded in national statistics. Where fish catch values are available, these are recorded; where not available, financial value is estimated by applying current market prices to the average type of fish. The economic impact of low DO levels for non-recorded fish catch is not assessed in the present study. Likewise for the economic estimates, the fish catch from subsistence fishing was not estimated; and the nutritional importance is not discussed despite the fact that fish has been very important in providing food and nutrition to the people. Given the shortage of data, seasonal patterns are not assessed either although the water quality by season/month is strongly related to the fish catch values by season. Moreover, since the fish catch region is based on the geographic location, it is hard to match the fish catch with the specific water bodies. To estimate attributable impact to poor sanitation, a proportion of this loss is assigned to sewage and domestic gray water, as compared to other sources of water pollution (industry, agriculture, silt/natural erosion). Normally, this can be done by estimating the proportion of BOD from these different sources. Due to the lack of reliable information on proportion of BOD from poor sanitation, it is assumed that poor sanitation contributes 65% of BOD to the water body in Cambodia. A3 Environment The release of waste into the environment has other effects besides water pollution, given the unpleasant smells emanating from feces, urine, and other waste products [81, 82]. In countries where open defecation and unofficial dumping of waste are common, the quality of land is affected, rendering it unattractive and unusable for productive use. Even in Asian countries where municipalities are responsible for collecting solid waste, solid waste collection is 92
97 ANNEXES not commonly done, or it is inadequately done. Unregulated waste dumping presents a threat to those disposing of waste, those living in the vicinity of the dumping area, as well as the poorest of the poor who often live off the waste (e.g. recycling activities). Waste grounds are also inhabited by stray dogs or other animals, which are often diseased and pose a threat to human health. Even where there is a private or public agency taking care of disposal, it is often not performed according to plan. In cities, waste carts stay on the streets for many days, with resulting smell and unsightliness for local inhabitants and tourists. These aesthetic aspects of sanitation cause a loss of welfare for those coming into contact with the waste. However, given the lack of available data on these aspects, there is considerable uncertainty on the overall importance of these impacts. A3.1 Aesthetics Aesthetics are not strongly related to productivity or income. Economic evaluation studies do not usually quantify aesthetics such as smell and sight in economic terms. Instead these aspects are described as a potential additional benefit provided by sanitation programs. Studies assessing welfare impacts of sanitation options, including willingness to pay studies, tend to limit the focus to the physical boundaries of the household and not assess impacts on the broader environment [83, 84]. Hence, findings on welfare aspects of aesthetics in this study are presented mainly in qualitative terms. In Cambodia, due to lack of published information, most information was collected based on interviews with experts who are working closely to the field of environment. In this study, aesthetics refers to the impacts of waste on air quality (smell) and visual appearance caused by inappropriate waste disposal. Since the problem of solid waste is seen as a major environmental concern, the main focus is on the inadequate disposal of solid waste by households and waste disposal services. The practice of solid waste handling and management in Cambodia is briefly described, and its impact is qualitatively assessed based on experts opinion. The key informants in this regard are the Phnom Penh Waste Management (PPWM), Ministry of Environment (MoE), and Municipality of Phnom Penh (MPP). A3.2 Land quality When it has alternative uses, land is a tradable commodity. In this regard, land that is used for improper, unofficial disposal of waste will be unusable for other more productive uses, and hence will reflect an economic loss to society. This present study assesses the waste disposal practices and resulting effects on land availability and land quality descriptively. Due to the lack of previous studies on this particular issue, the information is obtained from interviews with key resource people. A4 Other welfare The type of sanitation facility a household has will have a range of impacts on population welfare. An important but difficult to quantify aspect is the welfare impact on individuals and families who use a sub-standard, uncomfortable latrine or who have no latrine at all. Except for the disease impact (see section A1), these less tangible aspects of human welfare have limited direct financial implications, and cannot easily be captured by market values. However, in the broader assessment of welfare impact on households and individuals, these aspects are potentially important [85]. Intangible aspects include user preferences for sanitation options. For women and girls especially, there can be physical dangers of using distant toilets or open spaces, especially at night; this practice may also cause damage to a person s status. More tangible impacts of sub-standard latrine or no facilities is the time spent journeying to open defecation sites or public latrines, or waiting due to insufficient shared or public latrines per head of population [86]. Time savings can be used for other productive or leisure activities, and thus have an economic value. Also, life decisions such as schooling or choice of employment, and absences from school and the workplace, can be linked to the presence of sub-standard or no latrines [87]. 93
98 ANNEXES A4.1 Intangible user preferences User preferences which could be described as intangible or difficult to quantify include: Comfort & acceptability the acceptability of the squatting or seating position; the ease to perform personal hygiene functions; the freedom from rushing to complete toilet-going due to unhygienic latrine conditions, flies and foul smelling air. Privacy and convenience the benefits of not being seen using the toilet; or being seen walking to access toilet facilities (women) [88]. Security the location of the latrine within or near to the home means that excursions to the outdoor do not need to be made for toilet-going needs, in particular at night, where there may be dangers (theft, attack, rape, and other injuries sustained from dangerous animals or snakes). Conflict on-plot sanitation can avoid conflict with neighbours or the community, where tensions exist on the shared facilities, or fields and rivers for open defecation. Status and prestige when visitors come to the house, it gives prestige to the household to be able to offer their guests a clean and convenient toilet to use. Families may hold more social events at their house as a result of a clean latrine. According to Table A26 below, there are nearly 10 million people who do not have a proper latrine; so they still practice open defecation. Of those people, up to 93% are living in rural areas, while 7% are in urban areas. Since open defecation is a practice which does not provide comfort and privacy for toilet going, it can be argued that the majority of Cambodian people still experience discomfort and lack of privacy. In addition, as many as 245,000 people use uncovered latrines which are open to flies causing health hazard and create bad smell affecting them in intangible ways. It is also observed that about 0.6 million people are using shared latrine facilities which are inconvenient to them in terms of time lost. Table A26. Lack of latrine indicators of defecation conditions Area No latrine: open defecation ( 000) Open pit: no covering ( 000) Unimproved latrine which open to flies etc. ( 000) Shared facilities (loss time) ( 000) Number % Number % Number % Number % Rural 9, Urban Total 9, Source: CDHS (2005), Population Projection A4.2 Access time Welfare loss from increased access time due to unimproved sanitation can be due to journey time for open defecation or waiting time for shared or public latrine. The algorithms for the calculation are provided in Annex B4. The welfare loss due to journey time and waiting time has some economic values. As with health time productivity loss, the adults time value reflecting welfare loss is assumed as 30% of their income while children s time value is worth 50% of those adults time value. For shared toilet, it is assumed that a shared latrine is normally shared by 2-3 households which are equivalent to roughly 12.5 people. In this case, it is assumed that the average waiting time for shared latrine is 3 minutes per person per day. According to local citizens, journey time to and from open defecation site is roughly 10 minutes. So, assuming conservatively that a person visits toilet only once a day (excluding urination), Table A27 gives the average access time for toilet-going. 94
99 ANNEXES Table A27. Toilet access, by geographical location sub-type Location Population with access time already minimized ( 000) Population experiencing sub-optimal access in terms of proximity & waiting time ( 000) Shared latrines Open defecation Average time access per day for those with sub-optimal access (minutes) Shared latrines Open defecation Rural 1, , Urban 1, Total 3, , Source: Compiled using CDHS (2005); and Population Projection , NIS A4.3 Impact on life decisions and behavior Running water supply and sanitary latrines in schools are a luxury in most of the developing world, and in many workplaces latrines are unhygienic, poorly maintained, and do not cater for special needs of women. The presence of hygienic and private sanitation facilities in schools has been shown to affect enrolment and attendance, especially for girls [87, 89]. Good latrine access at the workplace has implications for women participation at traditionally maledominated employment areas. Furthermore, sanitary and adequate latrines in schools and at workplaces not only affect participation rates, but they also improve welfare of all pupils and employees. Given the complex web of causative factors and eventual life decisions, and the many factors determining absenteeism from school or the workplace, it becomes difficult to quantify the exact relationship between poor sanitation conditions, education and work decisions, and eventual economic outcomes. However, it can be easily seen how sanitation is really important in education and work decisions, especially among girls and women. It has been recognized that cleanliness and privacy related to toilet have a strong impact on girls and women attitudes in participating in education 29. Most students perceive that a good toilet at school makes them at ease when they need to use it during their study. If the toilet and the environment are not good enough, the students tend not to be willing to come to school and, in some cases may result in an absence from school. It has been argued that the frequent absenteeism has made the students unable to catch up the lesson leading to high dropout rate. Cambodian women and girls are shy and have difficulty in using the toilet that does not have water supply especially while they are in menstrual period. With a good and clean latrine at school, female students will have more privacy as they can avoid from being seen by others when using toilet. Besides the privacy issue, schools having poor sanitation may strongly affect students health and feeling. These effects will in turn have impacts on their study performance. Based on the observation of an Ministry of Education Youth and Sports (MoEYS) official, school with proper toilets is likely to perform better than those without toilets because both students and teachers feel more at ease about toilet-going. In the case where there are not adequate toilet facilities at schools, teachers and students usually need to wait uncomfortably for the study session to end to rush to the toilet at home. For the school equipped with toilets facilities, it can be observed that toilets for girls are usually separated from those for boys. A news article highlighted that the shortage of latrines at school in Cambodia is currently keeping girls out of school. It was quoted that when school girls get older, toilet is increasingly important 30. It is recognized that lack of education has largely constrained employment opportunities for Cambodian women. Regarding workplace, it is generally stated that workplaces such as factories in Cambodia have toilets being in good 29 Interview with MoYES official who is working in education health 30 The Cambodia Daily, Volume 36 Issue 39, February 20,
100 ANNEXES condition and enough for workers to use 31. Nevertheless, from perspective of some workers, the toilets in most factories are not clean enough which may in turn have impacts on their health and working condition. Table A28 below shows the number of schools by region having toilet facility. From the table, there are nearly 2,000 primary schools in Cambodia lacking of latrines, while nearly 2,500 do not have water supply. In addition, more than 200 and nearly 400 secondary schools are lacking of toilet and water supply respectively. However, it is important to note that not all toilets facilities at school are adequate. According to a MoEYS official, in Phnom Penh there are only about 30 schools having adequate latrines, while in the areas outside Phnom Penh, the number is very uncertain, but it may turn out to be very low. It is also observable that some schools have separate toilets for teacher and students, where in most cases latrines for teachers are in better condition than latrines for students. Table A28. Water and sanitation coverage in schools ( ) Establishment Toilet access Water supply access With Without With Without Primary school Phnom Penh Plains 1, , Tonlé Sap 1, , Coastal Plateau/Mountain Total 4,354 1,923 3,784 2,493 Secondary school Phnom Penh Plains Tonlé Sap Coastal Plateau/Mountain Total Source: Ministry of Education Youth and Sports Menstruation may be one of the obstacles causing girls not to come to school which do not have water supply and clean toilets. Besides, this is not the only reason keeping the girls out of school. It is recognized that the dropout of girls from school is known to be caused by several reasons: Some girls keep out of school because they are busy to help family s living as some go to work in the garment factory. Some poor families decide not to send their daughters to school, as they cannot afford for their children education. Some female students also drop out of schools because of the distance and safety to commute their schools. Based on Table A29 below, the number of boys enrolling in primary school is higher than girls of about 8.3%. While more than 1.3 million boys enrolling in primary school, there are only 1.2 million female students have done so for the school year It is also noticed that the number of male enrollment is even much higher than female students in secondary school. Among 0.8 million secondary school students in , there are about 0.5 million boys enrolling in school comparing to 0.3 million girls. Although the difference is not significant, this figure highlights the low participation rate of girls in education, where, among others, one of the possible reasons 31 An interview with MoLVT official 96
101 ANNEXES is the lack of sanitation as stated earlier. Regarding the number of teachers at school, among 97,831 teachers, about 39% of teachers are women comparing to 60% male teachers. In terms of employment, it should be noted from the table that the number of female employment is more than that of male of 7%. Here, it is not because women have more job opportunities than men, but because most women involve in unskilled employment with very limited future prospects. Table A29. Male / female participation rates in school and workplace ( ) Variables Female Male Total Primary school Enrolment (million) Completion rate (%) Drop-out rate (%) Secondary school Enrolment (million) Completion rate (%) Drop-out rate (%) Teacher ( 000) Employment in 2001 (million) Source: Ministry of Education Youth and Sports, and Statistical yearbook, Number of drop-out divided by number of enrolment Based on the above data sources, the expected impacts of poor sanitation in schools and workplaces are assessed by estimating school days and workdays lost due to poor sanitation: 1. School enrolment and completion: a proportion of non-enrolled pupils and absentee days are apportioned to lack of sanitation. However, the attributable fraction of non-enrollment and absenteeism to poor sanitation is not known in Cambodia. 2. From Table A29 above, the employment rate among women and men are very much similar. In Cambodia, the information on days lost from work for women in workplaces is very limited, and hence no link is possible with the adequacy or inadequacy of latrines in the workplace. Nonetheless, if the days lost incurs, there would be some economic cost in that as it impacts on the productivity of affected workers. A5 Tourism Tourists are sensitive to their environment, and are less likely to choose destinations which are dirty or where the risk of disease is high. In Cambodia, while tourism sector is one of the main contributors to the economy, it is important that tourism impact of poor sanitation is addressed in this study. It is recognized that a country may be losing tourist revenues due to the degraded environment and high infectious disease rates among the general population, as well as actual or perceived health risks to tourists. Hence any initiative to attract more tourists to a country will need to consider the part sanitation plays in this [90-92]. A5.1 Introduction to tourism Poor sanitation can have several impacts beyond those traditionally assessed such as health and environmental impacts. However, the linkages are sometimes difficult to make, due to lack of data as well as difficulties in isolating specific cause-effect relationships. One such impact that this study attempts to quantify is that of tourism. Unarguably, the quantity of tourists choosing a country for their holiday is partially related to the general sanitary conditions of 97
102 ANNEXES the country, as well as whether the country has suffered specific events such as a cholera epidemic. Better sanitary conditions can lead to attracting high value tourists tourist who are willing to pay more for their holiday. The attractiveness of a country for tourists is related to several aspects of sanitation quality of water resources (either for enjoyment or for use), quality of the environment (smell, sightlines), food safety (hygiene in food preparation), general availability of toilets offering comfort and privacy in restaurants, bus stations, etc, and health risks. In Cambodia, there are a lot of tourist places such as Angkor Wat in Siem Reap that attract more than 440 thousands tourists in 2005 which accounts for 31% of total tourist arrivals to Cambodia. With the increasing in numbers of tourists, the authority builds and develops the facilities in this area to fit the tourist requirement. Hundreds of hotels, restaurants which provide convenient services have been established. Moreover, clean toilets nearby temple areas are set up for all tourists who need to use during their traveling. However, it is argued that a number of tourists have had diarrhea during their stay in Cambodia which may be caused by poor sanitation and hygiene in the areas around tourism spot 32. The economic impact of tourism assessed in this study is the sub-optimal exploitation of tourist potential in the country. A5.2 Tourism and sanitation Tourism is a booming industry, and continues to experience double-digit growth in many developing countries around the world [93], fuelled by cheapening airfare costs coupled with the realization of developing country governments and private sector of the potential economic benefits of tourism. Tourism is playing an important role in boosting the revenues of governments as well as contributing to much-needed economic growth in the developing world. Countries of Southeast Asia have been among those enjoying year-on-year increases in tourist numbers and income. In 2006, about 1.7 million visitors coming from different regions visited Cambodia which is 20% higher than in In addition, the number of holiday tourists is very high compared to business visitors and visitors who come for other purposes. More than 97% of tourists come for holiday purposes as opposed to 0.32% for business. The national income from tourism sector accounts for more than 1 billion US$, which is 26% higher than in 2005, showing the increasing importance of tourism sector in Cambodian economy. In the Asian region, some countries have done better than others at exploiting the growth in tourism. Tourist preferences clearly play a key role in this: there are clearly many factors that determine tourists choice of destination, and sanitation will be one among many. Tourist growth depends on what the country can offer such as tourist transport infrastructure, quality of accommodation and restaurants, clean and adequate sanitation facilities, type of experience offered (culture, climate, culinary, relaxation), and safety. Also, the price of tourist services determines the relative attractiveness of a country for foreign tourists, which is partially determined by the stability and level of the local currency. Tourists are often heavily influenced in their choice of destination by the availability of information (positive media) on a destination, the offer of package tours or package deals in their home country, and/or the ease of booking flights and hotels on the internet or by phone. The availability of package deals and the ease of bookings are themselves a function of the level of development of a tourist destination. Hence there is a self-reinforcing loop, which can over time lead to large resort complexes and tourist destinations such as the various coasts and islands of Southern Europe and the Caribbean, coastal areas of Thailand and Malaysia, and well known tropical islands (Zanzibar, Maldives), among others. What role does sanitation play in a country s attractiveness for tourists? The environment is one of the key attracting elements of a tourist destination as a popular refrain goes: sun, sea and sand which are recognised factors for attracting tourists. But if the sea is brown from the pollution released by the country s rivers, if the sand or 32 An interview with Association of Travel Agent 98
103 ANNEXES roadsides are soiled with the excreta of the local inhabitants, and if food preparation standards are low, then the tourism potential of a location is clearly limited [94]. Tourist perceptions about the sanitary conditions of a potential tourist destination are gathered from their own research and experience, as well as from the stories and perceptions circulating via travel agencies and social networks. Important aspects for sanitary conditions to tourists include, but are not limited to: Aesthetics of the local environment (sight, smell) Cleanness of water for swimming or sightseeing Availability of clean toilets and water, soaps and towels for personal hygiene, in accommodation, restaurants, bus stations etc. Expectations of getting sick either from food poisoning or environmental factors It is also noted that the minister of tourism has recently recognized the importance of hygienic restrooms in attracting tourists to Cambodia, and has expressed the intention to improve toilets in the tourism sites and in the whole country. A major step that Ministry of Tourism (MoT) will do is that restaurants and hotels in Cambodia will be rated and classified according to their toilet facilities. It is believed that this action will provide incentive for those establishments to improve their restrooms adequately 33. A5.3 Estimation of tourist losses due to poor sanitation While it is accepted that the standards of tourist facilities in Cambodia are improving over time, this present study assumes, based on evidence, that the sanitary standards remain sub-optimal. Hence, it is hypothesized that Cambodia could attract more tourists now and in the future; one of the aspects that must improve for that to happen is hygiene and sanitation. Given the limited options for countries to boost tourist numbers and hotel occupancy rates from improved sanitation in the near-term, the tourist losses are not estimates as a financial cost. However, in the longer term it is assumed that Cambodia can not only increase the hotel occupancy rates under the existing capacity constraints of tourist infrastructure (airport, hotels, internal transport, restaurants), but also to expand the tourist infrastructure as well as making tourist destinations more attractive for tourists to accommodate significantly increased foreign tourist arrivals. Infrastructure requirements were based on mid- to long-term government targets for tourist growth and total numbers; where these were not available, realistic assumptions are made of the tourist growth achievable over a five year period until A target occupancy rate of 80% is assumed for the present study although it is largely season-specific. The formula is shown in algorithm in Annex B5, and the values used presented in Table A30. According to Ministry of Tourism (MoT), the occupancy rate of tourism in Cambodia in 2006 is nearly 55%. Moreover, given the importance of tourism sector in the country and possible sensitivity of sanitation on tourism growth, it is assumed that the attributable fraction of tourism loss to poor sanitation is 10%. This attribution can be justified by the increasing interests of MoT in improving sanitation to attract tourists to the country. 33 The Cambodia Daily, Volume 37 Issue 67, August 17,
104 ANNEXES Table A30. Inputs for calculating the financial losses in tourist receipts 1 Parameter Symbol Cambodia Actual occupancy (%) OC A 55 Potential occupancy (%) OC O 80 Contribution of sanitation to tourist losses (%) φ 10 Actual number of tourists (millions) ta 1.7 Average expenditure per tourist (US$/day) E 95 Average length of stay (days) Source: Ministry of Tourism, Table reflects values used for calculation of losses due to lower than optimal foreign tourists. Economic losses are reflected by the gap between the current tourist revenues, and the tourist revenues that would be possible at significantly higher tourist visit numbers such as those experienced by neighboring countries with higher visit rates. At present, the potential number of tourists at an assumed optimal occupancy rate of 80% is 2.5 million, which is 46% higher than the tourist number in current occupancy rate. In a potential future scenario, the prospect of an annual tourist increase of 20% is adopted to estimate the potential number of tourists, based the tourism vision of the Ministry of Tourism [95]. Hence, based on 20% increase of tourist capacity at 80% occupancy rate, the potential number of tourists to Cambodia is about 3 million per year. Then the economic costs can be estimated using algorithm in Annex B5. It is worth to note that the economic losses are estimated at the average annual loss over the mid-term period (5 years) based on the tourist capacity and the target occupancy rates. A5.4 Tourist sickness Once the tourist is on-site, they may experience a reduction in enjoyment of their holiday experience by becoming sick due to a disease related to poor sanitation and hygiene. While having an illness episode is not only a bad experience in itself, it also eats into holiday time, and may incur some expenses related to treatment. In the worst case, the return journey of the tourist is affected or they need to get emergency transport. However, the number of sick tourists and the disease episode that may be necessary in the calculation of economic loss in Cambodia is not well-documented. Nonetheless, it can be argued that, for the economic cost, the welfare loss of the tourist from having days off sick is added to the financial cost of sickness treatment. However, due to lack of data, the estimation of economic cost is not included in the present study. It is, however, noted that although these losses may incur among tourists, they may need to be excluded from national estimates of economic impact, as the majority of them are experienced by foreigners. Nevertheless, the tourist sickness may have negative implications in the long-term development of tourism sector in Cambodia. The frequent occurrence of sickness among tourists may, to some extent, slow down the growth of tourist arrivals in the future, which badly impacts on the country s economic growth. A6 Impact mitigation associated with improved sanitation and hygiene Having estimated the costs of poor sanitation, from a policy viewpoint it is important to know by how much these financial and economic costs can be reduced by implementing improved sanitation options. While there are many types and configurations of sanitation improvement available, this present study aims to estimate potential benefits obtainable for a small number of generic categories of sanitation improvement. This aids interpretability by policy makers. Indeed, it is the aim of the second study of ESI to estimate the costs and benefits of specific sanitation options, which are the most relevant policy options in each country context. 100
105 ANNEXES A6.1 Health impacts mitigated The financial and economic gains from improved sanitation and hygiene will be a proportion of the total losses estimated for diseases associated with poor sanitation and hygiene. The proportion of costs avertable will depend on the expected effectiveness of the interventions employed to prevent disease. No health intervention, as implemented in practice, will be 100% effective in reducing the overall loss. However, sanitation and hygiene interventions have been proven to be effective in a number of field trials [96, 97]. Given that good quality epidemiological studies are limited in number, and have already been reviewed in previous meta-analyses, no additional country-level studies were used to estimate disease cases prevented. Hence the estimates of intervention effectiveness are based on the international literature, which includes the most up-to-date reviews on effectiveness [96-99]. The latest and most authoritative review by Fewtrell et al (2005) presented summaries of effectiveness from a metaanalysis of field trials on water, sanitation and hygiene separately, as well as together [97]. The reader is referred to the paper for details of individual studies. Table A31 below shows the summary of the meta-analysis. Table A31. Summary of meta-analysis results on WSH intervention efficacy for diarrheal disease reduction Intervention Number of Estimate of effect (relative risk) 2 studies included 1 Low Mid High Household treatment of water Water supply Sanitation Hygiene Multiple interventions Source: Fewtrell e al (2005) [97] 1 Includes only studies of good quality, as defined by Fewtrell et al 2 Relative risk of disease when intervention tested against baseline of no intervention (relative risk of 1.0) These relative risk reductions are used to estimate expected rates of diarrhea under a situation of basic improved sanitation and hygiene practices, and carried through to estimation of health care cost, productivity and income, and premature deaths. Hence, based on the literature, the following reductions of disease incidence are predicted: Sanitation: incidence reduced = 32% (range 13% to 47%) Hygiene: incidence reduced = 45% (range 25% to 60%) Note however that hygiene and sanitation interventions implemented together will not have the sum of the individual effects. The literature does not provide evidence for the proposition that two interventions are more effective than one. This point needs to be taken into account in interpreting the estimations of economic loss avoided from health interventions. A6.2 Other economic losses due to poor sanitation Given that the attributed costs of poor household sanitation are the object of the study (described in sections A1 to A5 above), the effect of improving sanitation will in theory be to mitigate the full estimated losses. This assumes that the interventions are fully effective in isolating human excreta (at least in its harmful form) from the environment, and it assumes a linear reduction in economic impact at different levels of attribution. In other words, it is assumed that by removing x% of the pollution source, a similar x% of economic losses would be averted. However, such linearity cannot necessarily be assumed. Also, for some environmental effects where the environment has been degraded considerably over time, there will also need to be expenditure on a clean-up operation to bring the land and water resources back to usable or fully productive condition. These costs are not estimated in this present study. 101
106 ANNEXES A6.3 Market for sanitation inputs Economic impacts and with effects up the supply chain (multiplier effect), will be for small local entrepreneurs as well as larger, non-local companies. There is also a potential for improving livelihoods of poor people through sanitation programs, largely through health improvement and employment generation [88]. Given the needs of sanitation programs for human labor and materials, sanitation programs will have a number of economic effects, whether it be for small local entrepreneurs or larger companies. Table A32 presents the unit costs of different sanitation options. These unit costs reflect the cost per household associated with each improvement option. Financial costs are made up of purchased services (labor, materials, equipment), while economic costs also include non-purchased inputs to the sanitation option (such as household and community-provided labor). Sums also include the expected sale of hygiene products (soap, cleaning materials) for the hygiene interventions. These are multiplied by the expected coverage with different sanitation options to estimate total potential market values. However, since there is scarce information for calculation of economic costs, the present study attempts only to estimate the financial costs. While on the one hand the costs reflect government and household spending, it represents an economic gain for those involved in providing the services and will have broader economic effects. Table A32 also gives the number of households to receive different sanitation options. Allocation of each sanitation option is based on CMDG target for latrine improvement, and on National Biodigester Program (NBP) 34 target for EcoSan. The number of households to be receiving each improvement is based on the CMDG target of the sanitation coverage in 2015 which is 72% for urban areas and 30% for rural areas. It is estimated that to reach this CMDG target, more than 404 thousands households need to be equipped with an improved latrine, which is equivalent to 40 thousands households each year. However, since there are various sanitation improvement options available, the assumed number of households adopting each option needs to be allocated. In this case, as pit latrine is the least cost choice for most households in Cambodia, particularly in rural areas, it can be assumed that 40% of households will adopt simple pit latrine while the rest of other options are equally shared (ventilated pit latrine, septic tank, and sewer connection). For biodigester plants, however, the estimation of the number of plants is based on the NBP target to have 17,500 plants constructed between 2006 and Currently, since there are 600 plants 35 that have been constructed, the total remaining input number of biodigester plants is 16,900. So, the remaining number of households adopting this EcoSan needs to be allocated annually over four-year period, which gives 4,225 per year. Table A32. Unit prices of sanitation improvement options (per household) Variable Simple pit latrine VIP Septic tank with sludge removal Simple EcoSan Piped sewer connection Households to receive each improvement (annually) 16,171 8,085 8,085 4,225 8,085 Unit prices (US$) Super structure Slab Underground Total unit price (US$) Source: Informed choice manual on rural household latrine selection of MRD [100], National Bio-digester Program Cambodia [101]. 34 NBP is a national program of MAFF involving the reuse of animal dung and human waste for biogas and fertilizers. 35 Information Folder, National Biodigester Program Cambodia,
107 ANNEXES A6.4 Market for sanitation outputs Where human excreta is used as fertilizer, the availability of nutrients from human excreta can lead to the replacement of chemical fertilizer, which saves costs [102]. Furthermore, where fertilizer was not being used optimally before, the nutritional content and economic value of crops may increase. Also, there are long-term benefits of reducing the use of chemical and mineral fertilizers, especially taking into account the fact that some fossil resources are in increasingly short supply (e.g. phosphorous). Alternatively, families with livestock may instead invest in a biogas reactor, which provides biofuel for cooking and can even be used for lighting where other improved sources (electricity) are not available [103]. The reuse of human waste for fertilizer or biogas production cannot be assumed to be population-wide, given cultural attitudes towards handling and re-use of human waste, and low practical feasibility in many locations. Success often depends on local perceptions of the expected returns on re-use of human waste, whether it be for biogas or fertilizer. On the contrary, the re-use of animal waste tends to be adopted more widely among the rural population. In Cambodia, the NBP which is commissioned by the Ministry of Agriculture Forestry and Fisheries (MAFF), has largely involved in the re-use of both animal dung and human waste for biogas and fertilizer in rural households. However, the program focuses more on animal rather than human waste due to the large volume of waste required. This program mainly relates to the own-use of biogas and fertilizer. According to NBP, there are potentially 25% of rural households which are technically feasible for construction of biodigester plant considering geographically atmospheric condition. As of May 2007, only about 600 households have the biodigester plants, the main use being for biogas, while 72% also use them for fertilizer. According to the recent survey by NBP, the cash saving by using biogas for cooking and lighting is about US$11 per month, equivalent to US$132 per year [104]. The average annual sanitation output is estimated based on the annual allocation of the NBP target (17,500 households building biodigester plants) over 4 years from 2006 to In this sense, the number of households assumed to adopt EcoSan annually is estimated as 17,500 divided by 4 which is equal to 4,375. It is noted that Table A33 gives the number of households adopting EcoSan (biodigester plants) and the unit value gains from the output of biogas. For fertilizer, however, the value has not been estimated by NBP. Table A33. Input values for estimation of returns to re-use of human waste Variable Number of rural households adopting EcoSan (biodigester) Unit value per household (US$/year) Sales of fertilizer Source: National Biodigester Program Cambodia [101] A7 Uncertainty analysis Fertilizer Application to own land Current Annual average Sales of gas and sludge Biogas Current Own use Annual average , ,375 - N/A Tables A34, A35 and A36 provide alternative input values to reflect three main types of data uncertainty in the present study: Uncertainty in the estimation of overall impacts, such as in the epidemiological and economic variables (Table A34). Uncertainty in the attribution of the overall impact to poor sanitation (Table A35). Uncertainty in the actual size of impact mitigation achievable (Table A36). 103
108 ANNEXES Table A34 presents the main uncertain economic variables, and the alternative low and high values used in the one-way sensitivity analysis 36. Table A34. Alternative assumptions and values used in one-way sensitivity analysis Variables selected Low estimate of impact Base case estimate High estimate of impact Health Diarrheal incidence DHS data for under fives; WHO regional data for over fives; 70% of diarrheal cases attributed to poor S&H DHS data for under fives; WHO regional data for over fives; 88% of diarrheal cases attributed to poor S&H WHO regional data for all age groups; 88% of diarrheal cases attributed to poor S&H Hourly value of nonincome earning time economic only Hourly value of productive time for children Premature death Water Fish production and DO relationship 1 Other welfare Time access (minutes/day) Value of time Tourism Future growth in tourist numbers 30% of GDP per capita 30% of compensation of employees Children given value of zero Human capital approach, using 2% growth and GDP per capita Lower range used (fish less affected by low DO) Children given 50% value as adults Human capital approach, using 2% growth and compensation of employees Mid range used See under health above 10% increase per year; to 60% occupancy 20% increase per year; to 80% occupancy 1 The figure on fish production is based on the graph showing relationship between DO and fish production. Minimum wage Children given same value as adults VOSL benefit transfer of US$2 million, using 0.6 income elasticity Higher range used (fish more affected by low DO) 30% increase per year; to 80% occupancy For water pollution, it is assumed in the base case that 65% of pollution is originated from poor sanitation. Nevertheless, in the situation where other sources of pollution such as industry and agriculture become prominent, the low estimate case assumes poor sanitation contributes only 50% to water pollution. On the contrary, in the case where the release or leakage of human waste to water bodies remains increasingly significant it is assumed that 70% of water pollution is from poor sanitation. For tourism sector, 10% of tourist number impact attributed to poor sanitation is assumed for the base case, 5% for low estimate case, and 15% for high estimate case. Table A35 shows the possible linkage between poor sanitation and impacts using low estimate, base case estimate and high estimate. It is seen from the table that, in the base case, 88% of the diarrheal diseases are attributed to poor sanitation and hygiene, while 70% is used in the low estimate case and 95% for the high estimate case. While the low estimate refers to the fact that poor sanitation and hygiene do not have great impacts on diarrheal diseases, the high estimate assumes that nearly all diarrheal diseases are attributed to poor sanitation and hygiene, which is a rather extreme case. 36 In a one-way analysis, only one parameter at a time is varied. 104
109 ANNEXES Table A35. Alternative assumptions for links between poor sanitation and impacts Variables selected Health Disease incidence attributed to poor sanitation and hygiene (diarrhea cases) Water Water pollution attributed to poor sanitation Tourism Tourist numbers impact attributed to poor sanitation Low estimate of impact Lower value for disease incidence: 70% Base case estimate of impact Mid value for disease incidence: 88% High estimate of impact Higher value for disease incidence: 95% 50% 65% 70% 5% 10% 15% Table A36 below shows the achievable impacts of mitigation measure at different estimates: low case, base case, and optimistic case. The low case refers to the fact that although poor sanitation is mitigated, the achievable impact is not as high as the base case. For health impact, it is noted that while in the base case the improvement of sanitation and hygiene can reduce disease rate of 32-45%, the conservative case estimates that the mitigation can only reduce about 13-25%, while the optimistic case expects 47-60% reduction of diseases. For water pollution and tourism, while the impacts by poor sanitation can be 100% mitigated in the base case, in the conservative case, it is assumed that only 70% of impacts can be mitigated through the improvement of sanitation. Table A36. Alternative assumptions for impact mitigation Variables selected Low (conservative) estimate Base case estimate High (optimistic) estimate Health Sanitation-related diseases mitigated 13% 32% 47% Hygiene-related diseases mitigated 25% 45% 60% Water Sanitation-related drinking water pollution costs mitigated 70% 100% Not tested 1 Sanitation-related fish production costs mitigated Tourism Sanitation-related tourist losses mitigated Sanitation markets Sanitation output coverage (households using biodigester) 1 Value cannot be > 100% 70% 100% Not tested 1 70% 100% Not tested 1 1,000 4,375 5,
110 ANNEXES Annex B. Algorithms B1. Aggregating equations Total costs of sanitation and hygiene C = CH + CW + CU + CT Health related costs of poor sanitation and hygiene CH = CH_HC + CH_P + CH_D (1) (1) Water related costs of poor sanitation and hygiene CW = CW_Drink + CW_Domestic + CW_Fish (2) Other welfare losses of poor sanitation and hygiene CU = CU_T (3) Tourism losses from poor sanitation CT = CT_RL (4) B2. Health costs related to poor sanitation and hygiene Total health care costs CH _ HC = CH _ HCi i Health care cost per disease CH HC pop v phealth _ i = αi βi χih ih ih h Total productivity costs CH _ P = CH _ P i i Productivity cost of disease type i (8) CH P = α pop β dh ptime _ i i i i (5) (6) (7) Total cost of premature death CH _ D = CH _ D i i (9) Cost of premature death per disease (10) CH D = death γ pdeath _ i ia ia a a B3. Water related costs associated with poor sanitation and hygiene Total cost associated with accessing clean drinking water (11) CW _ Drink = CW _ Drinkm m 106
111 ANNEXES Cost of accessing clean drinking water per source/treatment method (12) CW Drink = h wdrink pwater δ π _ m m m m m Total domestic water access cost (excl. drinking water) (13) CW _ Domestic = CW _ Domesticm m Domestic water access cost by source/method (14) CW Domestic = h wdom pwater δ θ _ m m m m m Fisheries loss CW _ Fish = AFP PFP Potential fish production level AFP PFP = ε (15) (16) B4. Other welfare impacts Time access cost for unimproved latrine (18) CU _ T = pop _ u taccess ptime 365 B5. Tourism losses Lost revenues oco CT _ RL = ϕ 1 ta et oca (19) B6. Variable definition summary Tables B1 to B3 present the subscripts, variables and parameters used in the algorithms in Sections B1 to B5 above. Table B1. Subscripts used in algorithms Code Description Elements a Age group 0-4 years, 5-14 years, over 15 years i Disease types Diarrhea, Cholera, Typhoid, Malnutrition related diseases, etc h Health care provider Public hospital, private hospital, informal care, self-treatment m Treatment method Piped water, non-piped water, home-treated, hauled water 107
112 ANNEXES Table B2. Variables used in algorithms Symbol Description AFP Actual fish production value C Total cost of poor sanitation and hygiene CHC Health costs of poor sanitation and hygiene CH_HC Health care costs of all diseases CH_HC i Health care cost of disease type i CH_P Productivity costs of diseases CH_P i Productivity cost of disease type i CH_D Premature death costs of diseases CT Tourism losses associated with poor sanitation and hygiene CT_RL Revenue losses CU Other welfare losses associated with poor sanitation and hygiene CU_T Time access cost for unimproved latrine CW Water related costs of poor sanitation and hygiene CW_Drink Clean water drinking access costs CW_Drink m Clean water drinking access cost for method m CW_Domestic Domestic water access costs CW_Domestic m Domestic water access cost for method m CW_Fish Fisheries production loss death ia Number of premature deaths, by disease type i and age group a dh i Number of days taken off work or daily activities due to disease i egirls Number of adolescent girls enrolled in school et Expenditure per tourist (US$) h m Number of households using water source or treatment method oca Actual occupancy rate (%) oco Optimal occupancy rate (%) pahc Average health care cost per case pdeath a Value of premature death for age group a PFP Potential fish production value phealth ih Unit price of care (per visit or day) for disease type i at health facility h ptime Daily value of time pwater m Water price or time value per m 3 of water pop Population pop_u Population with unimproved access to sanitation ta Actual number of tourists taccess Average access time (journey or waiting) per day v ih wdrink m wdom m Visits to or days for disease type i at health facility h Drinking water consumption/hh (m 3 ) from water source/treatment method m Consumption/HH of domestic purpose (m 3 ) from water source/treatment method m 108

113 ANNEXES Table B3. Parameters used in algorithms Symbol Description α i β i χ ih Incidence rate per person of disease type i Proportion of episodes attributed to poor sanitation for disease type i Proportion of cases seeking care for disease type i and provider h γ ia δ ε Proportion of deaths attributable to poor sanitation, by disease type i and age group a Attributable water pollution to poor sanitation Ratio of the fish production at the current DO level to fish production at the optimal DO level µ Proportion of diseases related to sanitation π m θ m φ Importance of averting drinking polluted water in relation to overall benefits of piped water supply; where π m = 1 for m piped-water Importance of averting using polluted water in domestic activities in relation to overall benefits of piped water supply; where θ m = 1 for m piped-water Attributable tourism loss to poor sanitation 109