Dipti Shah, Town of Gilbert Tuesday, January 25, 2011
|
|
|
- Vernon Stewart
- 5 years ago
- Views:
Transcription

1 Dipti Shah, Town of Gilbert Tuesday, January 25, 2011


2 Background Treatment Plant Water Treatment Process Filter types Experiments Results Review Historical BAF /Non- BAF data Conclusion Recommendation
 and anthracite filters Uses chlorine as")
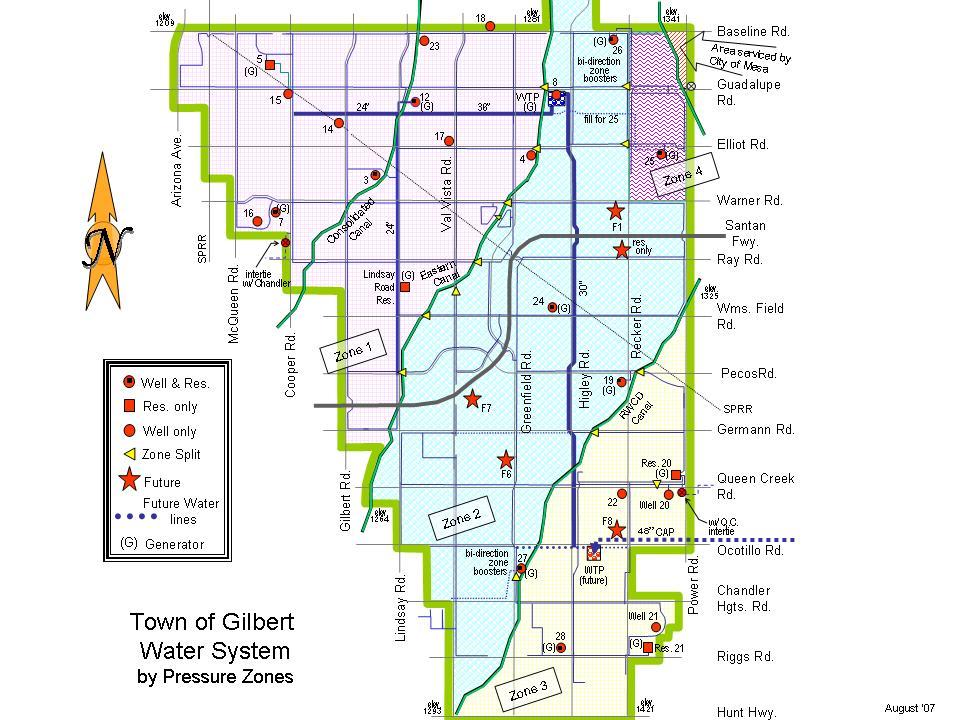
3 Town of Gilbert North Water Treatment Plant Originally built in 1997 for 15 MGD and expanded in 2002 to 30 MGD Current plant capacity is 45 MGD Treatment Process Treats SRP water Includes conventional treatment process using Alum as coagulant, Ozonation, and Granular Activated Carbon (GAC) and anthracite filters Uses chlorine as disinfection


 Elev. 1272--1248 Town of Gilbert WTP Flow Schematic Treatment Capacity 45 m.g.d.")
4 Elev Ozone Contact Chamber M Rapid & Flash 3-Stage Mixers Flocculation Filter Aid Chlorine Carbon Final Sedimentation Basin GAC or Anthracite Filters Elev Well #8 Well #4 16 m.g. Finished Water Reservoir Ozone Generator SRP Eastern Canal Elev. ~1278 O 3 Wash Water Recovery Clarifiers Acid, Polymer Bar Caustic Screen M Raw Water Flow Meter Pre-mix Well #8 Alum, Polymer Acid Carbon Chlorine Alum, Polymer Acid, Caustic Carbon Chlorine 18 Recovered Wash Water Pre-sedimentation Basin Pre-sed Basin Sludge Low Lift Pumps Elev Sludge Decant Elev Bypass Final Sed Basin Sludge Bypass Overflow of Wash Water Meter M Wash Water Recovery Basin 30 Spent Backwash Chlorine Fluoride compound Caustic 12 Decant Zone 2 Zone 1 Zone 4 (Fill for Well #25) Elev Town of Gilbert WTP Flow Schematic Treatment Capacity 45 m.g.d. Oct 07 Not to Scale wet Bi-directional Bypass Sludge Thickeners Polymer 5.0 M.G. Raw Water Impoundment Caustic Sludge Pumps Bypass Bypass Solar Drying Beds Elev. 1268

5 Types of Filters Used -Granular Activated Carbon (GAC) - Put in service in GAC and 6 of sand - Started backwashing with chlorinated water after experiencing under drain clogging - 10 filters

6 Anthracite filter media 48 depth no sand Effective size => mm 8 Filters Year in service
7 Biological Activated Carbon (BAC) filters Modified granular media filters Poorly understood treatment technique How do they work: Bacteria naturally present in influent attach to granular activated carbon, bacteria thrive and bio film created in the cracks and crevices Organic contaminants are absorbed by GAC. Bacteria on the carbon consume some of the organic material Organics not consumed by bacteria adsorbed by GAC. Bacteria on the carbon consume the desorbed organics
8 Ozone breaks down natural organic matter (NOM) into biodegradable organic Matter (BOM) BOM serves as carbon source for bacteria in the biologically active filters These likely results in the increase in biomass in the filter Thereby enhances biofilter s ability to degrade organics

9 Two GAC and two anthracite filters were selected to monitor the biological activity: Chlorine was shutdown for these units Ozone was left on at the original dosage Initiated the following sampling plan: Samples pulled prior to backwash for Color HPC Turbidity TOC DOC

10 Average TOC Concentration - GAC TOC, mg/l Raw Water Finished Water
11 6 Average TOC Concentration, Anthracite 5 4 TOC, mg/l Raw Water Finished Water

12 % TOC Removal - GAC Vs Anthracite 45% 40% 35% 30% % TOC Removal 25% 20% 15% 10% 5% 0% GAC Anthracite
13 Biological activity of the filters show degradation of TOC or DOC levels in the finished water GAC filters show higher % TOC removal than Anthracite filters Very small differences were observed between TOC and DOC levels
14 Comparison of BAF versus Non-BAF data Canal mix Raw and Finish TOC levels % TOC removal Chemical Dosage TTHM & HAA formation at NWTP & Distribution Comparison of three sites with high TTHM and HAA
15 Canal Mix Cubic Feet Per Sec (CFS) Filters Date SALT Verde CAP Total Wells Surface NON BAF 4/15/ /22/ BAF 4/21/ /21/


16 Canal Mix and TOC Removal Canal Mix and TOC removal 100% 90% 80% 70% 60% 50% 40% 30% 20% 10% 50% 45% 40% 35% 30% 25% 20% 15% 10% 5% Salt Verde % TOC Removal 0% Non-BAF 2009 BAF %
17 Raw and Finished Water TOC levels TOC, mg/l Filters Date RAW Finished % TOC Removal NON BAF 4/15/ % 7/22/ % BAF 4/21/ % 7/21/ %
18 Chemical Dosage mg/l Filters Date Alum Ozone % TOC Removal NON BAF 4/15/ % 7/22/ % BAF 4/21/ % 7/21/ %
19 TTHM & HAA formation at NWTP microgram/l (ppb) Filters Date TTHM HAA NON BAF 4/15/ /22/ BAF 4/21/ /21/
20 TTHM & HAA formation at Distribution three high points Site 1 microgram/l (ppb) Site 2 microgram/l (ppb) Site 3 microgram/l (ppb) Filters Date TTHM HAA TTHM HAA TTHM HAA NON BAF 4/15/ /22/ BAF 4/21/ /21/

21
22 Ozone enhanced BAF showed higher TOC removal for GAC than anthracite media Historical data shows: Higher % TOC removal using BAF with less alum use TTHM concentration at NWTP remained flat but distribution concentration was reduced from 140 ppb to 110 ppb 2010 data had a higher content of Verde water that may be the cause of high HAA formation Verde water has higher ratio of fulvic acid based organics BAC showed higher reduction in TTHM formation even with higher surface to well water ratio in the distribution
23 BAC treatment should be further studied and understood as it seems to offer many advantages: Higher DBP precursor removal Greener treatment technique using less chemicals Reduced chlorine usage Reduced DBP formation and helps meet newer regulations BAC needs to be well engineered to avoid: Underdrain clogging Operational issues such as head loss, representative sampling May need occasional shock chlorination

24
25 THANK YOU