Columbia Basin Operations and Flood Risk Management
|
|
|
- Warren Godwin Warren
- 5 years ago
- Views:
Transcription


1 Columbia Basin Operations and Flood Risk Management Julie Ammann, PE Chief, Reservoir Control Center Northwestern Division USACE US Army Corps of Engineers


2 BUILDING STRONG

3 The Columbia River Basin Drainage area of 259,000 square miles, dams control only about 25% of basin area 2 countries and 7 states Over 80 dams operated by multiple organizations Operated as a coordinated system to meet multiple purposes Travel time of days over 1200 miles About 15% of the basin is in Canada, and 35% of the average annual flow comes from Canada (as measured at The Dalles, Oregon)


, Canadian")


4 Managing a Complex System Flood Risk Management Navigation We work with other federal agencies (BPA, BOR, NWRFC, NOAA Fisheries, USFWS, EPA), Canadian partners, states, Tribes, PUDs, local agencies, non-federal dam operators, irrigators, navigators and the public. M&I/Irrigation Recreation Hydropower Fish & Wildlife
5 Federal Columbia River Power System (FCRPS) The FCRPS comprises 14 Federal multi-purpose projects Operated in a coordinated manner to provide flood control, navigation, power, recreation, irrigation, fish and wildlife, water quality, and water supply Corps operates and maintains 12 projects: 3 storage and 9 run-of-river US Bureau of Reclamation operates 2 storage projects Bonneville Power Administration markets and transmits power generated at the FCRPS projects


6 Columbia is the Most Powerful River Hydropower is measured by river flow times change in elevation (called head ) St. Lawrence and Mississippi have more flow, but much less head Grand Coulee has twice the head of Niagara Falls in North America Grand Coulee Niagara Falls & Powerhouse
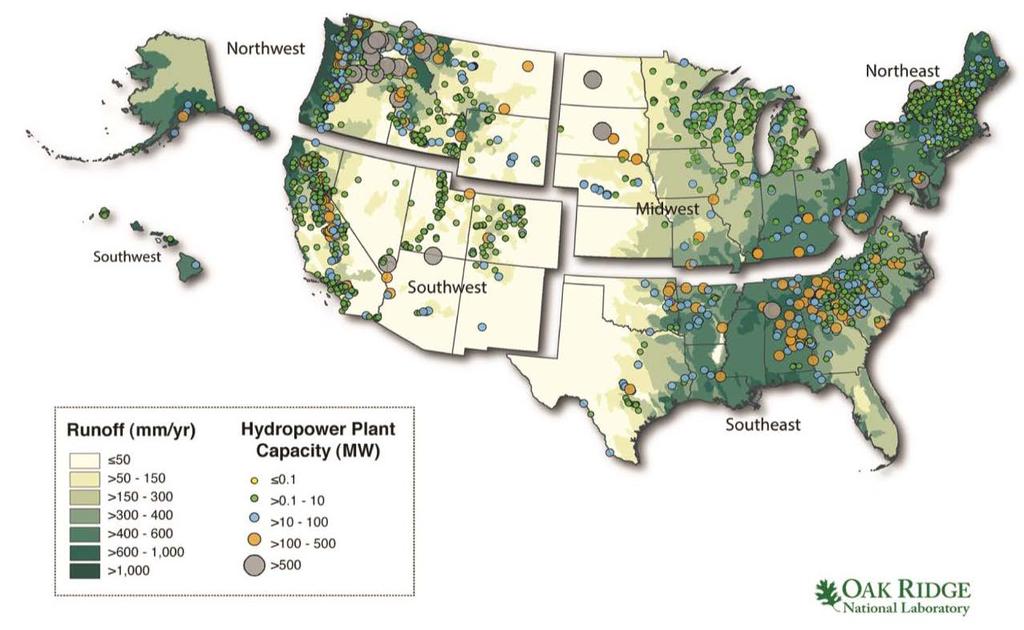
7 Map of US Hydropower Capacity and Annual Runoff
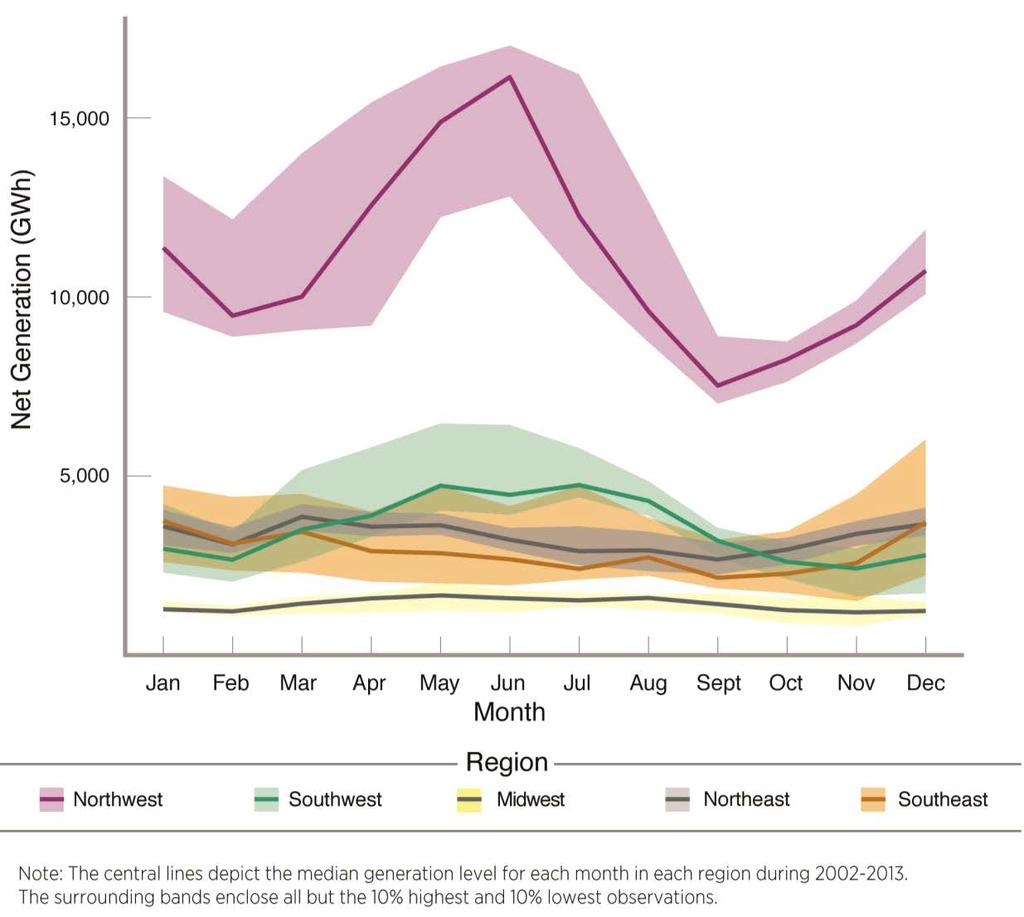
8 Hydropower Generation by Region


9 Navigation 485 miles of navigable waterways, serving 36 ports Approximately 12,000 commercial vessels and 100,000 recreational and charter vessels cross the Columbia River Bar each year Exports and imports annually exceed $18 20 billion 9

10 Water Supply Irrigation total of approximately 5.3 million acres in the Columbia Basin Over 1 million acres potentially impacted by Treaty operations M&I - Municipal and industrial water supply Instream Uses Flows for fish and other aquatic species Support for safe navigation Support for recreational uses 10

11 Recreation & Cultural Resources Operational decisions impact recreation and cultural resources Recreation Provides recreational and tourism opportunities throughout the region Cultural Resources Native American historic sites are an important consideration in all reservoir operations Monitored and protected BUILDING STRONG 11


12 Coordination with Tribes Signed Fish Accords in 2008 Treaty fishing Operations for fish Implementing the Biological Opinions Water quality standards and operations Shoreline protection ESA species Fish passage construction

13 Columbia River Basin Flood Storage Corps manages all flood control space even for non-corps projects Bulk of storage is in headwaters Treaty projects roughly doubled the storage capacity of the river BUILDING STRONG 13


14 Mica Treaty Projects Treaty Non-Treaty Generator Dam Completed Storage Storage Capacity Height DUNCAN Maf None None 130 ft. ARROW Maf 0.25 Maf 185 MW 170 ft. MICA Maf 5.0 Maf ~3000 MW 650 ft. LIBBY Maf None 604 MW 370 ft. Mica Duncan Keenleyside Dam Arrow Lake Libby BUILDING STRONG 14
15 Volume (million acre-feet) Average Annual Runoff vs. Usable Reservoir Storage Peak runoff: 192 MAF 2011 Peak runoff: 61.0 MAF Columbia River Missouri River Colorado River River Basin Average Annual Runoff Usable Reservoir Storage Columbia Basin reservoir storage is limited BUILDING STRONG
16 Runoff - Which Shape This Year? M A X I M U M S T O R A G E R E Q U I R E M E N T S M A X I M U M S T O R A G E R E Q U I R E M E N T S K C F S K C F S M A F 9. 5 M A F A P R F C S T = M A F APR MAY JUN JUL AUG 0 1 A P R F C S T = 10 3 M A F APR MAY JUN JUL AUG
17 Sep Flood Risk Management Seasonal System Operations Dec Water Year Jun Mar System operated per Flood Risk Operating Plan December through April end of month flood draft targets based on monthly water supply volume forecasts Storage projects meet both local and system requirements Refill start date dependent on runoff triggers Projects generally fill by June - August End of month flood draft targets


18 Evacuation Period Water Supply Forecasts (WSFs) estimate runoff volume expected in the spring and summer at key locations WSFs are issued early in the month Storage Reservation Diagrams are used at each reservoir to ensure flood control space is available before the flood event
19 Initiation of Refill The Dalles Unregulated Hydrograph Trigger for refill is based on unregulated flows at The Dalles, OR M A X I M U M S T O R A G E R E Q U I R E M E N T S K C F S Once unregulated flows are projected to hit the Initial Control Flow (ICF) refill is triggered Projects switch from drafting to filling ICF Date M A F ICF Volume to Store Volume to Pass A P R F C S T = M A F 0 APR MAY JUN JUL AUG
20 Flow Management Effects FLOWRATE in KCFS Sample (roughly average) flows at The Dalles, OR Regulation (storing and releasing water) reduces the spring flow and increases winter flows Lower spring flows improve flood risk management Higher winter flows are beneficial for power BUILDING STRONG 20


21 Two Types of High Water Events Spring Freshet -- Snow Melt; Function of temperature and precipitation Rain Events Generally sustained rain (atmospheric river) Willamette Basin and uncontrolled Lower Columbia flows play major role in winter floods
22 Storage Operations Timeline Jan Feb Mar Apr May Jun Jul Aug Sep Oct Nov Dec MINIMUM FLOW OR FRM OPERATE TO VARQ FRM FRM DRAFT Libby OPERATE TO STURGEON AND SALMON FLOW OBJ. OPERATE TO SALMON FLOW OBJECTIVES END OF DECEMBER VARIABLE DRAFT LIMITS OPERATE TO BULL TROUT FLOW OBJECTIVES MINIMUM FLOW OR FRM OPERATE TO VARQ FRM Hungry Horse VARIABLE DRAFT LIMITS OPERATE TO MCNARY SPRING FLOW OBJECTIVES OPERATE TO MCNARY SUMMER FLOW OBJECTIVES MINIMUM OUTFLOW FOR COLUMBIA FALLS (BULL TROUT) Albeni Falls WINTER ELEVATION REFILL FULL FOR SUMMER RECREATION BULL TROUT AND CHUM DRAFT TO WINTER ELEVATION BULL TROUT AND CHUM WINTER ELEVATION FRM DRAFT AND REFILL KOKANEE OPERATION Grand Coulee OPERATE FOR CHUM AND VERNITA BAR FLOW OBJECTIVES OPERATE TO PROVIDE 85% PROBABILITY OF REFILL TO APRIL 10 FRM ELEVATION OPERATE TO PRIEST RAPIDS AND MCNARY FLOW OBJECTIVES OPERATE TO MCNARY FLOW OBJECTIVES OPERATE FOR CHUM AND VERNITA BAR FLOW OBJECTIVES Dworshak OPERATE TO LOWER GRANITE SPRING FLOW OBJECTIVES OPERATE TO LOWER GRANITE SUMMER FLOW &TEMPERATURE OBJECTIVES MINIMUM FLOW OR FRM MINIMUM FLOW OR FRM Canadian Treaty Projects ARROW WHITEFISH FLOWS ARROW TROUT SPAWNING FLOWS STORE 1 MAF FLOW AUGMENTATION RELEASE FLOW AUGMENTATION ARROW AND MICA TREATY OPERATIONS DUNCAN DRAFT TO EMPTY IN APRIL AND REFILL BY EARLY AUGUST TREATY OPERATIONS (INCLUDING PROPORTIONAL DRAFT IN DRY YEARS) DUNCAN TO MEET DOWNSTREAM FLOW REQUIREMENTS FOR FISH Legend: FISH OPERATION F R M or POWER OPERATION OTHER PURPOSES


23 Operations for Fish Flow Augmentation Temperature Spring and Summer Spill Surface Passage Juvenile Fish Transport BUILDING STRONG 23

24 BUILDING STRONG
 Can conflict with other operations must be coordinated! Safety considerations Seasonal timing Contingencies and unexpected events, etc.")
25 Special Operation Coordination Generally includes requests for flows, tailwater elevation, forebay elevation, specific outlets, etc Must consider fish impacts (compliance with BiOps) Can conflict with other operations must be coordinated! Safety considerations Seasonal timing Contingencies and unexpected events, etc.


26 In Summary Multiple purposes & interests Flood Risk Management Fish & Wildlife Hydropower Water Supply Recreation Navigation Cultural Resources/Tribes USACE works with our partners to strike a balance among these interests
27 Questions?